Adidas stock forecast: Third-party price targets
Adidas is a global sportswear manufacturer listed in Germany, with its share price influenced by earnings results, currency movements, consumer trends and broader equity-market conditions. Explore ADS’s recent price action, third-party price targets, and technical analysis.
Adidas AG (ADS) is trading around €162.40 in intraday European dealings on 15 January 2026, moving within a session range of approximately €159.30–€164.70 as of 3:03pm UTC. Past performance is not a reliable indicator of future results.
Recent ADS movements follow strong operating trends reported for the third quarter of 2025, when Adidas highlighted double‑digit currency‑neutral revenue growth and an operating margin above 10%, alongside record quarterly sales (Adidas, 29 October 2025). Trading also unfolds against a backdrop of broadly firm European equity indices at the start of 2026, with major regional benchmarks hovering near record levels (Reuters, 2 January 2026).
Adidas stock forecast 2026–2030: Third-party price targets
As of 15 January 2026, third-party Adidas stock predictions show a wide range of 12-month views, reflecting differing assumptions around consumer demand, currency effects and brand momentum. Published targets in December 2025 and January 2026 generally represent revisions to existing coverage, rather than initial rating initiations.
Bank of America (broker research)
Bank of America cut its 12-month price target for Adidas to €160 from €213 in a double downgrade to Underperform, describing the new level as reflecting a shift to a single-digit organic sales growth profile and corresponding EBIT margin expectations. The bank cites a deteriorating sector backdrop and reduced medium-term earnings forecasts, arguing that the turnaround narrative is now well recognised following a period of event-driven demand and subsequent slowing momentum (Investing.com, 6 January 2026).
Grupo Santander (initiation note)
Grupo Santander initiated coverage of Adidas with an Outperform rating and a ADS stock forecast of €212.20, describing this as a 12-month view on the Frankfurt-listed shares. The broker points to potential benefits from product cycles and brand positioning, while also acknowledging competitive pressures and execution risks within its assumptions for revenue growth and margins (MarketScreener, 14 January 2026).
StockScan (ADDDF model forecast)
StockScan assigns an average projected value of $163.98 for Adidas AG’s OTC listing (ADDDF) for calendar year 2026, presenting this as a model-driven forecast with higher and lower scenario ranges around a central estimate. The service explains that its projections are derived from historical price behaviour and trend-based assumptions, and cautions that quantitative forecasts remain sensitive to volatility and news flow (StockScan, 14 January 2026).
Predictions and third-party forecasts are inherently uncertain, as they cannot fully account for unexpected market developments. Past performance is not a reliable indicator of future results.
ADS stock price: Technical overview
The ADS stock price is hovering around €162.40 as of 3:03pm UTC on 15 January 2026, sitting below a broad cluster of daily moving averages. The 20-, 50-, 100- and 200-day simple moving averages are located around €166, €162, €171 and €186 respectively. The 14-day RSI is near the mid-40s, suggesting neutral, sideways momentum, while a subdued ADX reading around 14 points points to a weakly defined trend rather than a strong directional phase.
On the topside, the first reference area is the classic R1 pivot near €173.32, with a sustained daily close above that level potentially bringing the €177.58 R2 area back into view. On pullbacks, the classic pivot around €165.43 represents initial support. Below that, the S1 level near €161.17 becomes relevant, while the 100-day SMA near €171 continues to act as a notable overhead reference (TradingView, 15 January 2026).
This technical analysis is provided for informational purposes only and does not constitute financial advice or a recommendation to buy or sell any instrument.
Adidas share price history (2024–2026)
Adidas shares spent much of 2024 trading in a relatively tight range between €220 and €240, closing the year at around €236 after several swings between late-summer highs near €244 and autumn pullbacks toward €215. In early 2025, the price extended higher into the mid-€250s and briefly above €260 in February before losing momentum. By mid-year, the shares had rolled over from levels above €240 and moved back below €200. A sharp gap lower in late October saw the stock fall from around €185 into the mid-€160s in a single session. By 15 January 2026, Adidas closed at €162.90, leaving the share price well below the highs seen in the first half of 2025 and materially lower on a 12-month view.
Past performance is not a reliable indicator of future results. Share prices are indicative and may differ from live market prices.
Adidas (ADS): Capital.com analyst view
The ADS stock price has declined sharply from the levels seen in early 2025, when the stock traded above €250, to the mid-€160s by mid-January 2026. This move reflects a broader reset following a period of rapid earnings recovery and record quarterly revenues. On one hand, recent results have highlighted solid top-line growth, improving gross margins and record quarterly sales, which some market participants may view as supportive for the company’s longer-term earnings profile. On the other hand, the pullback in the share price suggests that valuation considerations, execution risks and the extent to which positive developments were already priced in remain central to the market debate.
Fundamentals therefore remain in focus. Adidas reported double-digit currency-neutral revenue growth through 2024 and into 2025, with Q3 2025 net sales of around €6.63 billion and a gross margin above 50%. These figures point to strong brand positioning and broad-based regional demand. At the same time, changes in discretionary spending, broader equity-market conditions or any shortfall in execution could limit or reverse share-price moves. As with all listed equities, Adidas shares can move in both directions as new information becomes available.
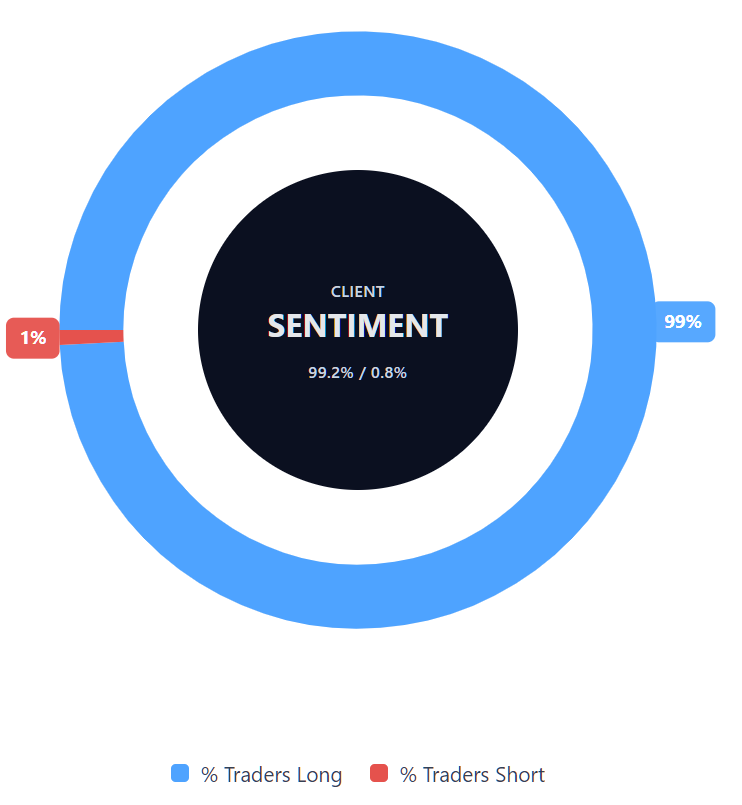
Capital.com’s client sentiment for Adidas CFDs
As of 15 January 2026, Capital.com client positioning in Adidas CFDs shows buyers at 99.2% versus sellers at 0.8%, indicating a heavily one-sided long bias, with buyers ahead by approximately 98.4 percentage points. This snapshot reflects open positions held on Capital.com and may change over time.
Summary – Adidas stock price
- Adidas shares started 2025 in the mid-€230s and rose above €260 in February before losing momentum later in the year.
- After trading largely between €220 and €250 through the first half of 2025, the price reversed from the €250–€260 area and fell back below €200 by mid-year.
- A sharp decline in late October 2025 saw the shares gap down from the high-€180s into the mid-€160s, marking a clear break from the earlier uptrend.
- By December 2025, Adidas was trading in a mid-€160s to high-€160s range, well below the highs recorded earlier in the year.
Past performance is not a reliable indicator of future results.
FAQ
Who owns the most Adidas stock?
Adidas has a widely distributed shareholder base, with its largest holdings typically held by institutional investors rather than individual shareholders. These include global asset managers, pension funds and investment firms that hold shares on behalf of clients. The company’s free float is relatively high, meaning ownership is spread across many investors, and no single shareholder dominates control. Shareholder positions can change over time as institutions rebalance portfolios or respond to new information.
What is the 5-year Adidas share price forecast?
There is no single, reliable five-year ADS stock forecast, as long-term projections depend on assumptions around consumer demand, brand execution, currency movements and broader economic conditions. Most publicly available analyst targets focus on a 12-month horizon rather than multi-year outcomes. Over longer periods, Adidas’ share price has shown both strong advances and sharp pullbacks, illustrating the uncertainty involved in extending forecasts several years ahead.
Is Adidas a good stock to buy?
Whether Adidas is considered a ‘good’ stock depends on an individual’s objectives, risk tolerance and market outlook. The company benefits from global brand recognition and exposure to sportswear demand, but its shares can be sensitive to earnings expectations, currency effects and changes in consumer spending. Market participants often weigh these factors differently, which is reflected in the wide range of analyst views. This information is provided for general market context only and is not investment advice.
Could Adidas stock go up or down?
Adidas’ share price can move both up and down, influenced by factors such as earnings results, guidance updates, competitive dynamics and broader market conditions. External elements, including foreign-exchange movements and shifts in consumer behaviour, may also affect performance. Like all listed equities, Adidas shares respond to new information as it emerges, meaning price movements are not one-directional and can change over both short and extended periods.
Should I invest in Adidas stock?
Deciding whether to invest in Adidas stock requires careful consideration of your financial situation, time horizon and risk appetite. Equities can experience significant volatility, and past performance does not guarantee future results. Investors often assess company fundamentals alongside wider market conditions and alternative opportunities. This article is for informational purposes only and does not constitute a recommendation or personalised investment advice.
Can I trade Adidas CFDs on Capital.com?
Yes, you can trade Adidas CFDs on Capital.com. Trading share CFDs lets you speculate on price movements without owning the underlying asset and to take long or short positions. However, contracts for difference (CFDs) are traded on margin, and leverage amplifies both profits and losses. You should ensure you understand how CFD trading works, assess your risk tolerance, and recognise that losses can occur quickly.