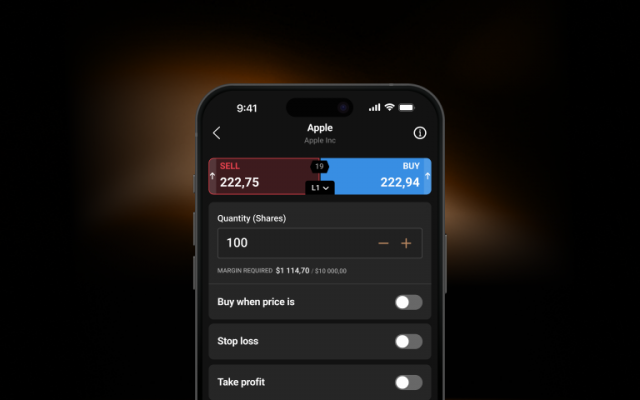
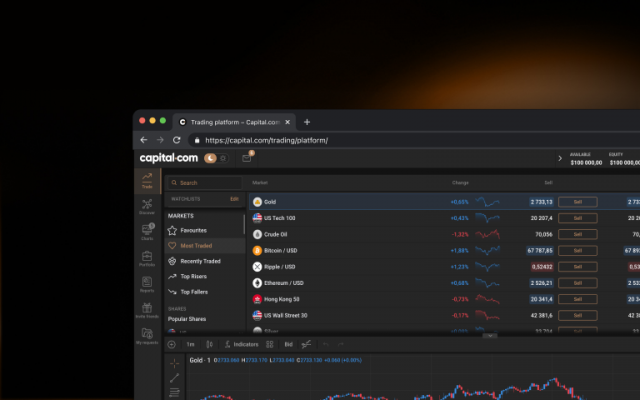
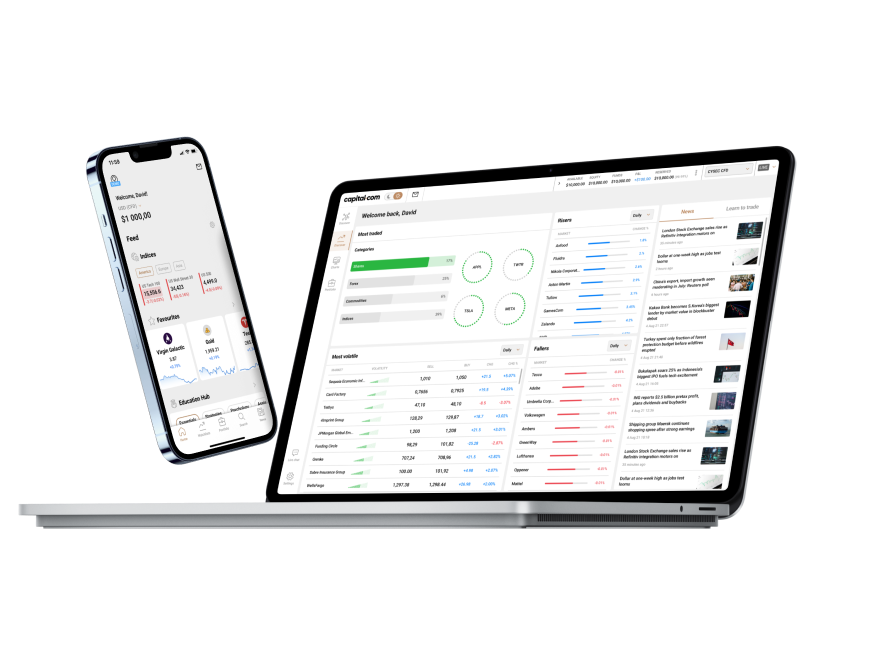
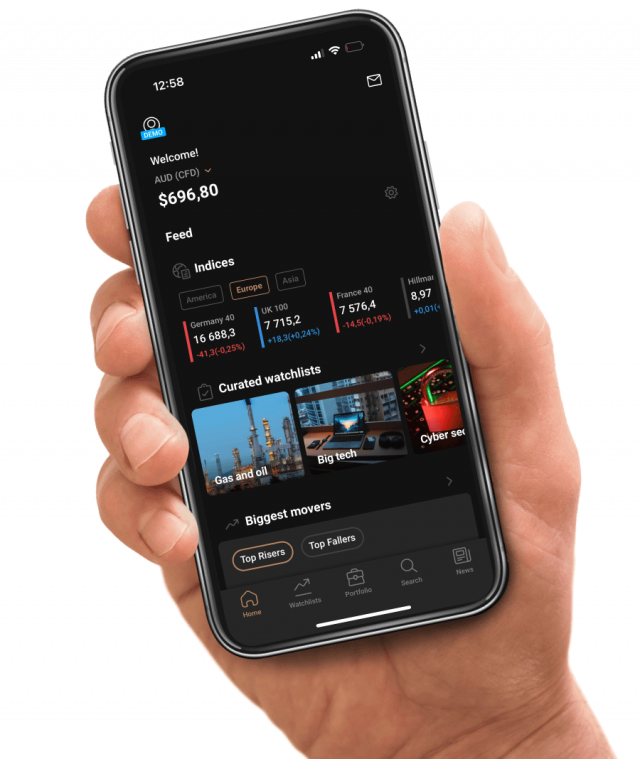
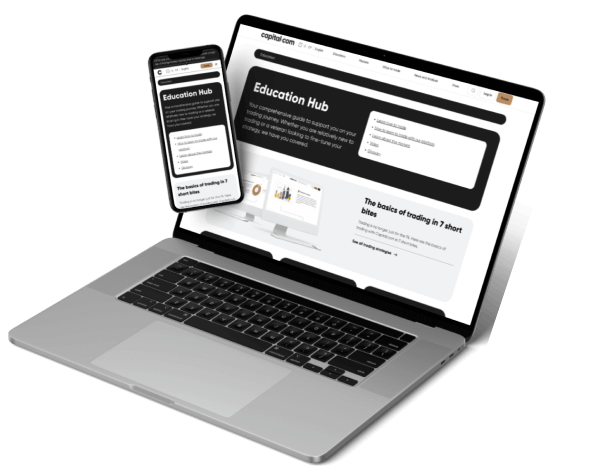
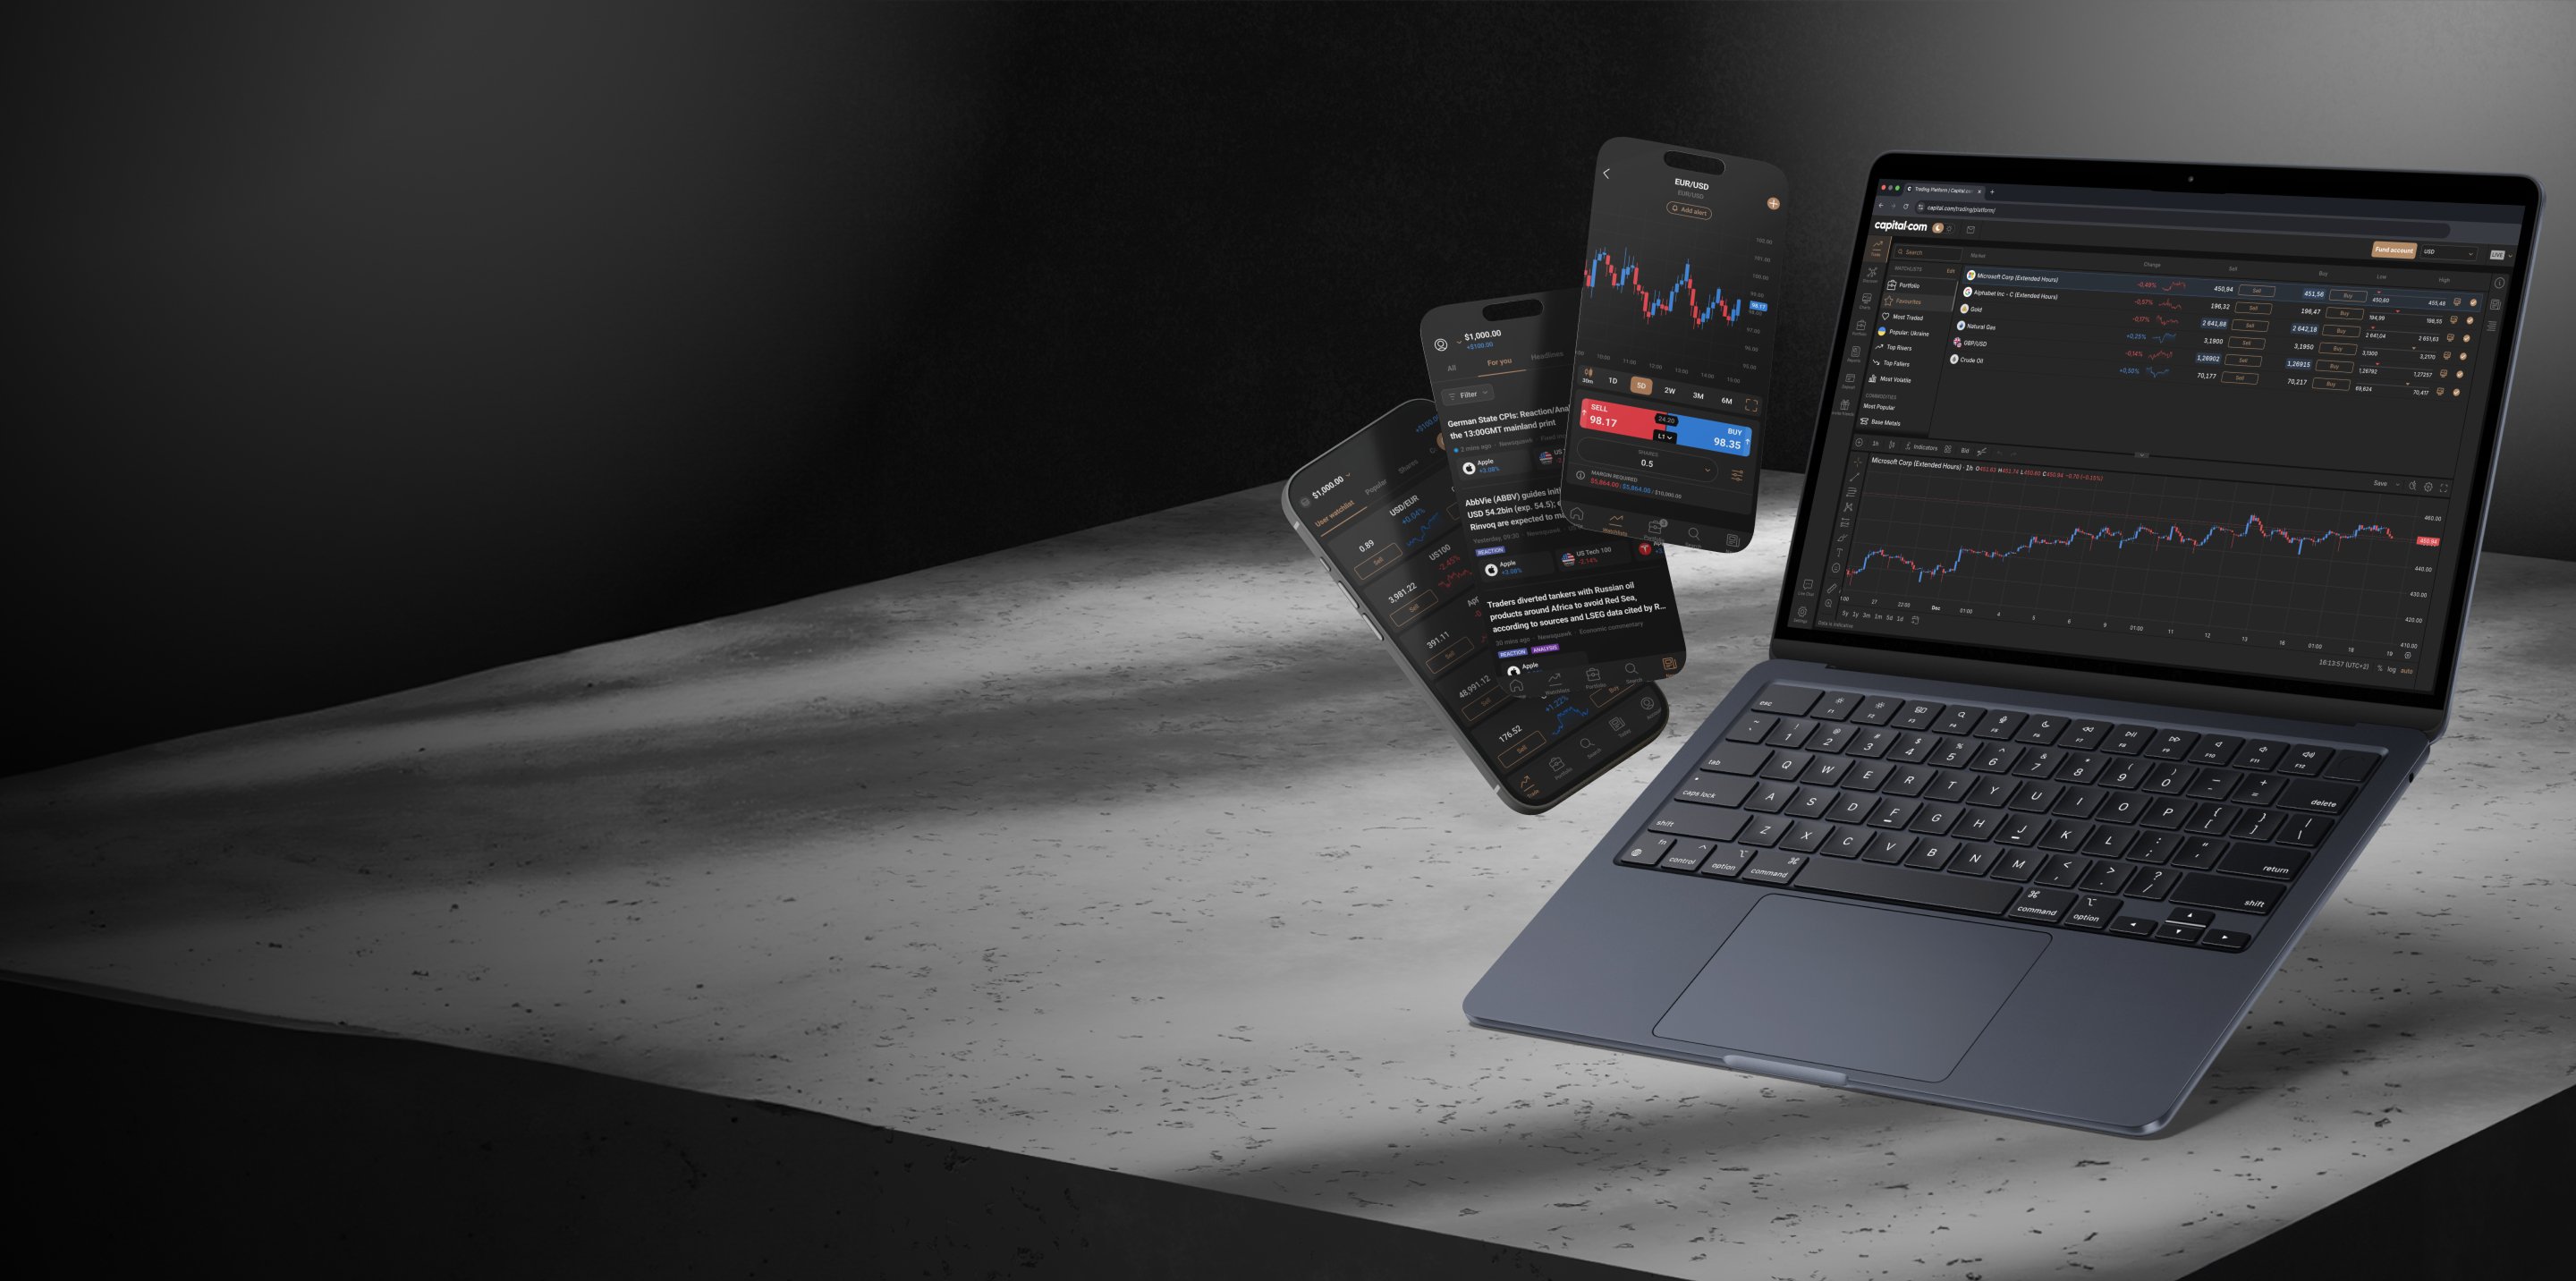
Operaciones Gladstone Land - LAND CFD
Agregar a Favoritos- Resumen
- Datos históricos
- Eventos
- Cuenta de resultados
- Balance de situación
- Flujo de caja
- Propiedad
Diferencial | 0.07 | ||||||||
Tarifa nocturna posición alcista
Ir a la plataforma | -0.026346% | ||||||||
Tarifa nocturna posición bajista
Ir a la plataforma | 0.004124% | ||||||||
Horario tarifa nocturna | 22:00 (UTC) | ||||||||
Cantidad comercializada mínima | 1 | ||||||||
Divisa | USD | ||||||||
Margen | 5% | ||||||||
Mercado de valores | United States of America | ||||||||
Comisión por operación | 0% |
*Information provided by Capital.com
Gladstone Land Corp ESG Risk Ratings
‘D’ score indicates poor relative ESG performance and insufficient degree of transparency in reporting material ESG data publicly.
Cierre previo* | 14.54 |
Abrir* | 14.64 |
Cambio de 1 año* | -27.52% |
Rango del día* | 14.46 - 14.81 |
Rango de 52 semanas | 13.35-20.92 |
Volumen medio (10 días) | 157.32K |
Volumen medio (3 meses) | 3.19M |
Capitalización de mercado | 517.15M |
Ratio P/E | -100.00K |
Acciones en circulación | 35.84M |
Ingresos | 91.41M |
EPS | -0.31 |
Dividendo (Rendimiento %) | 3.85863 |
Beta | 1.05 |
Próxima fecha de resultados | Feb 19, 2024 |
"Todos los datos son proporcionados por Refinitiv, excepto los datos marcados con un asterisco, que son *datos proporcionados por Capital.com"
- Last Week
- Last Month
- Last Year
- Last two Years
- Max
- Cada día
- Cada semana
- Cada mes
Date | Cierre | Change | Change (%) | Apertura | Alto | Bajo |
---|---|---|---|---|---|---|
Dec 5, 2023 | 14.54 | -0.10 | -0.68% | 14.64 | 14.72 | 14.48 |
Dec 4, 2023 | 14.80 | 0.31 | 2.14% | 14.49 | 14.93 | 14.48 |
Dec 1, 2023 | 14.67 | 0.39 | 2.73% | 14.28 | 14.76 | 14.23 |
Nov 30, 2023 | 14.33 | -0.16 | -1.10% | 14.49 | 14.57 | 14.30 |
Nov 29, 2023 | 14.47 | 0.06 | 0.42% | 14.41 | 14.66 | 14.39 |
Nov 28, 2023 | 14.40 | 0.11 | 0.77% | 14.29 | 14.47 | 14.16 |
Nov 27, 2023 | 14.35 | 0.05 | 0.35% | 14.30 | 14.47 | 14.30 |
Nov 24, 2023 | 14.44 | 0.06 | 0.42% | 14.38 | 14.53 | 14.28 |
Nov 22, 2023 | 14.44 | -0.04 | -0.28% | 14.48 | 14.62 | 14.27 |
Nov 21, 2023 | 14.41 | 0.21 | 1.48% | 14.20 | 14.42 | 14.09 |
Nov 20, 2023 | 14.29 | -0.05 | -0.35% | 14.34 | 14.35 | 14.22 |
Nov 17, 2023 | 14.37 | -0.16 | -1.10% | 14.53 | 14.60 | 14.33 |
Nov 16, 2023 | 14.45 | -0.14 | -0.96% | 14.59 | 14.59 | 14.39 |
Nov 15, 2023 | 14.63 | 0.05 | 0.34% | 14.58 | 14.80 | 14.56 |
Nov 14, 2023 | 14.69 | 0.52 | 3.67% | 14.17 | 14.88 | 14.17 |
Nov 13, 2023 | 14.07 | 0.30 | 2.18% | 13.77 | 14.12 | 13.66 |
Nov 10, 2023 | 13.79 | 0.19 | 1.40% | 13.60 | 13.86 | 13.53 |
Nov 9, 2023 | 13.60 | -0.23 | -1.66% | 13.83 | 13.85 | 13.55 |
Nov 8, 2023 | 13.76 | -0.47 | -3.30% | 14.23 | 14.25 | 13.53 |
Nov 7, 2023 | 14.48 | 0.10 | 0.70% | 14.38 | 14.54 | 14.38 |
Gladstone Land Events
Hora (UTC) (UTC) | País | Evento |
---|---|---|
Friday, December 15, 2023 | ||
Hora (UTC) (UTC) 12:00 | País US
| Evento Gladstone Land Corp Gladstone Land CorpFox Extended -Anterior - |
Hora (UTC) (UTC) 12:00 | País US
| Evento Gladstone Land Corp Gladstone Land CorpFox Extended -Anterior - |
Hora (UTC) (UTC) 12:00 | País US
| Evento Gladstone Land Corp Gladstone Land CorpFox Extended -Anterior - |
Hora (UTC) (UTC) 12:00 | País US
| Evento Gladstone Land Corp Gladstone Land CorpFox Extended -Anterior - |
Monday, February 19, 2024 | ||
Hora (UTC) (UTC) 21:00 | País US
| Evento Q4 2023 Gladstone Land Corp Earnings Release Q4 2023 Gladstone Land Corp Earnings ReleaseFox Extended -Anterior - |
- Anual
- Trimestral
2022 | 2021 | 2020 | 2019 | 2018 | |
---|---|---|---|---|---|
Ingresos totales | 89.236 | 75.318 | 57.031 | 40.692 | 36.687 |
Ingresos | 89.236 | 75.318 | 57.031 | 40.692 | 36.687 |
Coste de los ingresos, total | 11.034 | 8.784 | 6.078 | 6.046 | 4.88 |
Beneficio bruto | 78.202 | 66.534 | 50.953 | 34.646 | 31.807 |
Gastos totales de explotación | 55.315 | 43.614 | 29.38 | 21.386 | 24.575 |
Gastos de venta/general/administración Gastos, total | 7.624 | 7.647 | 6.647 | 4.093 | 3.654 |
Depreciation / Amortization | 35.366 | 27.183 | 16.655 | 12.79 | 9.375 |
Gastos (ingresos) extraordinarios | 1.291 | ||||
Other Operating Expenses, Total | 0 | -1.543 | 6.666 | ||
Ingresos de explotación | 33.921 | 31.704 | 27.651 | 19.306 | 12.112 |
Ingresos por intereses (gastos), netos No operativos | -25.811 | -24.944 | -20.625 | -16.331 | -12.13 |
Gain (Loss) on Sale of Assets | -3.816 | -2.469 | -2.11 | -0.318 | 5.338 |
Otros, netos | 0.422 | -0.777 | 0.039 | -0.895 | -2.554 |
Ingresos netos antes de impuestos | 4.716 | 3.514 | 4.955 | 1.762 | 2.766 |
Ingresos netos después de impuestos | 4.716 | 3.514 | 4.955 | 1.762 | 2.766 |
Intereses menores | -0.008 | -0.019 | -0.029 | -0.021 | -0.137 |
Beneficio neto antes de partidas extra. Elementos | 4.708 | 3.495 | 4.926 | 1.741 | 2.629 |
Ingresos netos | 4.708 | 3.495 | 4.926 | 1.741 | 2.629 |
Ingresos disponibles para los accionistas, excluyendo las partidas extra. Elementos | -15.01 | -8.763 | -4.396 | -2.499 | 2.25 |
Ingresos disponibles para los accionistas, incluidos los elementos extra. Elementos | -15.01 | -8.763 | -4.396 | -2.499 | 2.25 |
Beneficio neto diluido | -15.01 | -8.763 | -4.396 | -2.499 | 2.25 |
Promedio ponderado de acciones diluidas | 34.5635 | 30.3573 | 22.2581 | 19.6025 | 15.5033 |
BPA diluido sin partidas extraordinarias | -0.43427 | -0.28866 | -0.1975 | -0.12748 | 0.14513 |
Dividends per Share - Common Stock Primary Issue | 0.5922 | 0.54075 | 0.53715 | 0.53415 | 0.5319 |
BPA normalizado diluido | -0.2816 | -0.20733 | -0.1027 | -0.11126 | -0.19918 |
Total Adjustments to Net Income | -19.718 | -12.258 | -9.322 | -4.24 | -0.379 |
Jun 2023 | Mar 2023 | Dec 2022 | Sep 2022 | Jun 2022 | |
---|---|---|---|---|---|
Ingresos totales | 21.21 | 21.202 | 24.791 | 24.209 | 20.293 |
Ingresos | 21.21 | 21.202 | 24.791 | 24.209 | 20.293 |
Coste de los ingresos, total | 3.009 | 3.252 | 2.835 | 2.769 | 2.715 |
Beneficio bruto | 18.201 | 17.95 | 21.956 | 21.44 | 17.578 |
Gastos totales de explotación | 13.383 | 13.757 | 15.224 | 14.566 | 12.16 |
Gastos de venta/general/administración Gastos, total | 1.256 | 1.367 | 2.635 | 1.65 | 1.141 |
Depreciation / Amortization | 9.044 | 9.119 | 9.483 | 9.146 | 8.392 |
Ingresos de explotación | 7.827 | 7.445 | 9.567 | 9.643 | 8.133 |
Ingresos por intereses (gastos), netos No operativos | -5.975 | -6.063 | -6.311 | -6.5 | -6.523 |
Gain (Loss) on Sale of Assets | 6.394 | -1.497 | -1.765 | -0.819 | -0.305 |
Otros, netos | -0.391 | 1.865 | -0.381 | -0.518 | -0.692 |
Ingresos netos antes de impuestos | 7.855 | 1.75 | 1.11 | 1.806 | 0.613 |
Ingresos netos después de impuestos | 7.855 | 1.75 | 1.11 | 1.806 | 0.613 |
Intereses menores | 0 | 0 | 0.001 | -0.002 | 0.003 |
Beneficio neto antes de partidas extra. Elementos | 7.855 | 1.75 | 1.111 | 1.804 | 0.616 |
Ingresos netos | 7.855 | 1.75 | 1.111 | 1.804 | 0.616 |
Total Adjustments to Net Income | -6.128 | -6.07 | -5.917 | -5.398 | -4.489 |
Ingresos disponibles para los accionistas, excluyendo las partidas extra. Elementos | 1.727 | -4.32 | -4.806 | -3.594 | -3.873 |
Ingresos disponibles para los accionistas, incluidos los elementos extra. Elementos | 1.727 | -4.32 | -4.806 | -3.594 | -3.873 |
Beneficio neto diluido | 1.727 | -4.32 | -4.806 | -3.594 | -3.873 |
Promedio ponderado de acciones diluidas | 35.7228 | 35.5474 | 34.8378 | 34.6074 | 34.5201 |
BPA diluido sin partidas extraordinarias | 0.04834 | -0.12153 | -0.13795 | -0.10385 | -0.1122 |
Dividends per Share - Common Stock Primary Issue | 0.1382 | 0.1378 | 0.1833 | 0.1368 | 0.1362 |
BPA normalizado diluido | -0.1246 | -0.04692 | -0.07325 | -0.05126 | -0.10591 |
Gastos (ingresos) extraordinarios | 0.074 | 0.019 | 0.271 | 1.001 | -0.088 |
- Anual
- Trimestral
2022 | 2021 | 2020 | 2019 | 2018 | |
---|---|---|---|---|---|
Efectivo e inversiones a corto plazo | 61.141 | 16.708 | 9.218 | 13.688 | 14.73 |
Efectivo y Equivalentes | 61.141 | 16.708 | 9.218 | 13.688 | 14.73 |
Total Activos | 1457.25 | 1351.55 | 1067.29 | 816.787 | 565.119 |
Propiedad/Planta/Equipo, Total - Neto | 1326.05 | 1284.47 | 1046.34 | 792.259 | 538.953 |
Propiedad/Planta/Equipo, Total - Bruto | 1432.39 | 1357.8 | 1095.44 | 827.255 | 563.004 |
Depreciación acumulada, total | -106.966 | -74.002 | -49.236 | -35.174 | -24.051 |
Intangibles, neto | 9.819 | 4.509 | 3.732 | 4.827 | 5.686 |
Otros activos a largo plazo, total | |||||
Other Assets, Total | 54.44 | 42.764 | 6.8 | 6.013 | 5.75 |
Payable/Accrued | 16.266 | 10.874 | 9.081 | 10.132 | 9.152 |
Documentos por pagar/deuda a corto plazo | 0 | 0 | 0 | 0 | 0 |
Otros pasivos corrientes, total | 4.37 | 4.224 | 2.484 | 2.169 | 0.945 |
Total Pasivo | 725.889 | 764.735 | 683.499 | 540.166 | 388.873 |
Total de la deuda a largo plazo | 685.607 | 726.678 | 652.655 | 510.288 | 364.012 |
Deuda a largo plazo | 685.607 | 726.678 | 652.655 | 510.288 | 364.012 |
Intereses minoritarios | 0 | 2.251 | 0 | 2.349 | 4.807 |
Otros Pasivos, Total | 19.029 | 20.044 | 19.149 | 15.056 | 9.957 |
Total del patrimonio neto | 731.362 | 586.815 | 383.79 | 276.621 | 176.246 |
Acciones ordinarias | 0.035 | 0.034 | 0.026 | 0.021 | 0.018 |
Capital pagado adicional | 836.674 | 668.275 | 440.47 | 315.77 | 202.053 |
Ganancias retenidas (déficit acumulado) | -114.37 | -80.467 | -55.213 | -38.785 | -25.826 |
Total pasivo y patrimonio neto | 1457.25 | 1351.55 | 1067.29 | 816.787 | 565.119 |
Total de acciones ordinarias en circulación | 35.0504 | 34.21 | 26.219 | 20.9367 | 17.8913 |
Total de existencias | 0 | ||||
Otros fondos propios, total | 9.007 | -1.036 | -1.5 | -0.39 | 0.001 |
Gastos acumulados | 0.617 | 0.664 | 0.13 | 0.172 | |
Redeemable Preferred Stock | 0.016 | 0.009 | 0.007 | 0.005 | |
Total Preferred Shares Outstanding | 16.1474 | 9.4494 | 7.0445 | 4.75587 | |
Inversiones a largo plazo | 5.8 | 3.1 | 1.2 |
Jun 2023 | Mar 2023 | Dec 2022 | Sep 2022 | Jun 2022 | |
---|---|---|---|---|---|
Efectivo e inversiones a corto plazo | 48.208 | 38.728 | 61.141 | 37.006 | 48.444 |
Efectivo y Equivalentes | 48.208 | 38.728 | 61.141 | 37.006 | 48.444 |
Total Activos | 1428.73 | 1426.45 | 1457.25 | 1437.81 | 1410.32 |
Propiedad/Planta/Equipo, Total - Neto | 1309.41 | 1316.18 | 1326.05 | 1329.2 | 1300.94 |
Propiedad/Planta/Equipo, Total - Bruto | 1433.71 | 1431.76 | 1432.39 | 1427.48 | 1390.65 |
Depreciación acumulada, total | -124.3 | -115.578 | -106.966 | -98.285 | -89.706 |
Intangibles, neto | 9.02 | 9.475 | 9.819 | 6.867 | 5.441 |
Inversiones a largo plazo | 5.8 | 5.8 | 5.8 | 5.8 | 3.1 |
Other Assets, Total | 56.29 | 56.264 | 54.44 | 58.942 | 52.396 |
Payable/Accrued | 14.096 | 9.674 | 16.266 | 11.572 | 14.575 |
Gastos acumulados | |||||
Documentos por pagar/deuda a corto plazo | 0 | 0 | 0 | 0 | 0 |
Otros pasivos corrientes, total | 3.095 | 3.034 | 4.37 | 3.253 | 2.974 |
Total Pasivo | 693.798 | 691.57 | 725.889 | 730.586 | 758.389 |
Total de la deuda a largo plazo | 653.069 | 658.267 | 685.607 | 698.751 | 720.848 |
Deuda a largo plazo | 653.069 | 658.267 | 685.607 | 698.751 | 720.848 |
Intereses minoritarios | 0 | 0 | 0 | 0 | 0 |
Otros Pasivos, Total | 23.538 | 20.595 | 19.646 | 17.01 | 19.992 |
Total del patrimonio neto | 734.934 | 734.88 | 731.362 | 707.226 | 651.932 |
Redeemable Preferred Stock | 0.016 | 0.016 | 0.016 | 0.015 | 0.013 |
Acciones ordinarias | 0.036 | 0.036 | 0.035 | 0.035 | 0.035 |
Capital pagado adicional | 852.967 | 851.063 | 836.674 | 802.496 | 742.07 |
Ganancias retenidas (déficit acumulado) | -126.799 | -123.594 | -114.37 | -104.775 | -96.442 |
Otros fondos propios, total | 8.714 | 7.359 | 9.007 | 9.455 | 6.256 |
Total pasivo y patrimonio neto | 1428.73 | 1426.45 | 1457.25 | 1437.81 | 1410.32 |
Total de acciones ordinarias en circulación | 35.7801 | 35.714 | 35.0504 | 34.704 | 34.5201 |
Total Preferred Shares Outstanding | 16.248 | 16.2119 | 16.1474 | 14.9488 | 12.486 |
- Anual
- Trimestral
2022 | 2021 | 2020 | 2019 | 2018 | |
---|---|---|---|---|---|
Ingresos netos/Línea de salida | 4.716 | 3.514 | 4.955 | 1.762 | 2.766 |
Efectivo de actividades de explotación | 43.788 | 32.377 | 25.002 | 21.37 | 10.408 |
Efectivo de actividades de explotación | 35.366 | 27.183 | 16.655 | 12.79 | 9.375 |
Partidas no monetarias | 5.463 | 3.256 | 2.672 | 0.635 | -5.195 |
Cash Taxes Paid | |||||
Intereses pagados en efectivo | 25.259 | 26.395 | 22.501 | 15.974 | 12.335 |
Cambios en el capital circulante | -1.757 | -1.576 | 0.72 | 6.183 | 3.462 |
Efectivo de actividades de inversión | -85.484 | -295.001 | -272.901 | -262.65 | -93.809 |
Gastos de capital | -82.181 | -292.947 | -272.458 | -262.297 | -94.041 |
Otras partidas de flujo de caja de inversión, total | -3.303 | -2.054 | -0.443 | -0.353 | 0.232 |
Efectivo procedente de actividades de financiación | 86.129 | 270.114 | 243.429 | 240.238 | 95.193 |
Elementos de flujo de caja de financiación | -22.396 | -9.469 | -7.86 | -10.496 | -5.81 |
Total Cash Dividends Paid | -36.961 | -29.17 | -21.015 | -14.106 | -8.653 |
Emisión (retiro) de acciones, neto | 187.205 | 264.77 | 129.664 | 118.017 | 74.417 |
Emisión (amortización) de deuda, neta | -41.719 | 43.983 | 142.64 | 146.823 | 35.239 |
Variación neta de la tesorería | 44.433 | 7.49 | -4.47 | -1.042 | 11.792 |
Mar 2023 | Dec 2022 | Sep 2022 | Jun 2022 | Mar 2022 | |
---|---|---|---|---|---|
Net income/Starting Line | 1.75 | 4.716 | 3.606 | 1.8 | 1.187 |
Cash From Operating Activities | 4.714 | 43.788 | 23.073 | 19.355 | 7.553 |
Cash From Operating Activities | 9.119 | 35.366 | 25.883 | 16.738 | 8.346 |
Non-Cash Items | 1.808 | 5.463 | 3.677 | 1.828 | 1.25 |
Changes in Working Capital | -7.963 | -1.757 | -10.093 | -1.011 | -3.23 |
Cash From Investing Activities | -3.016 | -85.484 | -78.627 | -35.147 | -3.572 |
Capital Expenditures | -2.871 | -82.181 | -75.174 | -34.438 | -3.518 |
Other Investing Cash Flow Items, Total | -0.145 | -3.303 | -3.453 | -0.709 | -0.054 |
Cash From Financing Activities | -24.111 | 86.129 | 75.852 | 47.528 | 28.692 |
Financing Cash Flow Items | -0.361 | -22.396 | -19.841 | -14.631 | -4.021 |
Total Cash Dividends Paid | -10.645 | -36.961 | -26.685 | -17.093 | -8.263 |
Issuance (Retirement) of Stock, Net | 14.465 | 187.205 | 150.706 | 85.245 | 48.764 |
Issuance (Retirement) of Debt, Net | -27.57 | -41.719 | -28.328 | -5.993 | -7.788 |
Net Change in Cash | -22.413 | 44.433 | 20.298 | 31.736 | 32.673 |
Nombre del Inversor | Tipo de inversor | Porcentaje pendiente | Acciones en propiedad | Cambio de acciones | Fechas de holding | Índice de rotación |
---|---|---|---|---|---|---|
The Vanguard Group, Inc. | Investment Advisor/Hedge Fund | 9.6231 | 3448776 | -48376 | 2023-06-30 | LOW |
Gladstone (David John) | Individual Investor | 7.0148 | 2513985 | 0 | 2023-03-17 | LOW |
BlackRock Institutional Trust Company, N.A. | Investment Advisor | 6.4155 | 2299209 | 204085 | 2023-06-30 | LOW |
Amundi Asset Management, SAS | Investment Advisor/Hedge Fund | 2.6134 | 936606 | 300967 | 2023-06-30 | LOW |
Geode Capital Management, L.L.C. | Investment Advisor/Hedge Fund | 2.1185 | 759237 | 41546 | 2023-06-30 | LOW |
State Street Global Advisors (US) | Investment Advisor/Hedge Fund | 2.0904 | 749154 | 34059 | 2023-06-30 | LOW |
Bowen, Hanes & Company, Inc. | Investment Advisor | 1.8678 | 669400 | 0 | 2023-06-30 | LOW |
KBI Global Investors Ltd. | Investment Advisor/Hedge Fund | 1.6843 | 603611 | 0 | 2023-08-31 | LOW |
Northern Trust Investments, Inc. | Investment Advisor/Hedge Fund | 1.1286 | 404462 | 46027 | 2023-06-30 | LOW |
Two Sigma Investments, LP | Hedge Fund | 1.0668 | 382340 | -109337 | 2023-06-30 | HIGH |
New Jersey Division of Investment | Pension Fund | 0.8789 | 315000 | 5000 | 2023-06-30 | LOW |
Charles Schwab Investment Management, Inc. | Investment Advisor | 0.7104 | 254593 | 9718 | 2023-06-30 | LOW |
Janney Montgomery Scott LLC | Research Firm | 0.7024 | 251735 | 4539 | 2023-06-30 | LOW |
B&I Capital AG | Investment Advisor | 0.6781 | 243037 | 46300 | 2023-06-30 | LOW |
LPL Financial LLC | Investment Advisor | 0.5692 | 203975 | 161228 | 2023-06-30 | LOW |
Credit Suisse Funds AG | Investment Advisor/Hedge Fund | 0.5684 | 203693 | 10435 | 2023-06-30 | LOW |
Amundi Ireland Limited | Investment Advisor/Hedge Fund | 0.5266 | 188727 | 60822 | 2023-06-30 | MED |
PFG Investments, LLC | Investment Advisor | 0.5098 | 182697 | 13776 | 2023-06-30 | LOW |
Schwarz Dygos Wheeler Investment Advisors LLC | Investment Advisor | 0.4695 | 168249 | 6758 | 2023-06-30 | LOW |
Bard Associates Inc. | Investment Advisor | 0.4505 | 161457 | -980 | 2023-06-30 | LOW |
Calculadora de trading
Calcula tus P&L hipotéticas en el supuesto de haber abierto una operación con CFD en una fecha determinada (selecciona una fecha) y haberla cerrado en otra fecha (selecciona una fecha).
- 1:1
- 20
- 100
- 500
- 1000
- 10000
Gladstone Land Company profile
Sobre Gladstone Land Corp
Gladstone Land Corp es un fondo de inversión inmobiliaria agrícola (REIT). La empresa se dedica a la propiedad y el arrendamiento de terrenos agrícolas. Es propietaria de unas 158 explotaciones agrícolas, con una extensión aproximada de 107.000 acres en 14 estados, entre ellos California, Florida, Arizona, Colorado, Nebraska, Michigan, Oregón, Washington, Texas, Carolina del Norte, Maryland y Delaware. Las explotaciones de la empresa están situadas en regiones en las que sus arrendatarios pueden cultivar productos frescos en hileras anuales, como bayas y verduras, que generalmente se plantan y cosechan anualmente. También posee fincas con cultivos permanentes, como almendras, manzanas, higos, aceitunas, pistachos y otros huertos, así como arboledas de arándanos y viñedos. También puede adquirir propiedades relacionadas con la agricultura, como instalaciones de refrigeración, edificios de procesamiento, instalaciones de embalaje y centros de distribución.
El precio actual de la acción Gladstone Land en tiempo real es 14.46 USD. El gráfico de la acción permite a los inversores comprender mejor el rendimiento y el precio de la acción y tomar decisiones informadas al negociar acciones y CFD.
Descubra más acciones con gráficos, datos vitales y actualizaciones de precios en tiempo real: Amgen, Zhuzhou CRRC Times Electric Co. Ltd., James Fisher and Sons PLC, Glencore PLC, Mosaic y Manhattan Associates. Para obtener más información, consulte los perfiles de las empresas en Capital.com.
Industry: | Specialized REITs (NEC) |
Suite 200
1521 Westbranch Drive
MCLEAN
VIRGINIA 22102
US
Cuenta de resultados
- Annual
- Quarterly
A la gente también le interesa
¿Aún estás buscando un bróker de confianza?
Únete a más de 570.000 traders de todo el mundo que eligen operar con Capital.com