Head and shoulders chart pattern
The head and shoulders pattern is a technical analysis chart formation. Learn more about it in our educational guide.
What is the head and shoulders chart pattern?
The head and shoulders chart pattern is a technical analysis chart formation used to identify potential reversals in the trend of a stock.
It is considered one of the most reliable chart patterns and is identified by three peaks. The middle peak, known as the head, is the highest of the three and is flanked by two lower peaks, known as the shoulders.
 *Past performance is not a reliable indicator of future results
The pattern was first described by Charles Dow in the 1900s, although it was not named until the 1930s.
Highlights
-
The head and shoulders chart pattern is used in technical analysis, often identifying the turning point of a trend.
-
It is identified by three peaks; the middle peak, or head, is the highest and is flanked by two lower peaks, the shoulders.
-
The pattern’s appearance is often an indication that the current trend of a stock is about to reverse direction.
Anatomy of the head and shoulders pattern
The head and shoulders pattern is used to gauge when the current trend of an asset could be about to reverse direction. The pattern can also be used to forecast a potential price target and is often used in combination with other technical indicators to confirm a reversal.
The creation of the pattern on the chart starts from the left shoulder. The price action then forms the head, which is higher or lower (depending on the type of the pattern) than the left shoulder.
The right shoulder is created afterwards; typically, it is approximately at the same level as the left shoulder. The neckline is applied at the end of the formation; it may be horizontal, descending or ascending.
 *Past performance is not a reliable indicator of future results
It is important not to confuse the reverse head and shoulders pattern with the continuation pattern. The former is usually at least as large as the typical price wave in the trend that precedes it. If the head and shoulders pattern looks very small compared to the price waves around it, it may indicate the continuation pattern.
Identifying the head and shoulders trading pattern
Head and shoulders top
 *Past performance is not a reliable indicator of future results
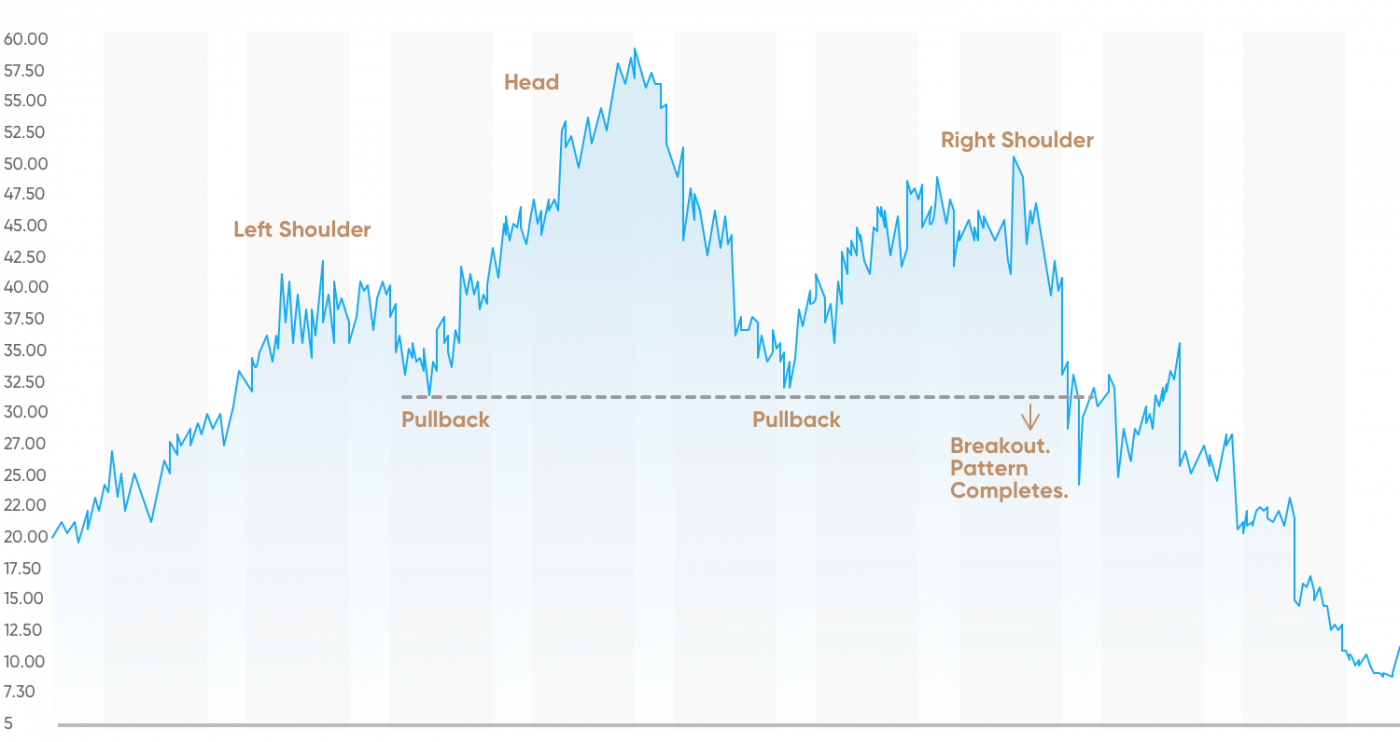
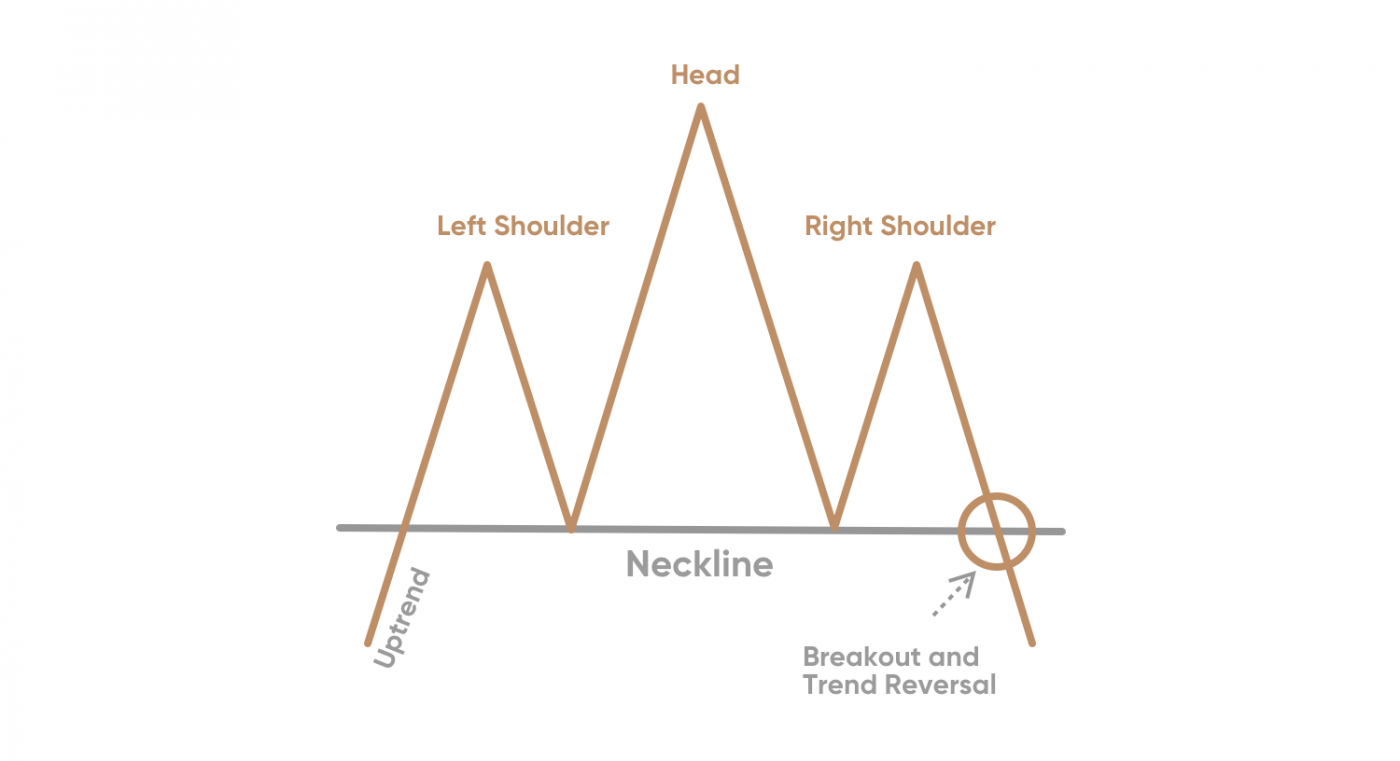
The regular head and shoulders pattern forms at the top of the uptrend and is referred to as the head and shoulders top. Considered to be a bearish chart pattern.
The left shoulder forms at the end of a significant bullish period in the market. After its apex is formed, the price of the underlying asset tends to slide down to a certain extent as a subsequent reaction.
The head is then formed when the price increases again, creating the highest vertex of the pattern. It is then followed by another price decline.
The right shoulder forms when the price moves up again, however, remaining below the head. It then falls down nearly equal to the first valley between the left shoulder and the head or at least below the apex of the left shoulder.
At last, the neckline is drawn across the bottom of the head and both shoulders serving as a support line. When the price breaks through the neckline, after forming the right shoulder, and keeps continuously falling, indicating the completion of the head and shoulders top formation.
Head and shoulders low
 *Past performance is not a reliable indicator of future results
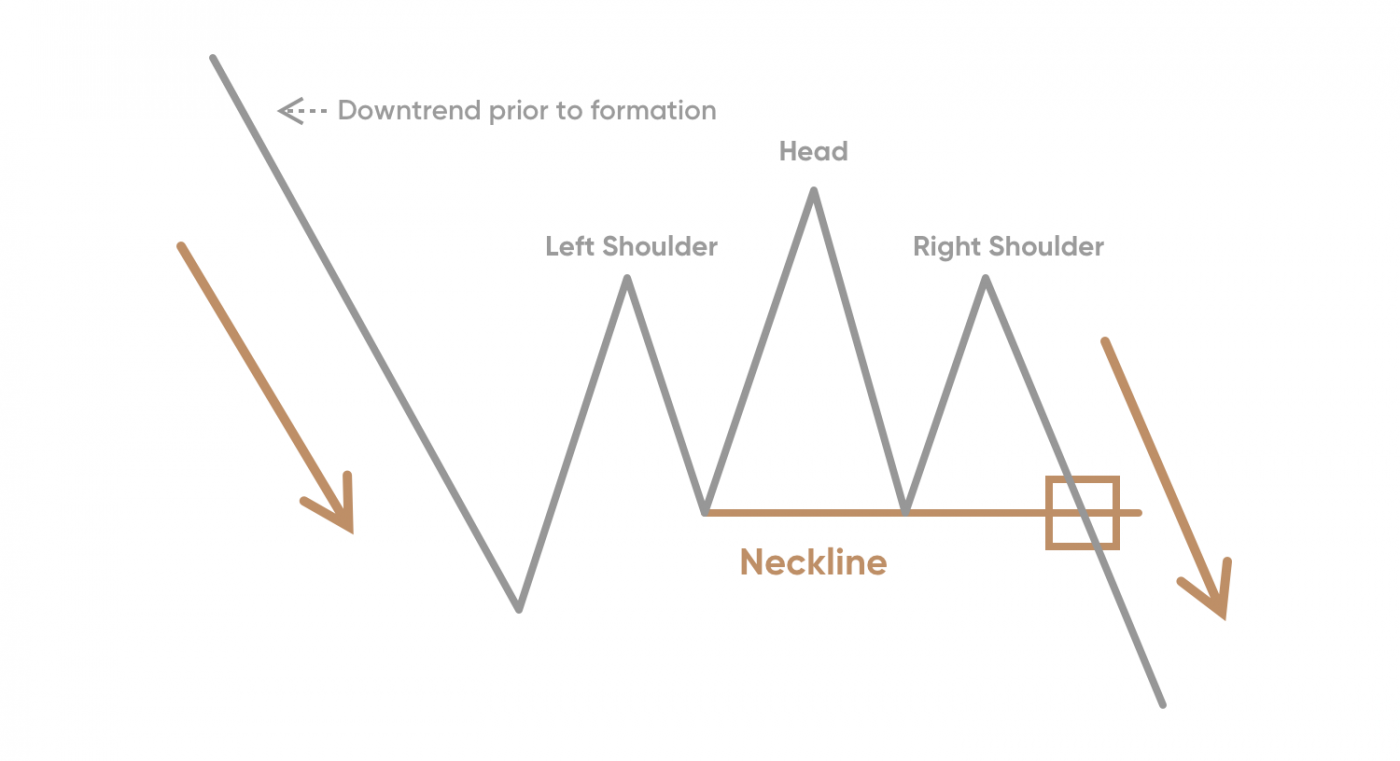
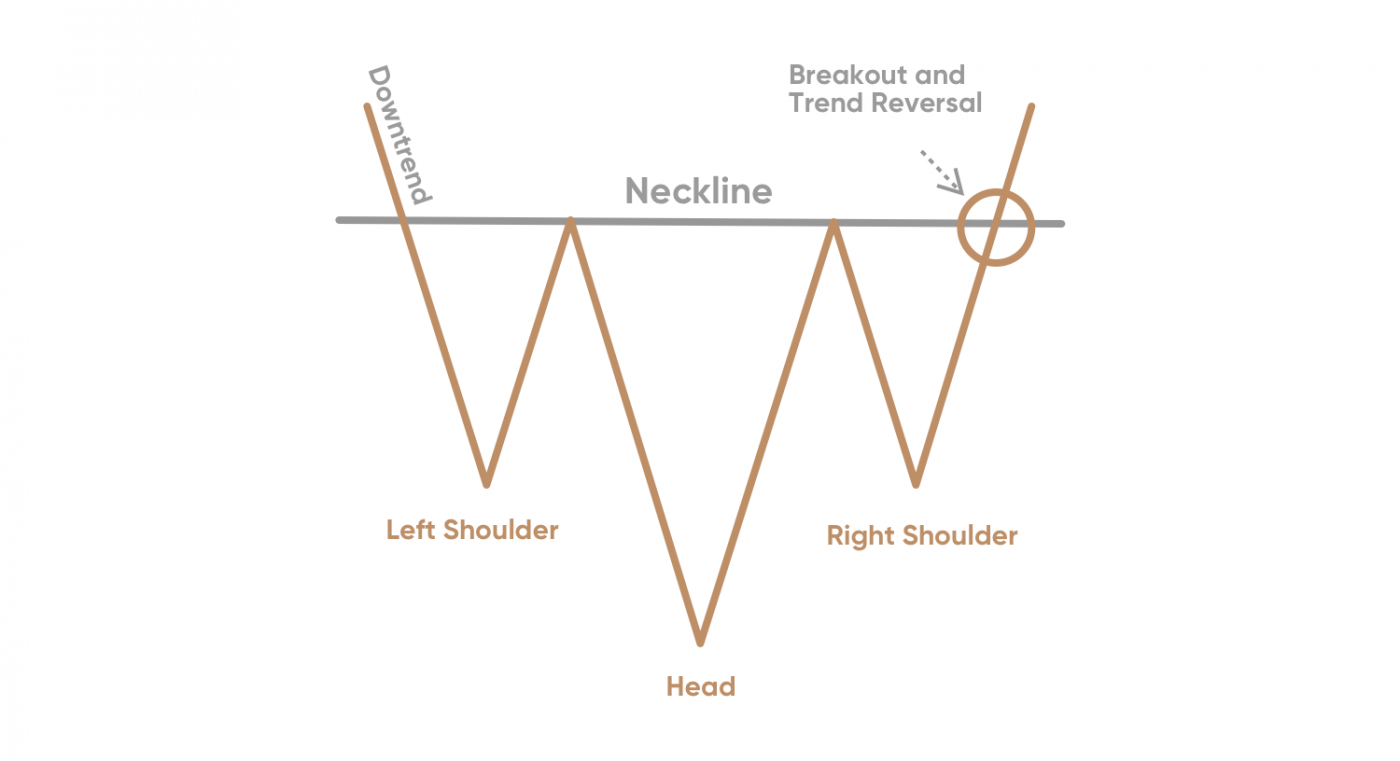
The head and shoulders pattern can also form in the opposite direction. This is known as the head and shoulders bottom or the inverse head and shoulders.
The bullish version of the pattern establishes at the bottom of the downtrend and implies that the existing bearish tendency is likely to be reversed, and the price could head higher.
After the peak of the left shoulder is formed, the price goes up completing the first formation. It then falls to a new low followed by a recovery move upwards creating the head.
A corrective reaction downwards occurs to start the formation of the right shoulder, and then the price makes a sharp move up once again. The neckline is then applied, serving as a resistance line.
Once the second shoulder is formed, the price will make a final rally, breaking through the neckline and indicating the completion of the head and shoulders bottom formation and the reversal of the bearish trend.
Another difference between the top and bottom patterns is that the Top formation is typically completed within a few weeks, whereas the Bottom formation may prolong up to several months or even a year.
Trading the head and shoulders pattern
There are a number of strategies traders could consider using when trading with a head and shoulders pattern.
-
Support and resistance levels. The head and shoulders pattern is a trend reversal pattern and the head and shoulders levels can act as support and resistance levels when the price approaches them. Traders could use these levels to enter or exit trades.
-
Moving averages (MA). When the price approaches a MA, traders could look to enter a long or short trade.
-
Stop-losses* and guaranteed stop-losses. Stop-losses may be utilised effectively in any type of trading, and this is especially true for head and shoulders patterns. Stop-losses could be placed just below the neckline level for a long trade and just above the neckline level for a short trade. Guaranteed stop-losses could be used the same way, but require a fee and have no risk of slippage.
-
Trailing stops. Trailing stops are another valuable tool that traders could consider using when trading head and shoulders patterns. A trailing stop will move with the price and protect profits as the price continues to move.
*Stop-losses are not guaranteed, but we offer guaranteed stop-losses (GSLs) for a fee. You can check the GSL fee value in a deal ticket when opening a position and adding a GSL.
Head and shoulders pattern analysis
When dealing with the head and shoulders top pattern, measuring the vertical distance from the top of the head down to the neckline may help determine an estimated spread amount.
For instance, if the distance represents $10, then once the neckline is broken, technical analysts would predict the price to decline at least another $10 below the neckline price level.
Conversely, when dealing with an inverse pattern, the opposite is true: measuring the vertical distance from the neckline down to the peak of the head gives you a rough idea of how far the price is likely to go upward past the neckline.
Additionally, the head and shoulders pattern is a useful technical analysis tool for measuring and evaluating the minimum probable extent of the subsequent move of the price from the neckline. It also allows indicating a reversal in a trend where the market makes a shift from bullish to bearish or vice-versa. This pattern is considered to be one of the more reliable patterns that predict a trend reversal.
Common mistakes
As with many things when it comes to trading, there are pitfalls traders may want to watch out for. These may include:
-
Not waiting for confirmation
One of the most common mistakes made in a head and shoulders trading strategy is not waiting for confirmation. The pattern is not complete until the price breaks through the neckline. -
Not identifying the neckline
The line connecting the two troughs that form the shoulders should be sloping and the line connecting the highs of the two peaks should be horizontal. If the neckline is not properly identified, the pattern may not be valid. -
Not considering other factors
The pattern should be observed in the context of overall market conditions and current trends. Additionally, traders should consider paying attention to volume and other indicators that can provide additional confirmation. -
Not determining the target price
The target price is usually determined by measuring the distance between the neckline and the highest peak of the head and subtracting this amount from the breakout point. Knowing the target price could help traders manage their risk and plan their trades accordingly. -
Not implementing risk management
Lastly, traders should always employ risk management when trading the head and shoulders chart pattern. As with any other trading strategy, it is important to set stop-loss* orders and limit potential losses. Additionally, traders should not risk more than they can afford to lose.
*Stop-losses are not guaranteed, but we offer guaranteed stop-losses (GSLs) for a fee. You can check the GSL fee value in a deal ticket when opening a position and adding a GSL.
Conclusion
The head and shoulders chart pattern can be explained as a technical analysis chart pattern that is used to indicate potential reversals in a market. It can potentially be a useful tool for traders, as it could be used to identify potential reversals in the market.
Identifying the pattern could help traders form a head and shoulders trading strategy allowing them to make more informed decisions.
However, as with any trading strategy, it should be noted that the head and shoulders pattern is not entirely foolproof. Traders should do their own reseach and exercise caution. They should also remember to never invest or trade with more money than they can afford to lose.
FAQs
Is a head and shoulders pattern bullish or bearish?
A head and shoulders pattern is generally considered to be bearish.
What does a head and shoulders pattern indicate?
A head and shoulders chart pattern usually indicates a reversal in the current trend, with prices falling after reaching a peak (the head) and then rising again before falling back to a level below the initial peak (the shoulders).
What happens after a head and shoulders pattern?
After a head and shoulders chart pattern, the price typically breaks down and continues to fall. This is because the pattern indicates a shift in investor sentiment from bullish to bearish. As traders and investors become more pessimistic, they will start selling the stock and the price will drop.
How accurate is the head and shoulders pattern?
The head and shoulders trading pattern is generally considered to be a reliable technical indicator of a potential trend reversal, but its accuracy will depend on the individual market and the circumstances. As with any trading strategy, it is important to use the pattern in conjunction with other indicators to ensure a higher level of accuracy.