Tech Selloff Leads Risk-Off Session Across Markets
It was a risk-off day for stocks, with the S&P 500 falling by around 1.2%. The damage was greater on the Nasdaq 100, where the index dropped by more than 2%.
This decline was led by a sharp fall in technology stocks, with the SPDR Technology Sector ETF (XLK) down by more than 2.6% on the day. Most of the weakness was concentrated in AI-related names, with the Semiconductor ETF (SMH) falling by 3.6%.

Semiconductors Hit Hard
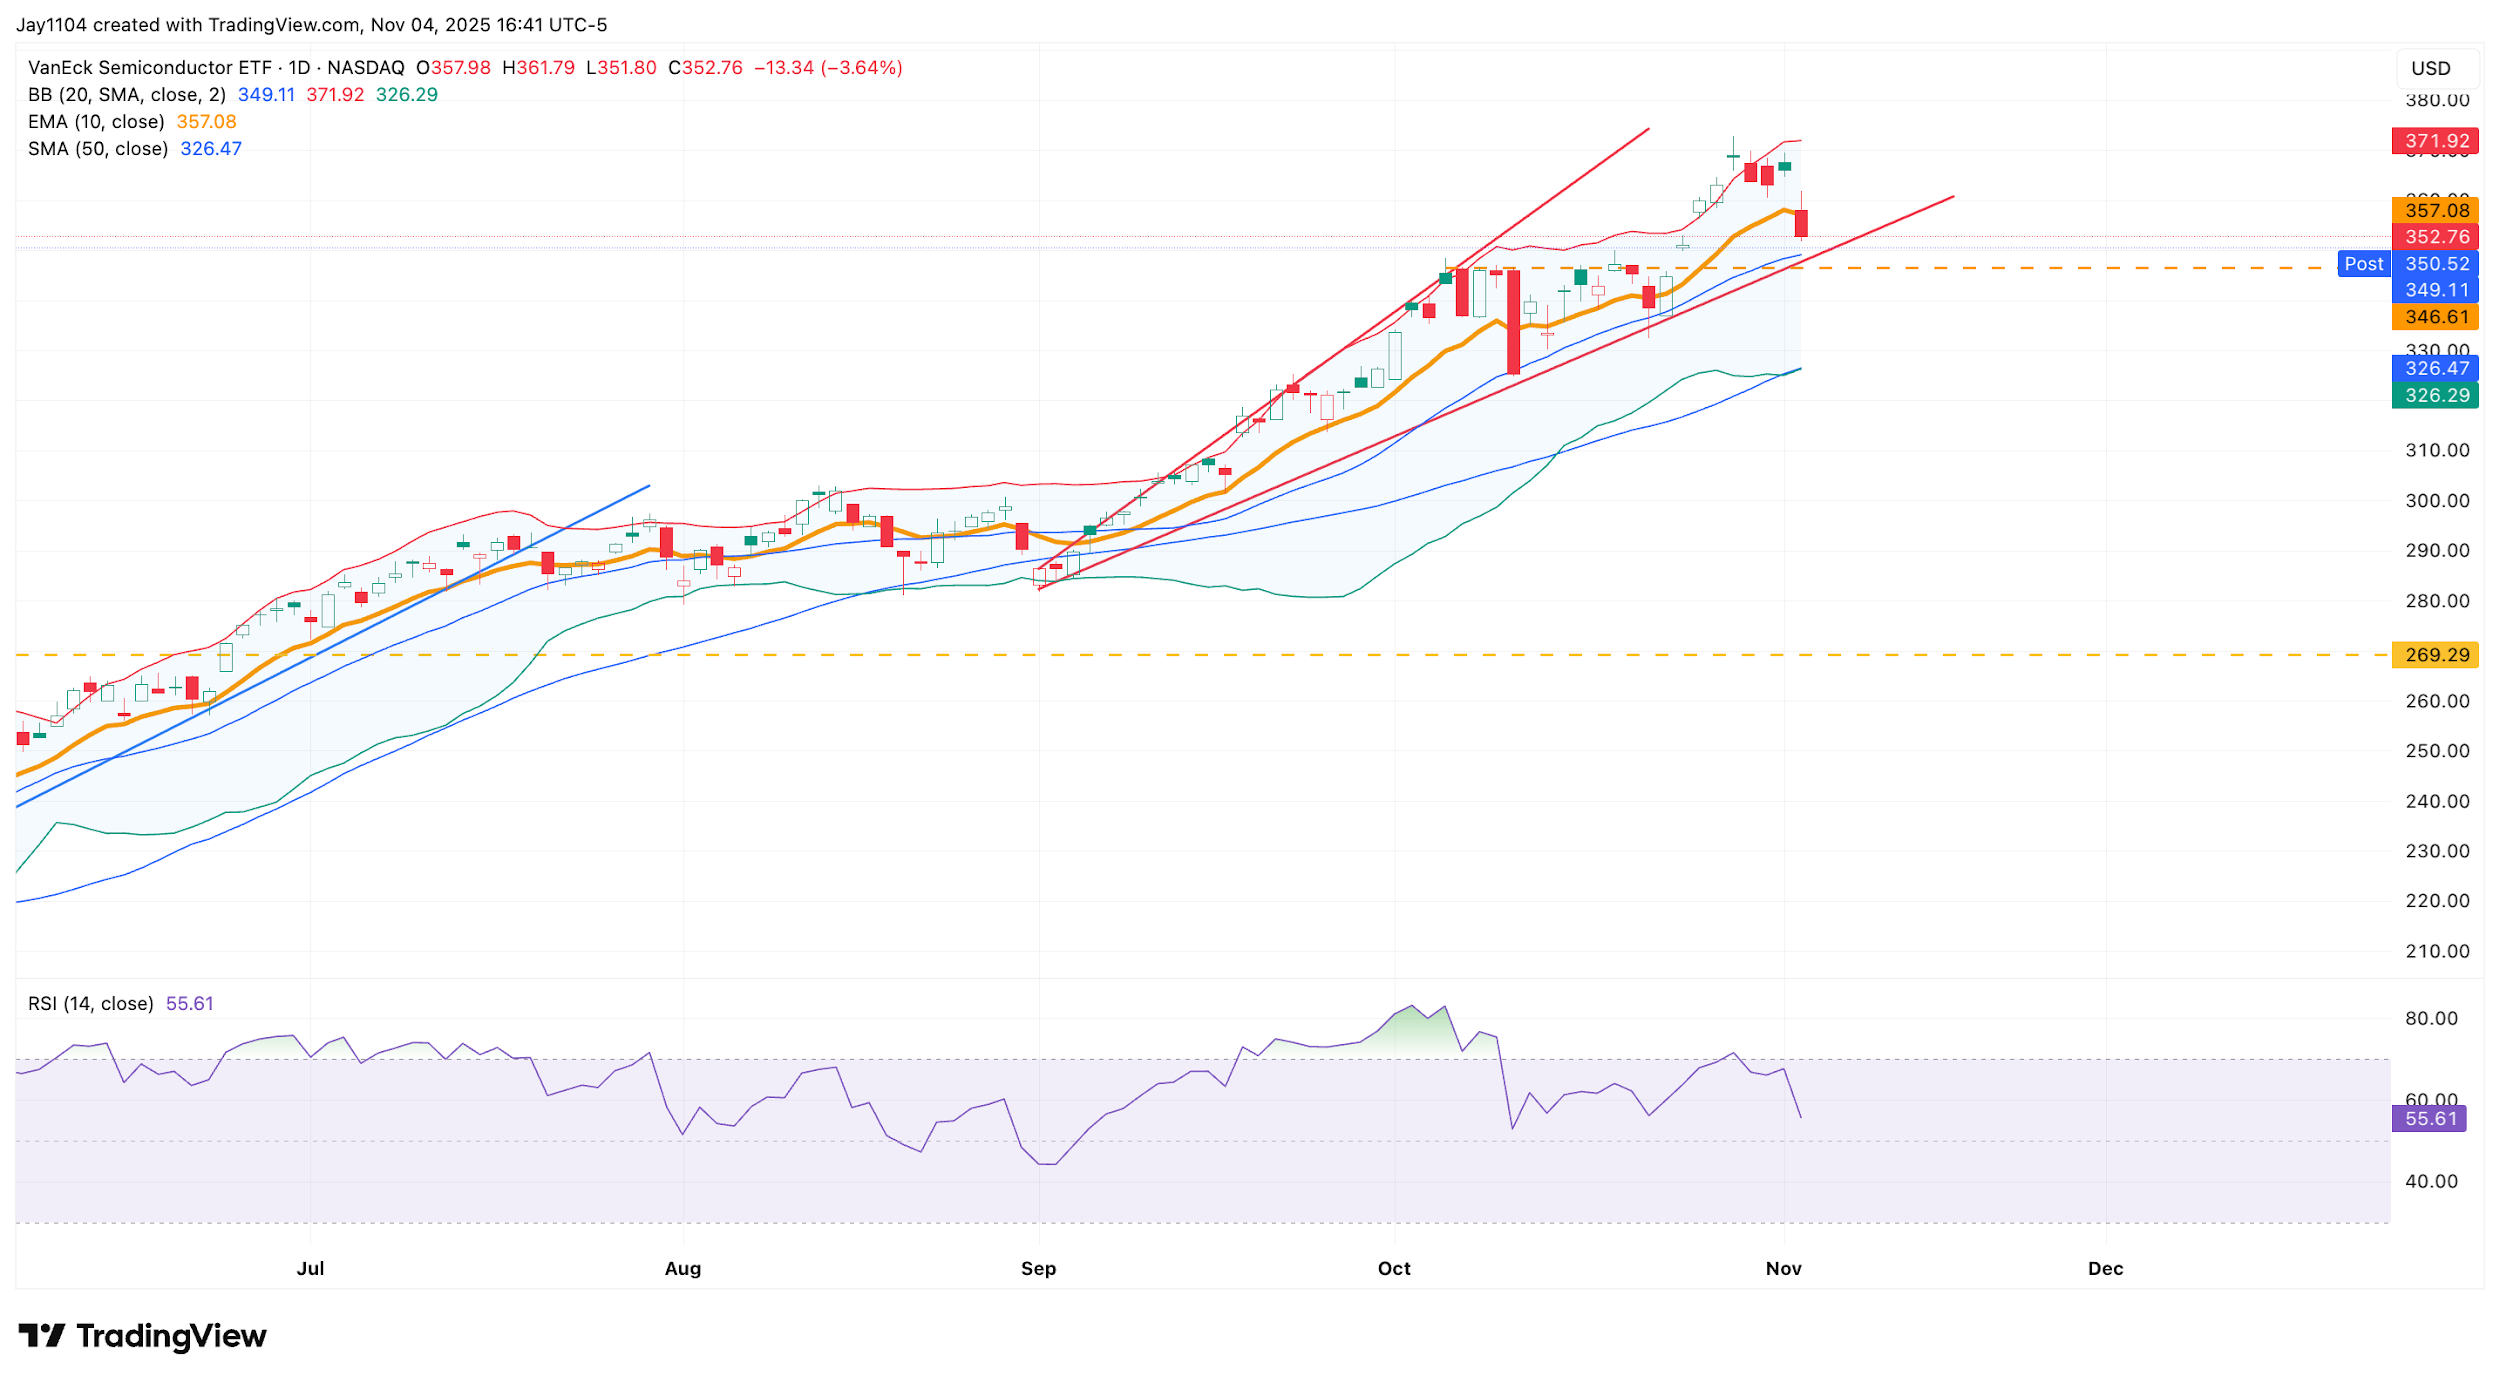
The SMH ETF has been trending upwards within what seems to be an ascending broadening megaphone pattern. Recently, the ETF became extremely overbought, trading a full bar outside its upper Bollinger Band while the RSI rose above 71. After today’s decline, the SMH has moved back within the Bollinger Bands, with the RSI easing to around 55, reducing those overbought conditions.
More importantly, the ETF also fell below its 10-day exponential moving average — a level it has not remained under for long in recent months. If the ETF continues to decline on 5 November, it could suggest that downward momentum in the semiconductor sector is building. However, should the ETF recover or stabilize, it may indicate investor sentiment remains mixed or that a potential reversal could be in play. A break below the uptrend at $347 could potentially indicate that both the uptrend and the megaphone pattern have failed, which could move towards $325, which aligns with the lower Bollinger Band and a key area of support.
(Source: TradingView)
(Past performance is not a reliable indicator of future results)
S&P 500 Nears Support
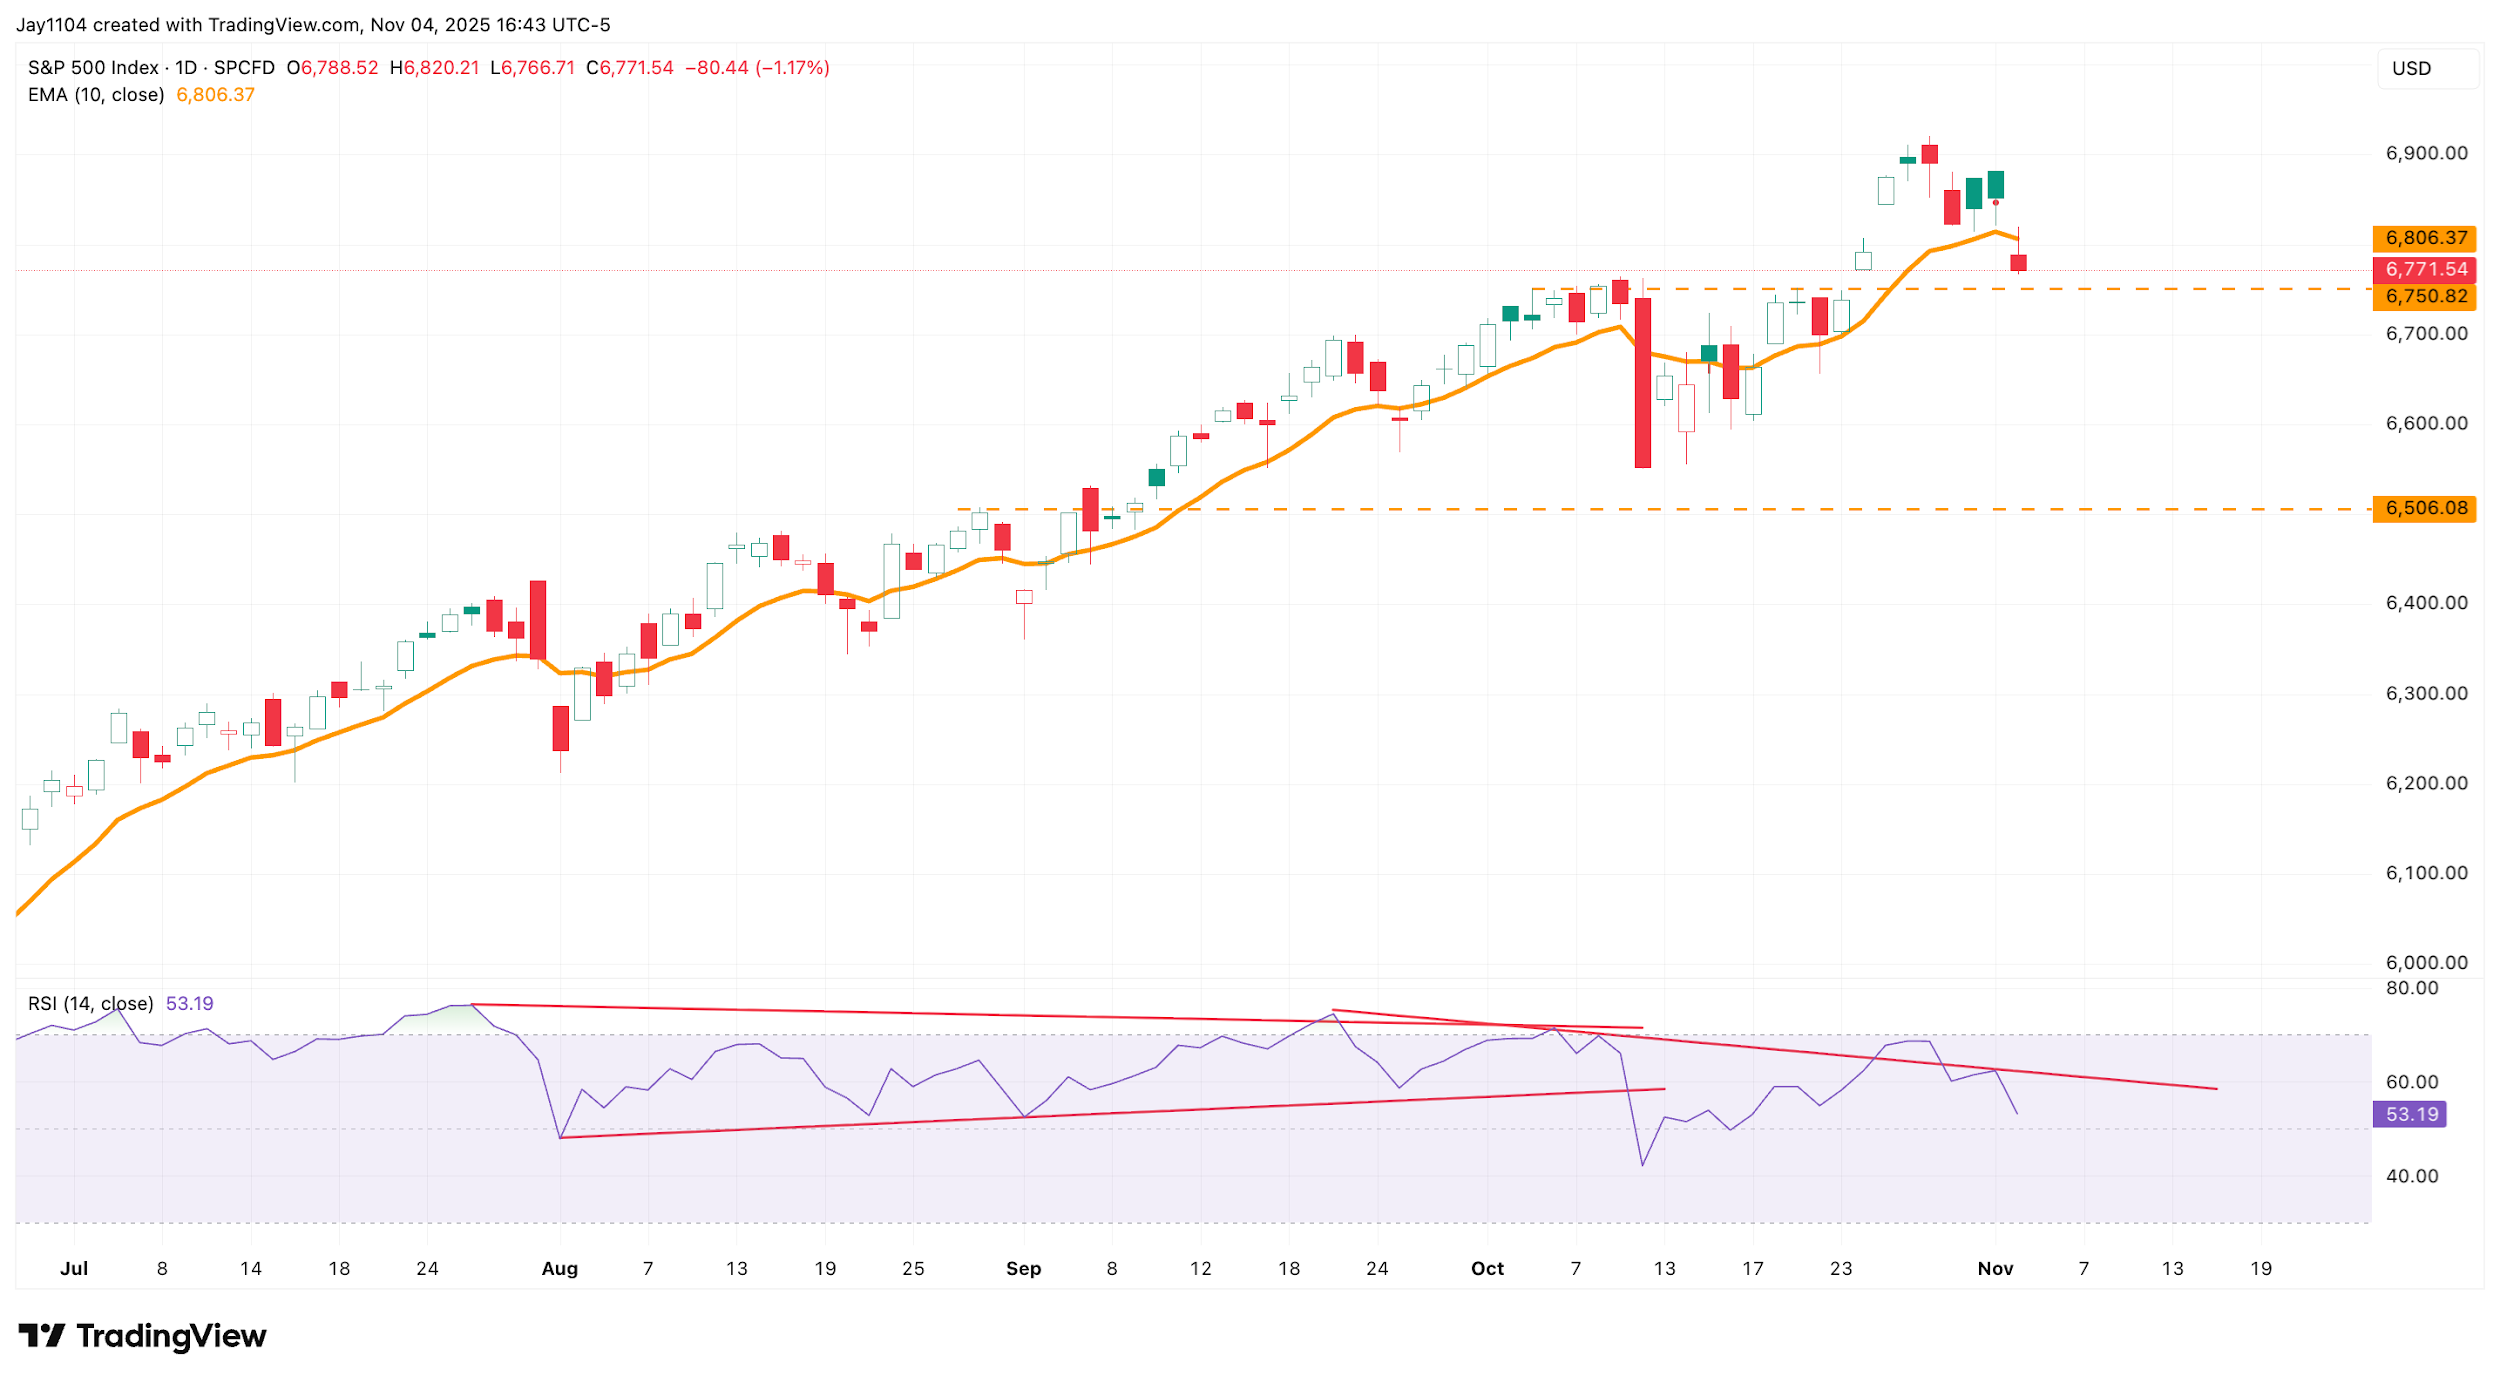
The S&P 500 also dipped below its 10-day exponential moving average — a level it has breached in past sessions. While some traders watch this indicator for potential short-term signals, historical occurrences do not imply future outcomes.
The last time was in mid-October, when the index briefly fell below the 10-day average before recovering. While it is currently trading beneath that level again, this does not necessarily indicate a trend reversal, as market conditions and outcomes can vary.
If the index continues to move further away from the 10-day exponential moving average, it would be a clear indication that a trend shift is occurring. Additionally, the index moved closer to the 6,750 level today, which remains a vital support level. A breach below 6,750 could likely lead to a decline towards 6,550 — the low established on 10 October.
(Source: TradingView)
(Past performance is not a reliable indicator of future results)
Gold Remains Weak
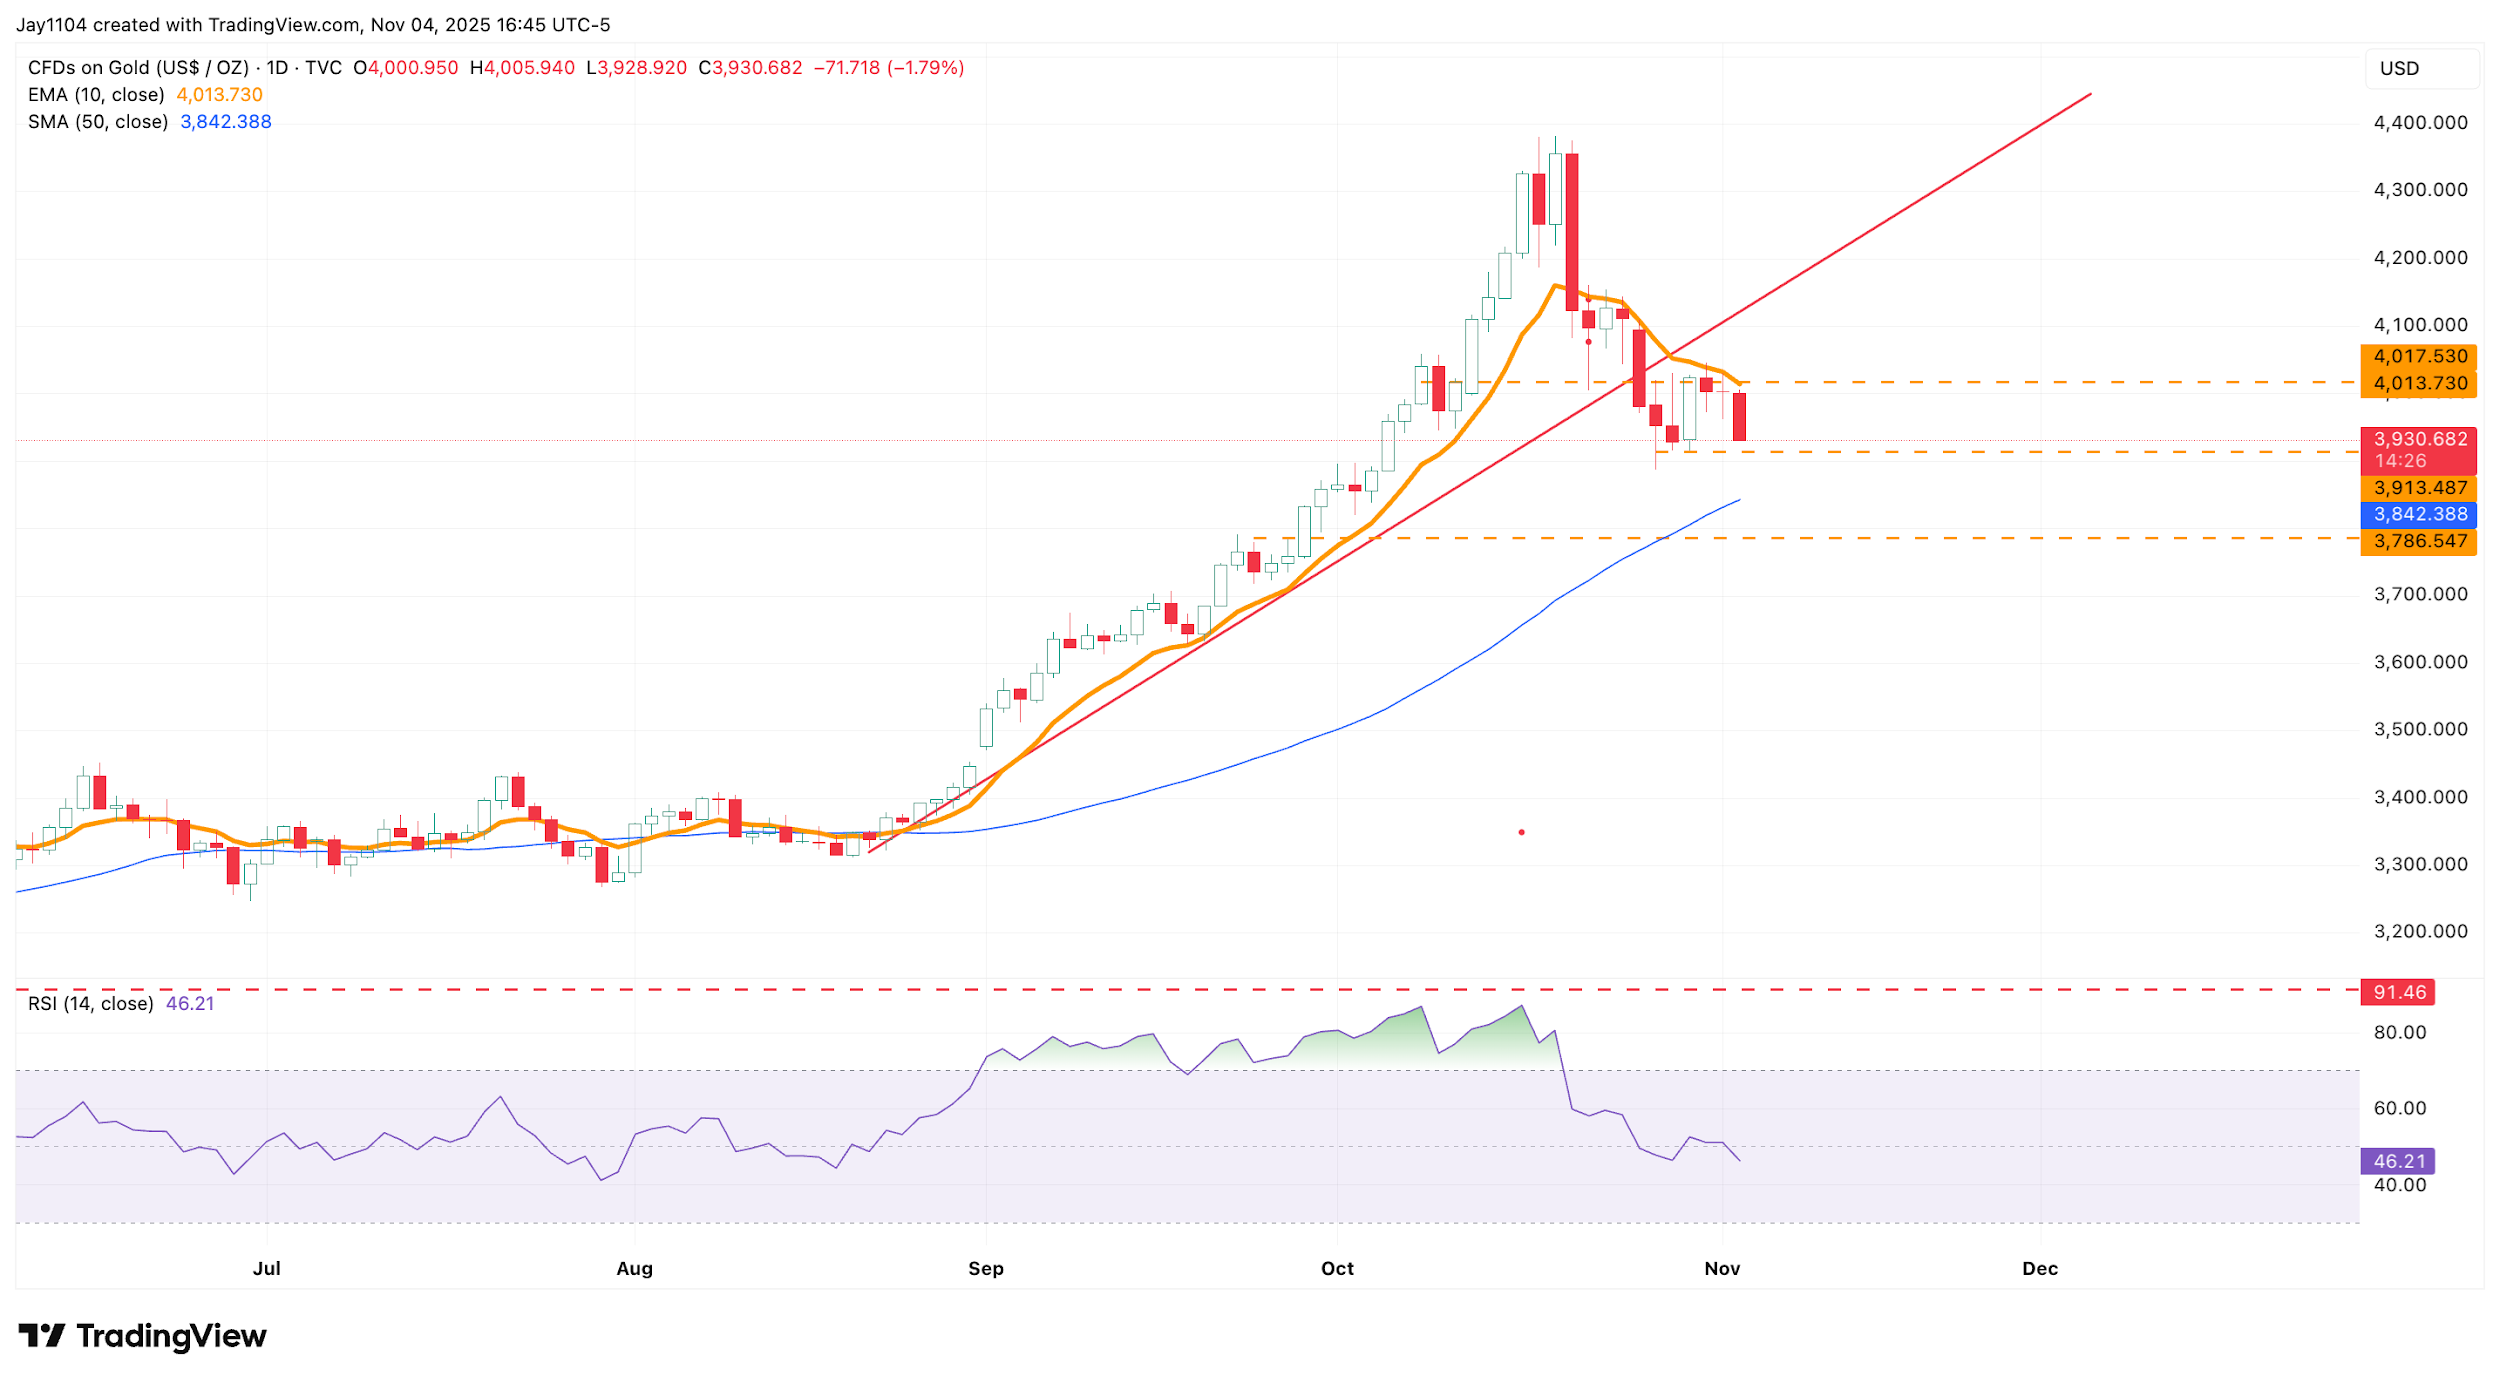
Gold fell by more than 1.7% on 4 November after failing to break through resistance around $4,020. The next level of support lies near $3,920, and a break below that could set up a decline towards the $3,790–$3,835 range, where both a support zone and the 50-day moving average are located.
At this stage, the trend in gold remains bearish, particularly as it has been unable to rise above resistance or reclaim its 10-day exponential moving average.
(Source: TradingView)
(Past performance is not a reliable indicator of future results)
Dollar Strengthens Further
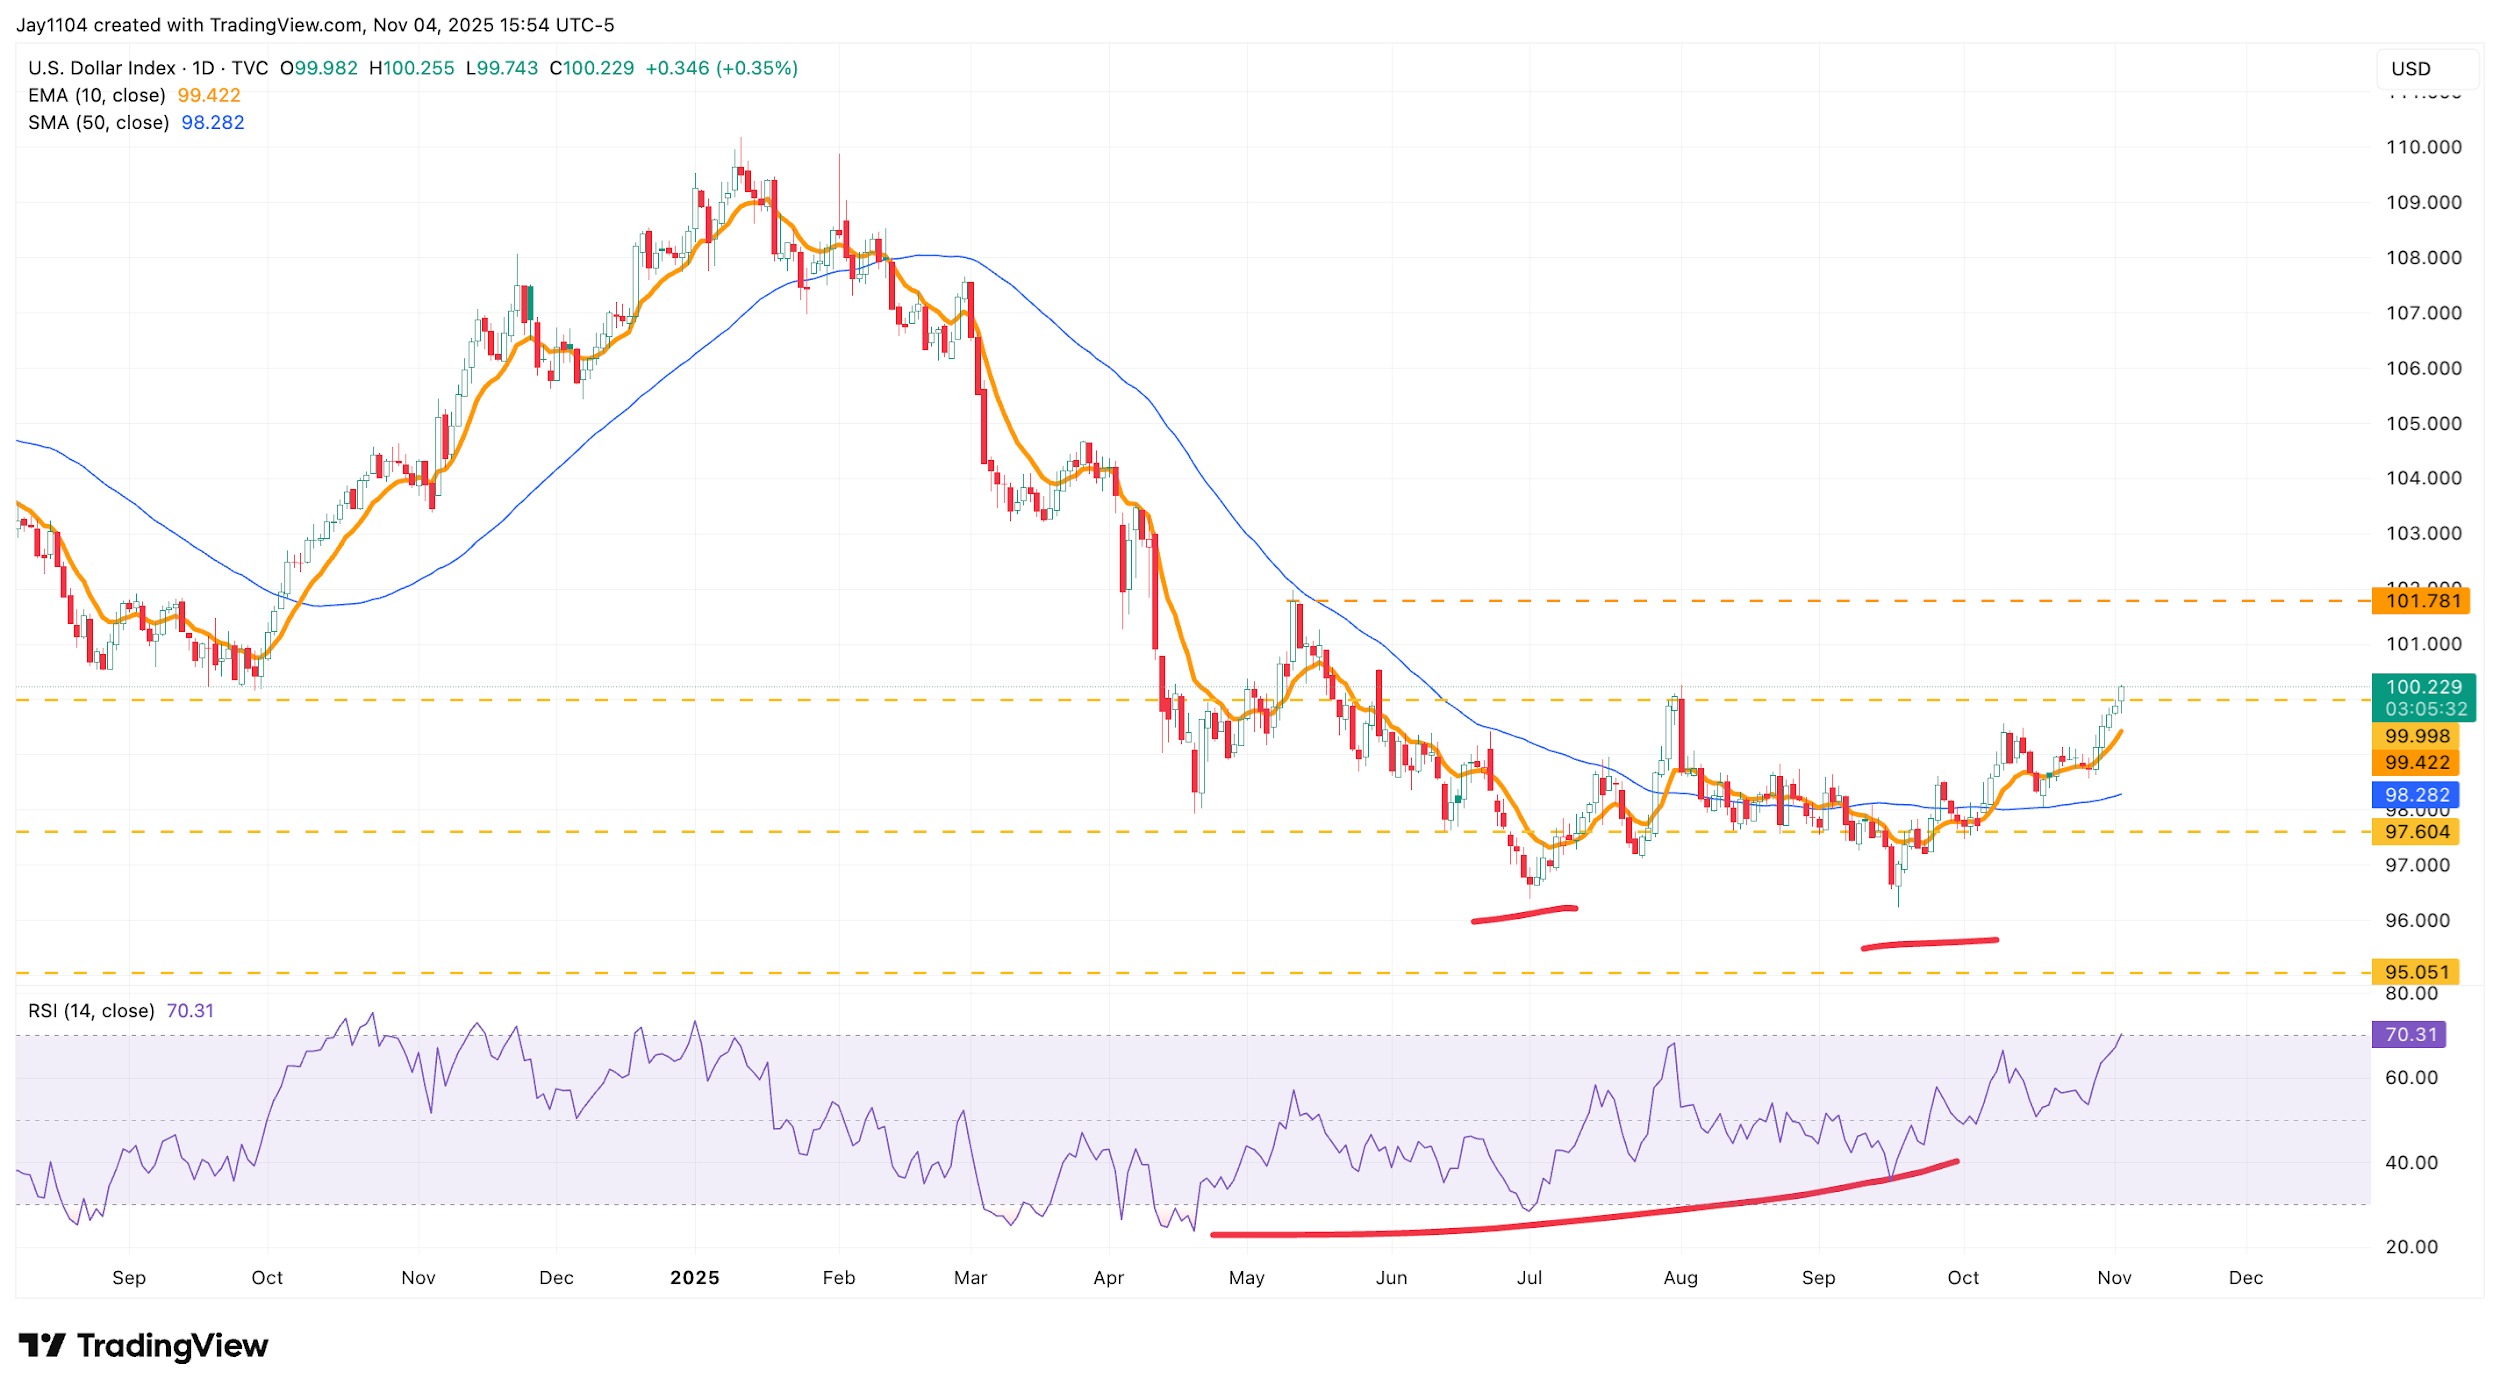
The dollar continued to strengthen today, with the Dollar Index climbing above 100 and breaking through the neckline of what had been a potential double-bottom pattern — now seemingly confirmed. This development suggests the index could continue to rise, potentially towards 101.80 or even higher, with that level marking the next major area of resistance.
Such a move could prove unfavourable for risk assets, particularly gold, and may indicate a broader shift in sentiment. It also raises the possibility that the dollar could exert further pressure on those hedging against it as we move towards the end of the year.
(Source: TradingView)
(Past performance is not a reliable indicator of future results)