Snap stock forecast: Will SNAP rebound above IPO price?
Explore the latest Snap stock forecasts from third-party analysts, including technical overview, SNAP CFD trader sentiment, and FAQ.
Snap (SNAP) was trading at $8.59 as of 11:09am (UTC) on 7 October 2025, within its intraday range of $8.23-$8.83, positioned near the midpoint of recent trading levels after gaining 18.33% over the past month. Capital.com client sentiment remains strongly weighted towards buyers, with 96.72% long positions and 3.28% short positions on the CFD trading platform.
Recent gains reflect the broader strength in the technology sector, as the Nasdaq reached record highs above 25,000 (Reuters, 7 October 2025). Snap has also benefited from strategic initiatives, including CEO Evan Spiegel’s focus on ‘startup squads’ and the success of Snapchat+, which now generates approximately $700 million in annual recurring revenue (Yahoo Finance, 9 September 2025).
The stock has recovered from early October weakness, when it traded as low as $7.71, supported by active options trading, with 530,000 contracts traded on 3 October and call options representing 77.89% of total volume (Futubull, 3 October 2025).
Snap stock forecast: Analyst price target view
TipRanks (consensus poll)
Aggregated data from TipRanks, covering 28 analysts, indicates a 12-month average price target of $9.30, with a high estimate of $16.00 and a low of $7.00. The consensus suggests a cautious outlook amid ongoing advertising revenue pressures and competitive headwinds (TipRanks, 8 October 2025).
Wells Fargo (sector coverage)
Wells Fargo reduced its target to $8 from $7, maintaining an Equal Weight rating on 7 October 2025 (MarketBeat, 8 October 2025).
Mizuho Securities (initiation)
Mizuho began coverage with a Neutral rating and a $9.00 target on 29 September 2025, citing a mixed outlook for social media firms amid broader macroeconomic uncertainty. The firm aligned with the general consensus that a clearer revenue recovery is required before sentiment improves (MarketBeat, 8 October 2025).
Goldman Sachs (house view)
Goldman Sachs increased its price target to $9.00 from $8.50 while maintaining a Neutral rating. The firm cited volatile month-to-month revenues in Q2 but acknowledged management’s 'modestly more constructive picture' for Q3. It also highlighted growth in Snapchat+ and Sponsored Snaps as key revenue contributors (Investing.com UK, 6 August 2025).
Evercore ISI (analyst update)
Evercore ISI raised its target to $12.00 from $11.00, maintaining an In Line rating despite 'surprisingly soft' quarterly results. The upward revision resulted from a roll-forward of its valuation model, with the firm noting potential in augmented reality (AR) monetisation and subscription revenue (Investing.com UK, 6 August 2025).
Forecasts and market projections are inherently uncertain and subject to change. They do not account for unexpected economic or geopolitical developments. Past performance is not a reliable indicator of future outcomes.
SNAP stock price: Technical overview
Snap (SNAP) was trading at $8.59 as of 11:09am (UTC) on 7 October 2025, holding above its key moving average cluster, with the 20-, 50-, 100- and 200-day SMAs positioned around $8, $8, $8 and $9 respectively. The 20-over-50 alignment remains in place, keeping the near-term structure moderately constructive, as the price continues to trade above the shorter-term moving average band.
Momentum indicators suggest a neutral bias, with the 14-day RSI at 59.49, sitting in the upper-neutral zone, while the ADX reading of 28.15 indicates that a defined trend is still present. The MACD level of 0.18 continues to show a mild bullish crossover, though other oscillators remain broadly neutral, signalling ongoing range-bound consolidation.
The first resistance area lies near the $9.03 pivot (R1); a daily close above this level could bring the $10.34 region into focus and open the way towards higher resistance levels. On the downside, initial support is seen at $7.96, followed by the 100-day SMA around $8.32 – a sustained move below this point could weaken short-term momentum and expose the $6.65 region as the next potential support (TradingView, 7 October 2025).
This analysis is provided for informational purposes only and does not constitute financial advice or a recommendation to buy or sell any instrument.
Snap share price history
Snap shares were trading around $9.59 on 9 October 2023 before drifting lower through early summer 2024, as slower digital advertising growth and rising competition across social media weighed on performance. The stock rebounded towards late 2024, reaching $12.24 on 4 February 2025, supported by steadier user engagement and stronger-than-expected revenue over several quarters.
A broad market pullback followed in spring 2025, sending Snap to a two-year low of $6.97 on 27 August 2025, as persistent macroeconomic uncertainty and softer investor risk appetite pressured technology shares. Since late August, the share price has recovered gradually, closing at $8.59 on 7 October 2025, suggesting potential early signs of stabilisation in sentiment ahead of the third-quarter results.
Past performance is not a reliable indicator of future results. Share prices are indicative and may differ from live market prices.
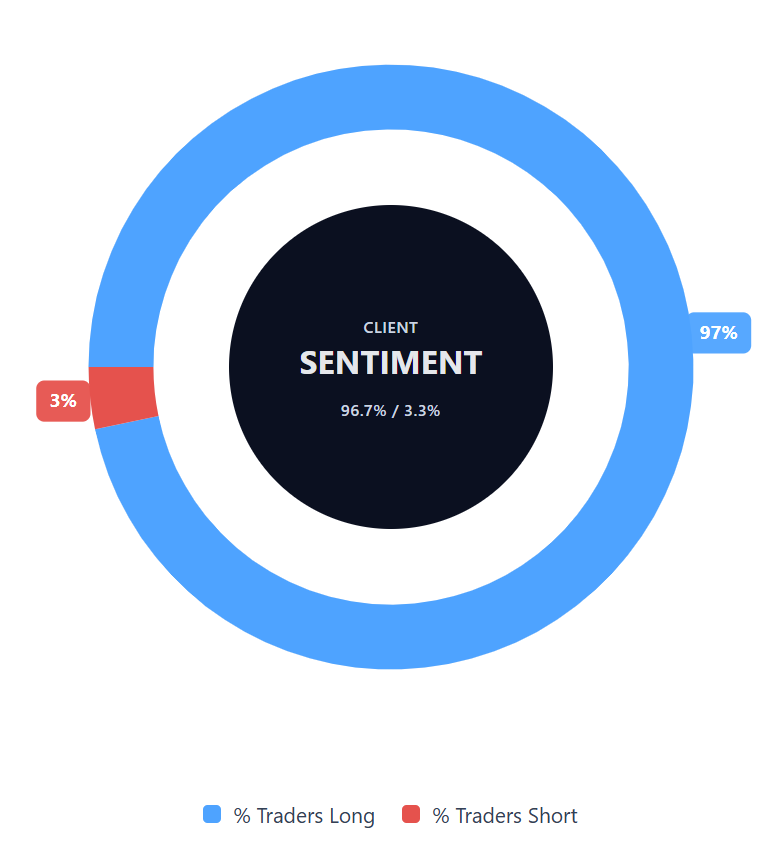
Capital.com’s client sentiment for Snap CFDs
Capital.com clients are currently positioned 96.7% long and 3.3% short, indicating that the majority of open Snap CFD positions remain on the buy side, with a 93.4 percentage point difference between buyers and sellers (7 October 2025).
This data represents a snapshot of open positions on the Capital.com platform and may change over time.
FAQ
Is Snap a good stock to buy?
Capital.com does not provide investment advice. Whether a stock is suitable for an individual depends on their financial goals, trading experience and risk tolerance. Traders may choose to explore Snap CFDs to gain exposure to price movements without owning the underlying asset, while understanding the risks involved. Contracts for difference (CFDs) are traded on margin, and leverage can amplify both profits and losses.
Could Snap stock go up or down?
Snap’s share price can fluctuate with advertising demand, competitive pressures, and wider market sentiment. Like many technology stocks, it remains sensitive to economic data releases and investor sentiment. Prices may move in either direction and are not guaranteed to reflect analyst expectations.
Should I invest in Snap stock?
Capital.com does not make investment recommendations. Traders are encouraged to carry out independent research and consider using a demo account to understand market dynamics before trading with real funds. Contracts for difference (CFDs) are complex instruments and carry a high risk of loss due to leverage.
What factors affect Snap’s stock price?
Snap’s share price is shaped by advertising revenue, user engagement, competition across social-media platforms and product innovation, particularly in augmented reality (AR) and subscription models. Broader macroeconomic influences, such as interest rates and consumer spending, also have an effect.
Where can I follow live Snap price movements?
Traders can monitor Snap’s live price chart, client sentiment, and technical indicators directly on the Capital.com platform, along with market news and educational materials designed to support informed trading decisions.