Post OPEX Drift and Holiday Shortened Trading Week Set The Stage for Greater Volatility
It will be a holiday-shortened trading week, with the US market closed on Thursday, 27 November, and operating a half-day on Friday, 28 November.
It will be a holiday-shortened trading week, with the US market closed on Thursday, 27 November, and operating a half-day on Friday, 28 November. Wednesday, 26 November, is typically a very busy travel day, meaning many people may be out of the office. As a result, trading desks are likely to be more thinly staffed, and trading volumes may be lighter than usual. This could lead to more volatile trading conditions the entire week.

Additionally, it will be a post-OPEX week, and historically, volatility tends to expand slightly following options expiration. This is because gamma levels are reduced, meaning the pinning effects seen heading into OPEX fall away, allowing the market to move more freely, and this is referred to as OPEX drift.
S&P 500 Sees Volatile Session
Some of that volatility emerged on Friday, 21 November, with the S&P 500 finding support around 6,550, an important level from an options perspective. Round numbers — and increments of roughly 25 points — often become areas of concentrated options positioning. So, it is not surprising that on Friday, the 6,550 area acted as support, the 6,650 area acted as resistance, and the S&P 500 ultimately settled at 6,600. [chart1] This produced a wide trading range, even for an options expiration day, on rumours that the Trump administration could allow Nvidia to sell its H200 GPUs to China.
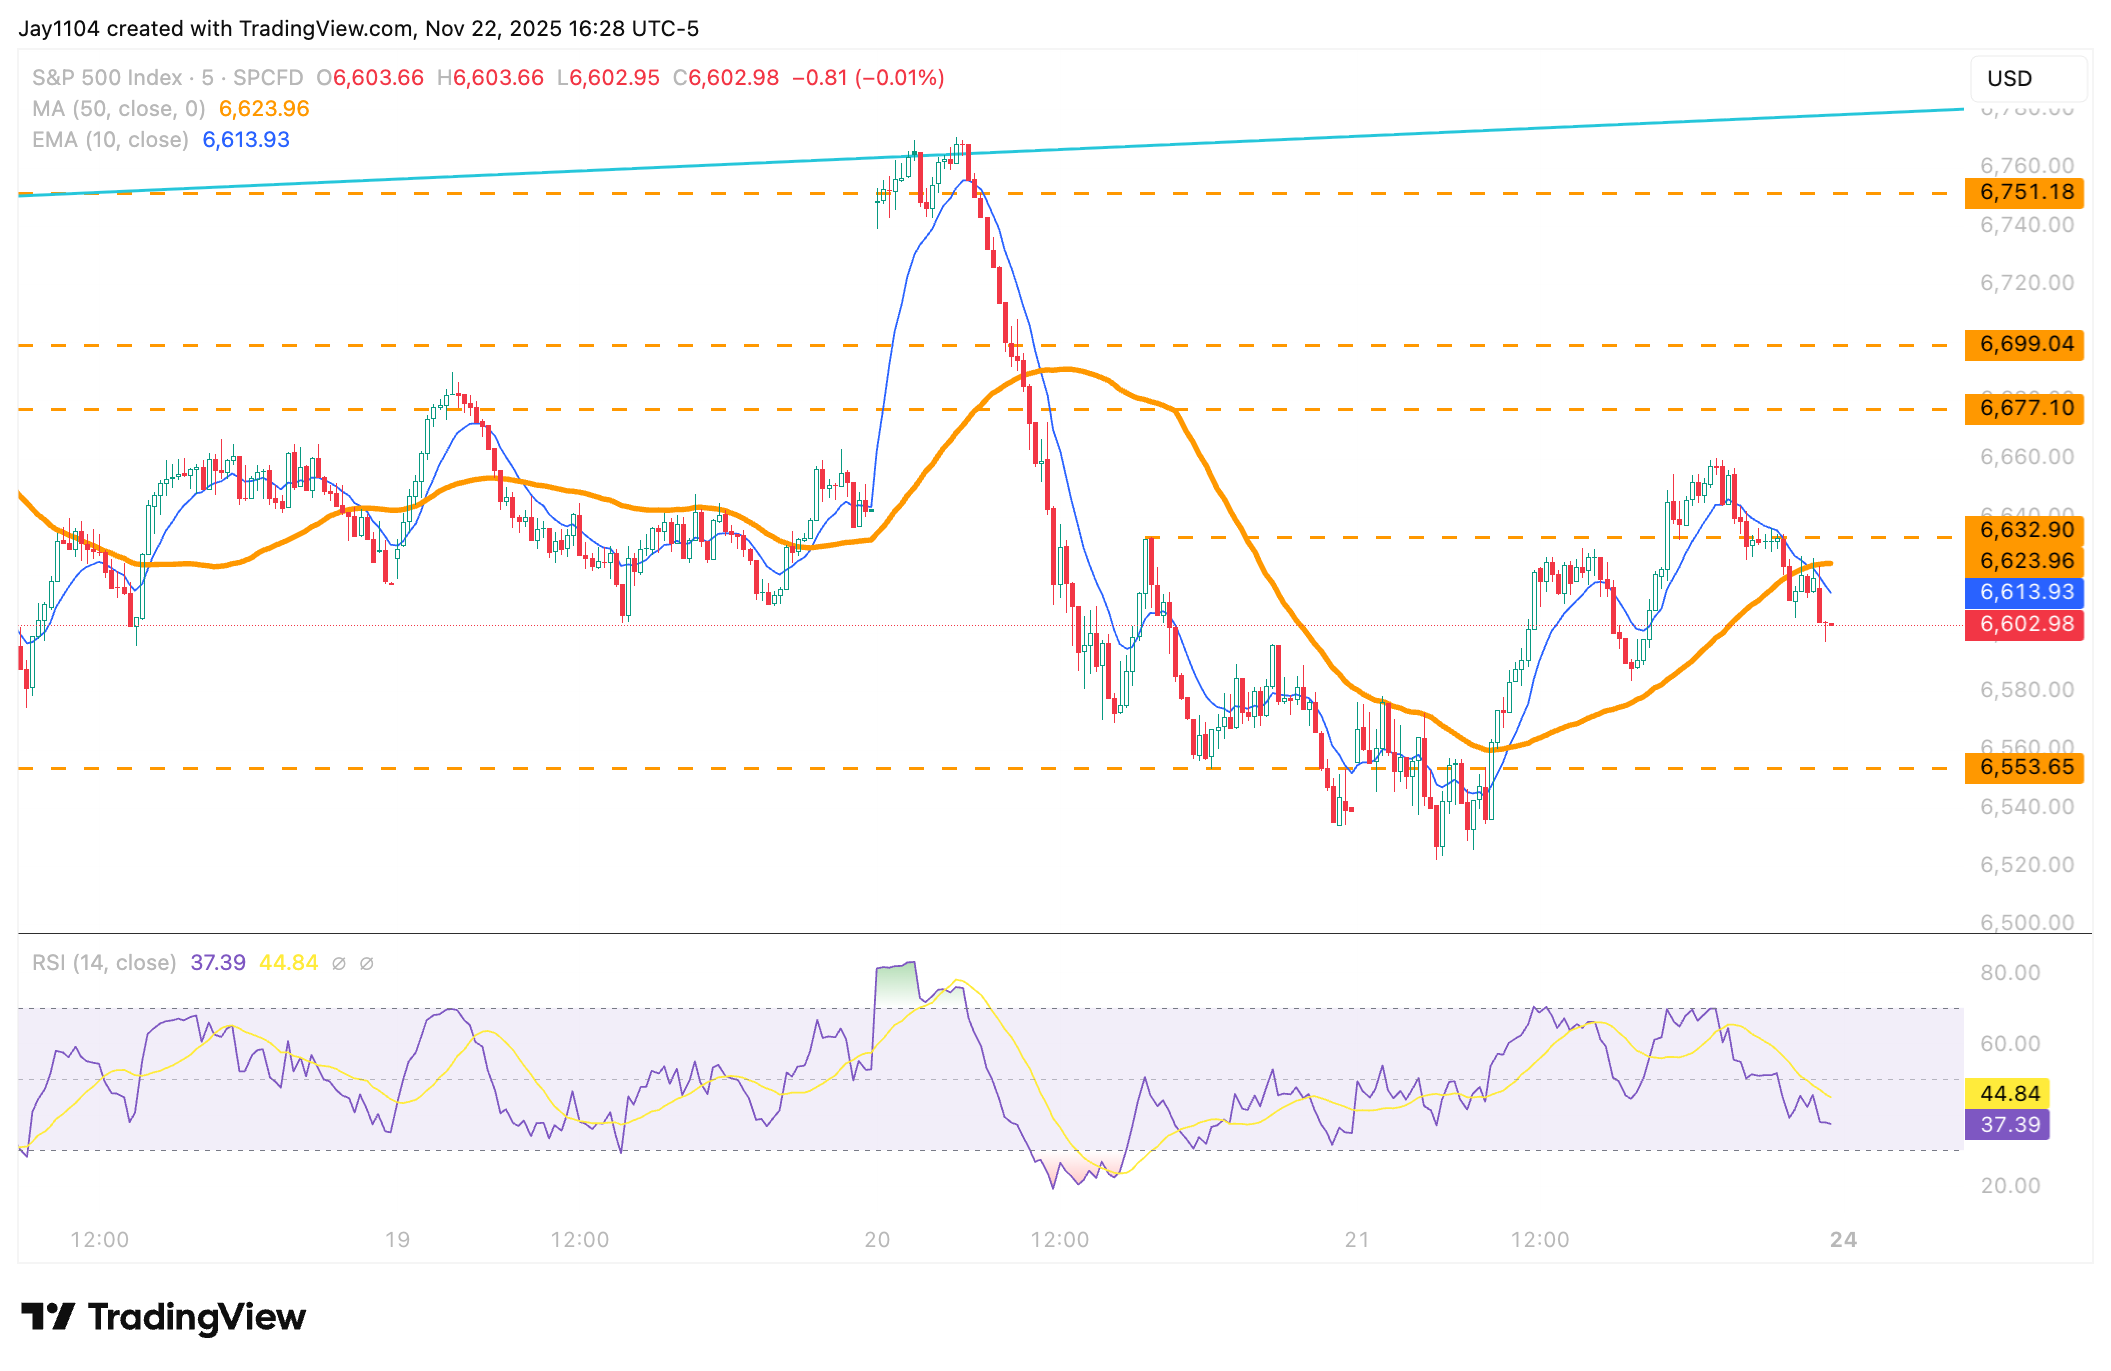
(Source: TradingView)
Past performance is not a reliable indicator of future results.
More importantly, the index continues to register a series of lower highs and lower lows, and, crucially, it remains in a clear downtrend. Support for the index remains around 6,550, while resistance is near 6,650 for now.[chart 2] If the index were to break below 6,550, that is where real trouble could begin, as it represents the last major level of technical support. Below that, the next significant technical support level does not come in until around 6,350. A break of 6,350 would be even more concerning, but for now, there is still some distance before reaching that point.

(Source: TradingView)
Past performance is not a reliable indicator of future results.
Russell 2000 Nears Potential Breakout
The Russell 2000 has also been trending lower and is currently trading near technical support at 2,320. This is an important level because if it breaks, it will likely open the door to a decline towards 2,140.
On Friday, the index attempted to rally to the 10-day exponential moving average but ran into resistance there. In fact, both Thursday and Friday saw the Russell try — and fail — to push above the 10-day EMA, which now appears to be a significant technical resistance level. A breakout above the EMA would increase the chances of the index returning to the 50-day moving average near 2,450 and potentially filling a gap from 12 November. [chart 3]
The trend remains lower for now, and the 10-day EMA continues to provide stiff resistance. To sustain any upward momentum seen on Friday, the index would likely need to see a strong move early in the week — ideally a gap higher on Monday. Failure to do so would be a negative development, and any move higher with an intraday reversal lower would be an even more concerning signal, as seen on Thursday, 20 November, of last week.

(Source: TradingView)
Past performance is not a reliable indicator of future results.
Gold Struggles May Continue
Gold has continued to consolidate sideways recently, trading largely between the 10-day exponential moving average and the 20-day simple moving average. After reaching the Fibonacci 61.8% retracement level on 13 November, it has struggled to regain momentum and has generally drifted lower since.
It now appears that gold may have formed a small bear flag. If so, the next leg lower could be imminent, which could likely push prices back towards the recent lows around $3,890. Momentum on the RSI also continues to trend lower, reinforcing the idea that further declines may be ahead.
However, if gold can break above the $4,190 highs, it would open the possibility of a move back towards $4,400. For now, though, gold would need to show a much more decisive push higher — something it has not managed to do recently. [chart 4]
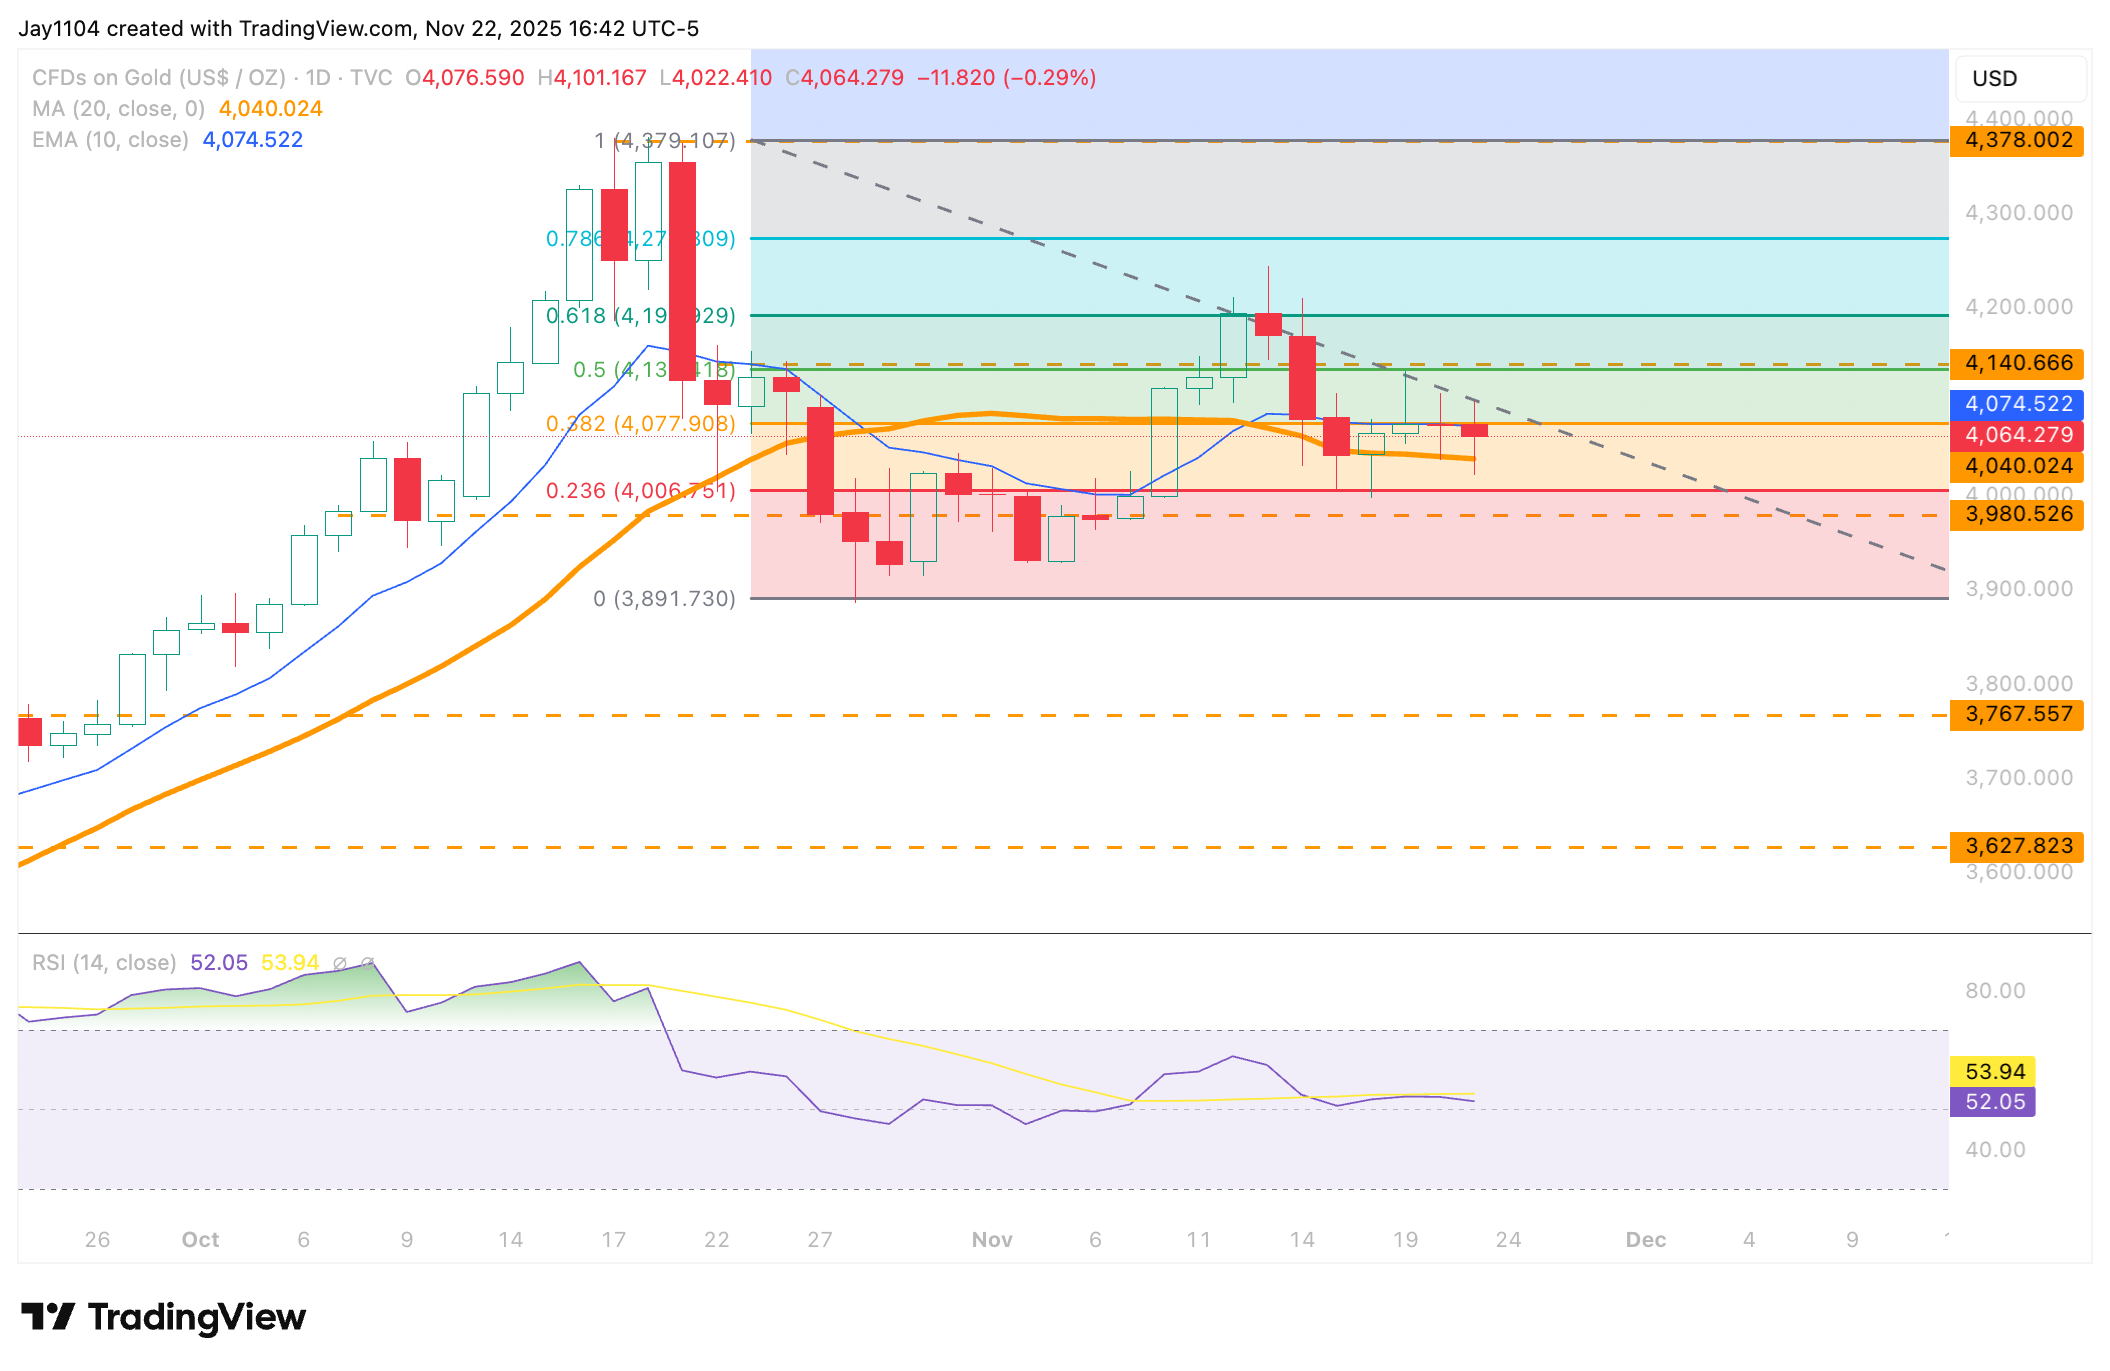
(Source: TradingView)
Past performance is not a reliable indicator of future results.