Meta Platforms Q4 earnings forecast to surge on solid ad revenues
Meta Platforms (META) reports its Q4 results after Wall Street’s closing bell on February 1, 2024. We preview what to expect from the results and analyse the stock’s technicals.
Meta Platforms (META) reports its Q4 results after Wall Street’s closing bell on February 1, 2024. We preview what to expect from the results and analyse the stock’s technicals.
Meta tipped to deliver strong EPS growth on resilient ad revenues
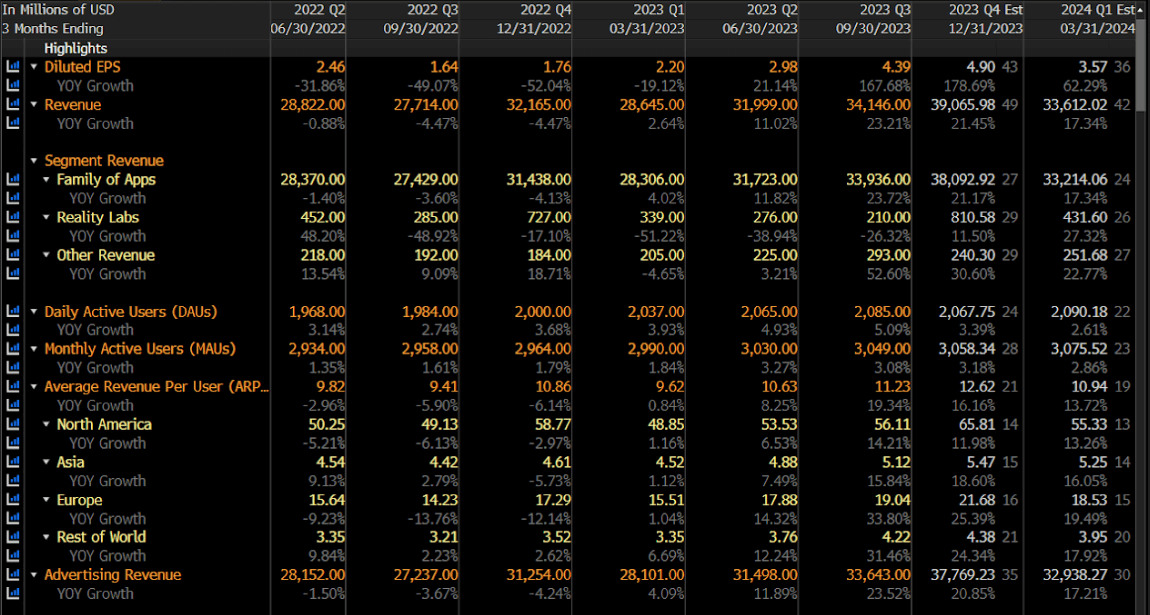
According to Bloomberg data, Meta Platforms will deliver robust earnings growth in Q4, driven by strong advertising revenues across its application suite of products. Earnings-per-share is forecast to rise 179% to $4.90 from a 21% revenue lift to $US38.1 billion.
The solid topline growth comes amidst resilient consumer activity in several of Meta’s key markets. The multi-year decline in ad pricing is expected to slow down, with revenue growth coming despite what is projected to be only modest increases in daily active users and monthly active users of approximately 3%.
 (Source: Bloomberg)
Analysts surveyed by Bloomberg expect Meta’s capital expenditures to remain under control after surging following the company’s strategic pivot to the Metaverse. Operating margins in Q1 are tipped to be higher than a year earlier and in line with the previous quarter.
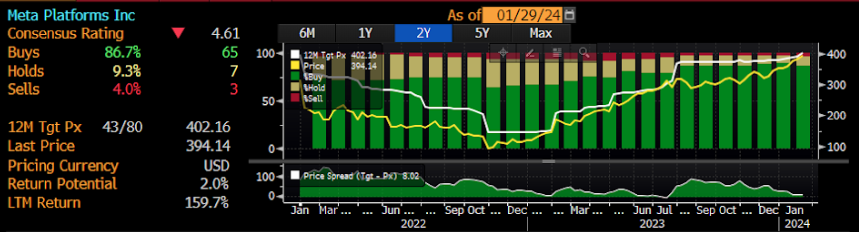
The broker community is bullish on Meta’s shares. The stock has a consensus buy rating, with 65 analysts providing that recommendation, 10 suggesting a hold, and three suggesting a sell. The consensus price target is slightly above current market valuations at $402.16.
(Source: Bloomberg) Past performance is not a reliable indicator of future results
Technical analysis: Meta shares surge to fresh all-time highs
The technical set-up for Meta Platforms is very bullish after the stock hit all-time highs. The weekly RSI is at overbought levels but still signals positive momentum and remains below 80, which is a level that’s marked pullbacks in the past. The bulls might want to see prices consolidate above previous all-time highs to provide evidence of a sustained uptrend. Meanwhile, the stock might find technical support at approximately $360 and $330, with the latter also marking the 20-week moving average.
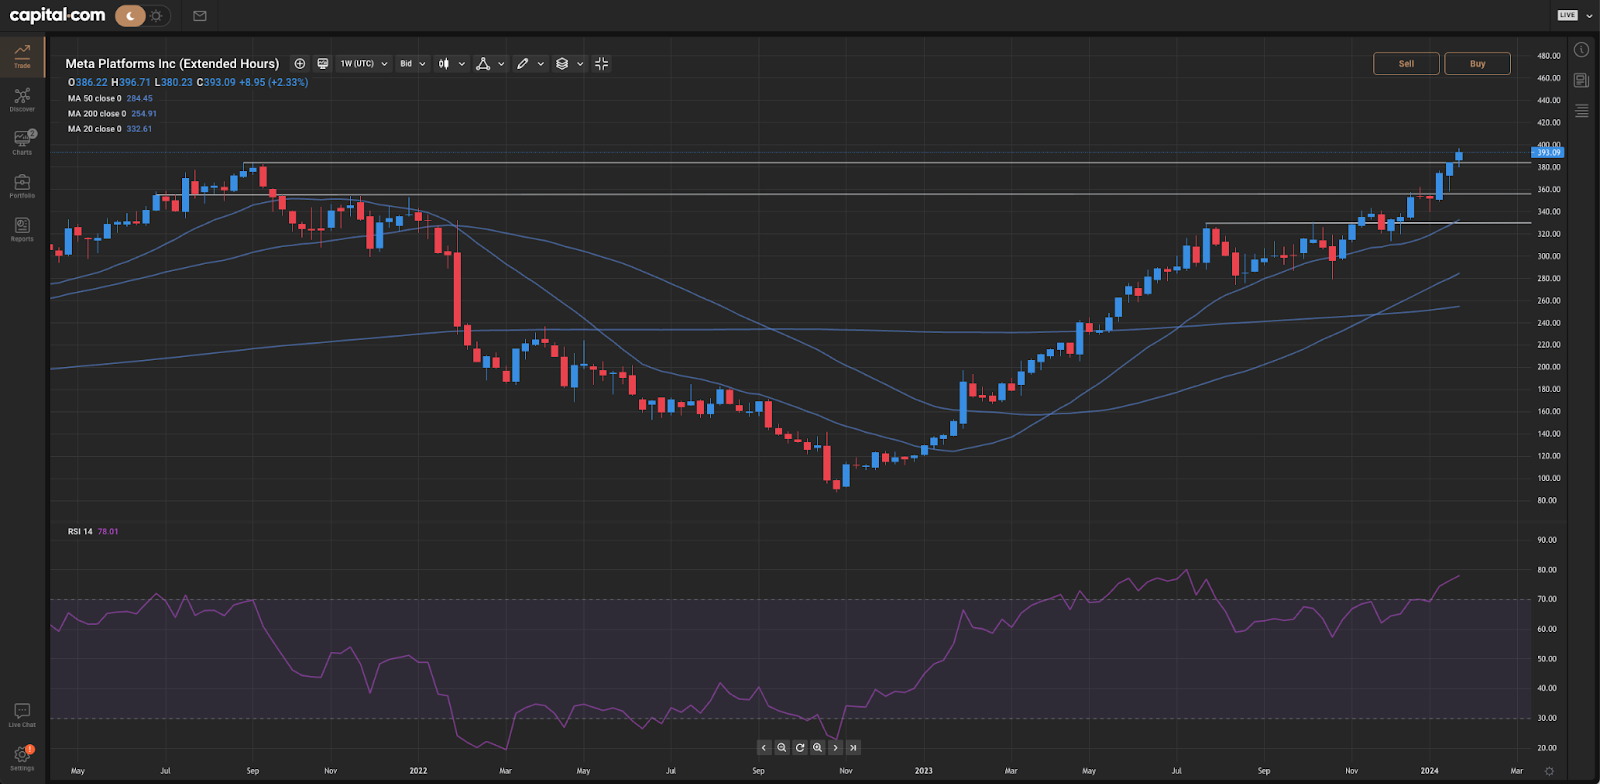
(Source: Capital.com) Past performance is not a reliable indicator of future results