Markets Rally as Volatility Collapses While Gold and Coffee Weaken
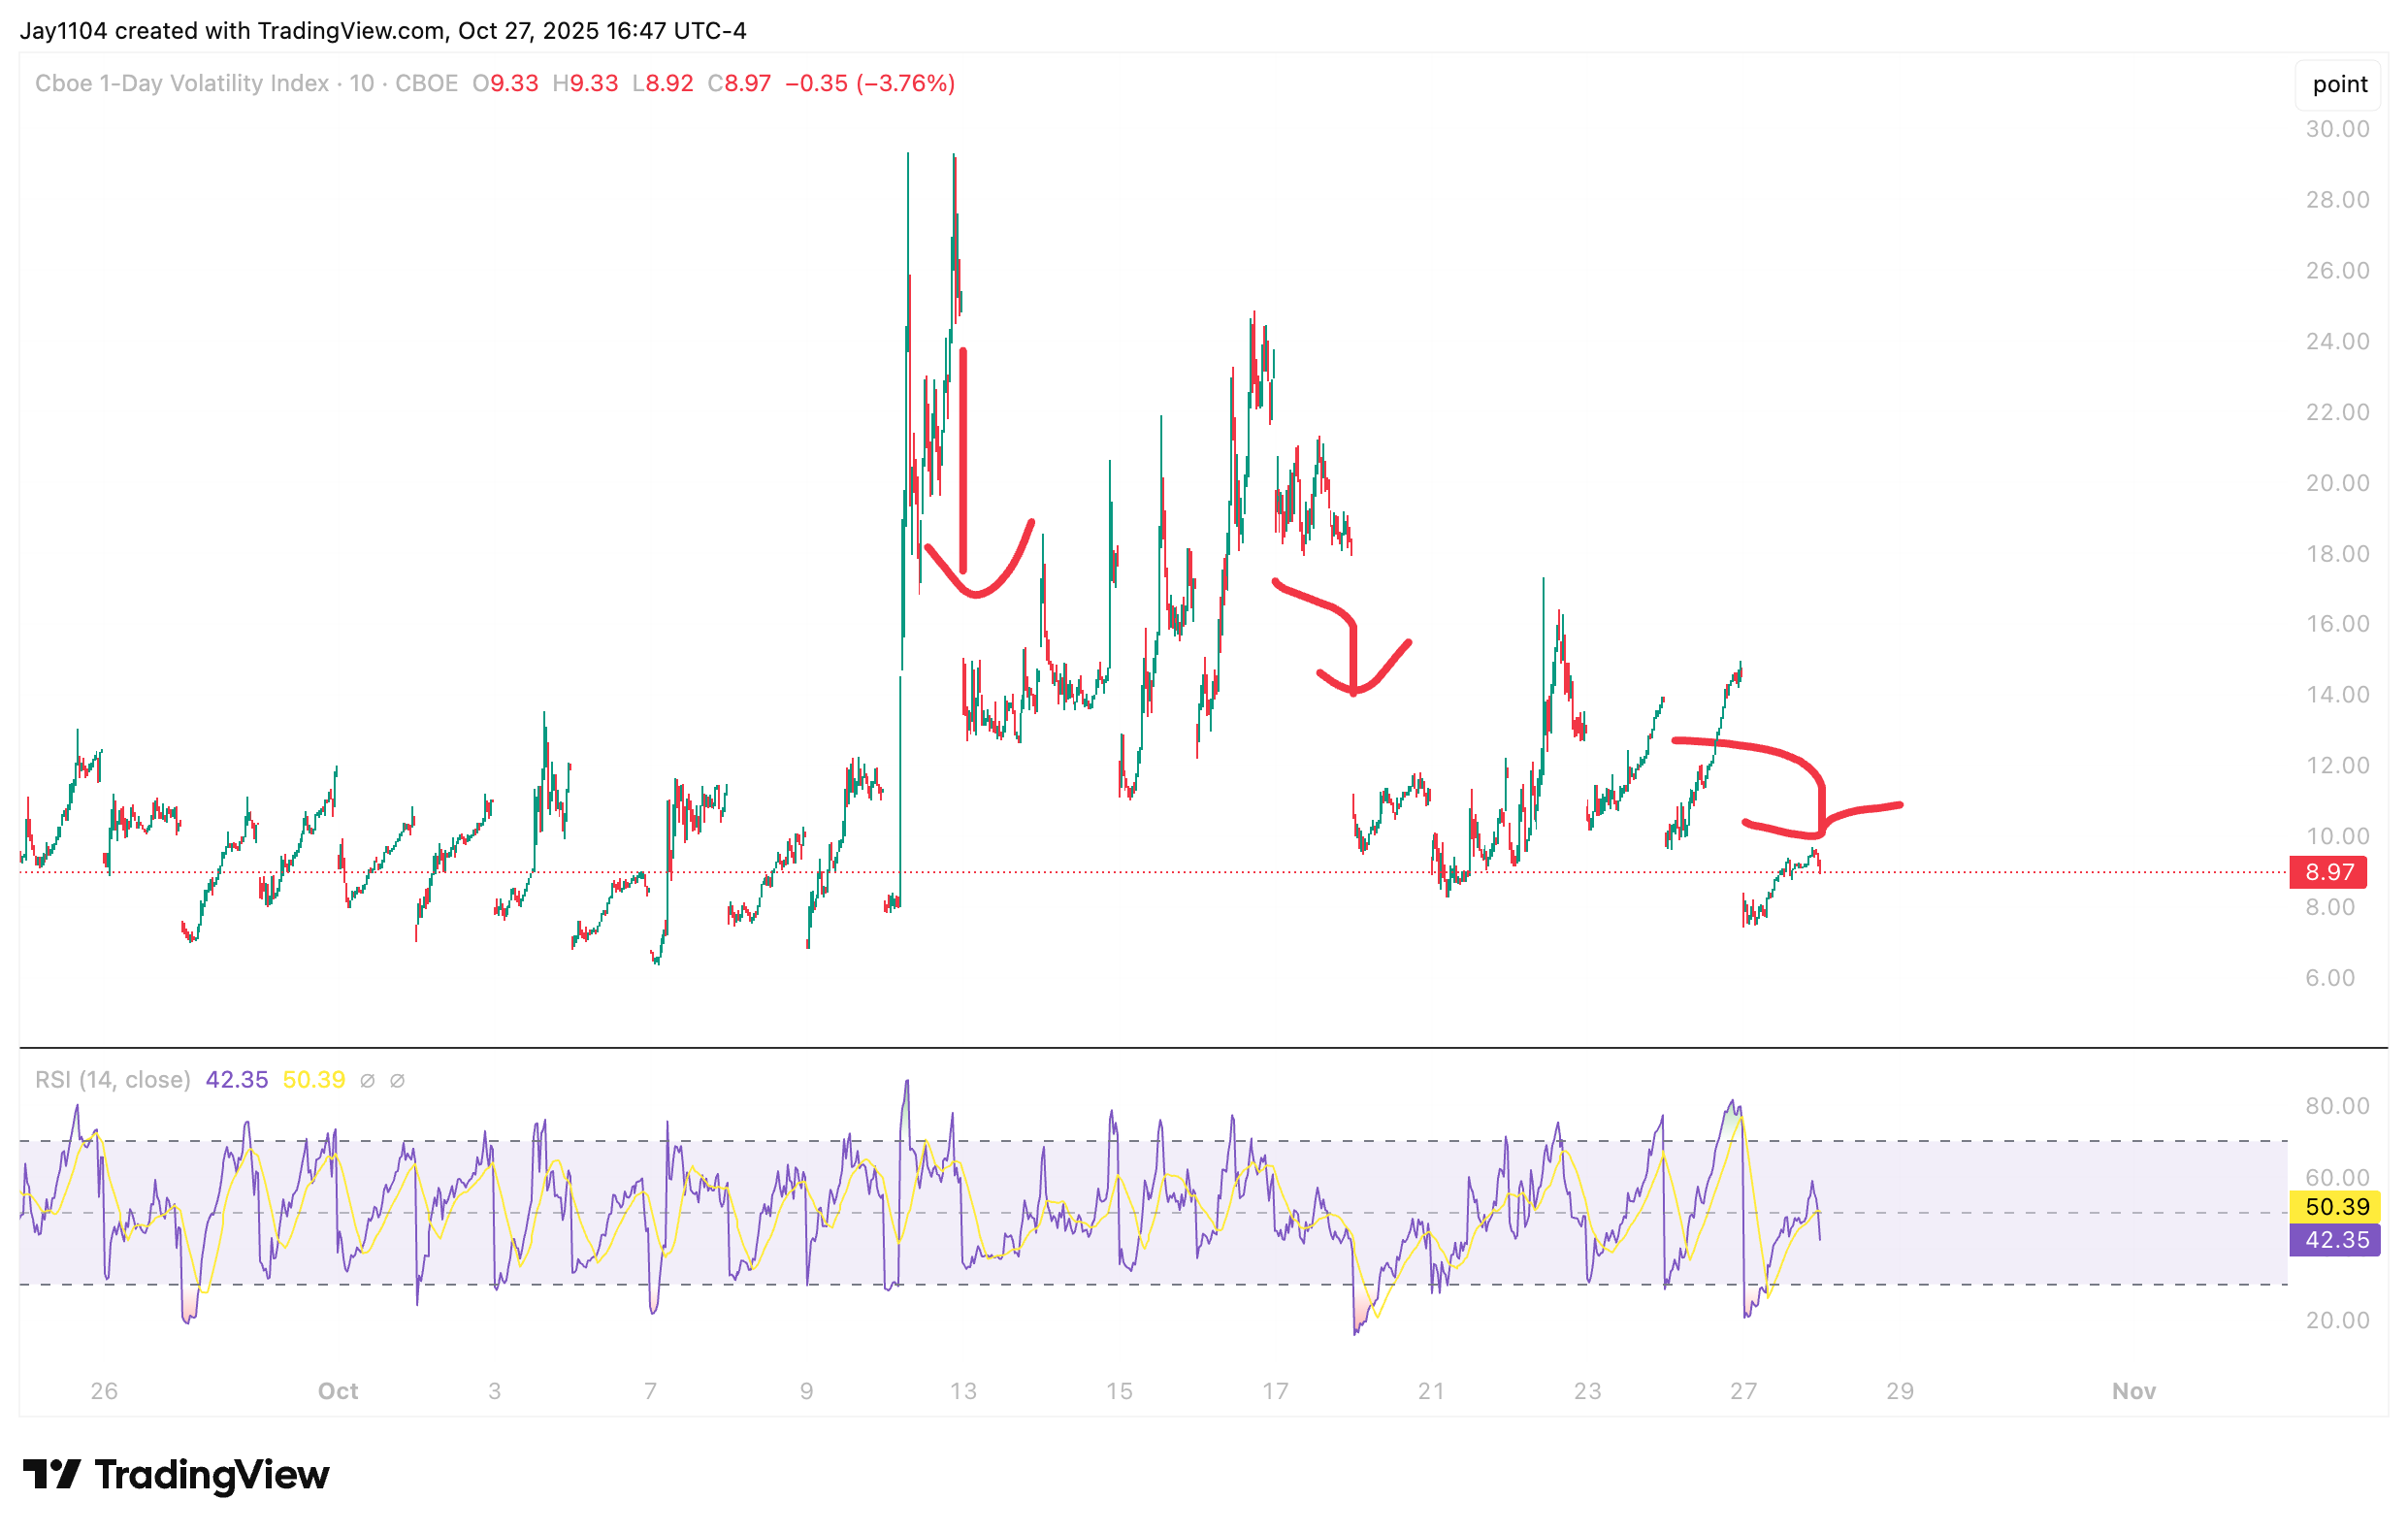
The S&P 500 rallied about 1% on the day. This came as implied volatility, as measured by the VIX 1-Day, fell sharply from an elevated level on Friday, 24 October.
This has now been a similar setup seen on a couple of Mondays in a row. In fact, the same thing happened last week when the VIX 1-Day closed above 17 on the 17th, only to drop to around 10 on the 20th. The same thing also happened on 10 October, when it rose to 25.7 on a Friday, only to open at 14 on the following Monday.
(Source: TradingView)
(Past performance is not a reliable indicator of future results)
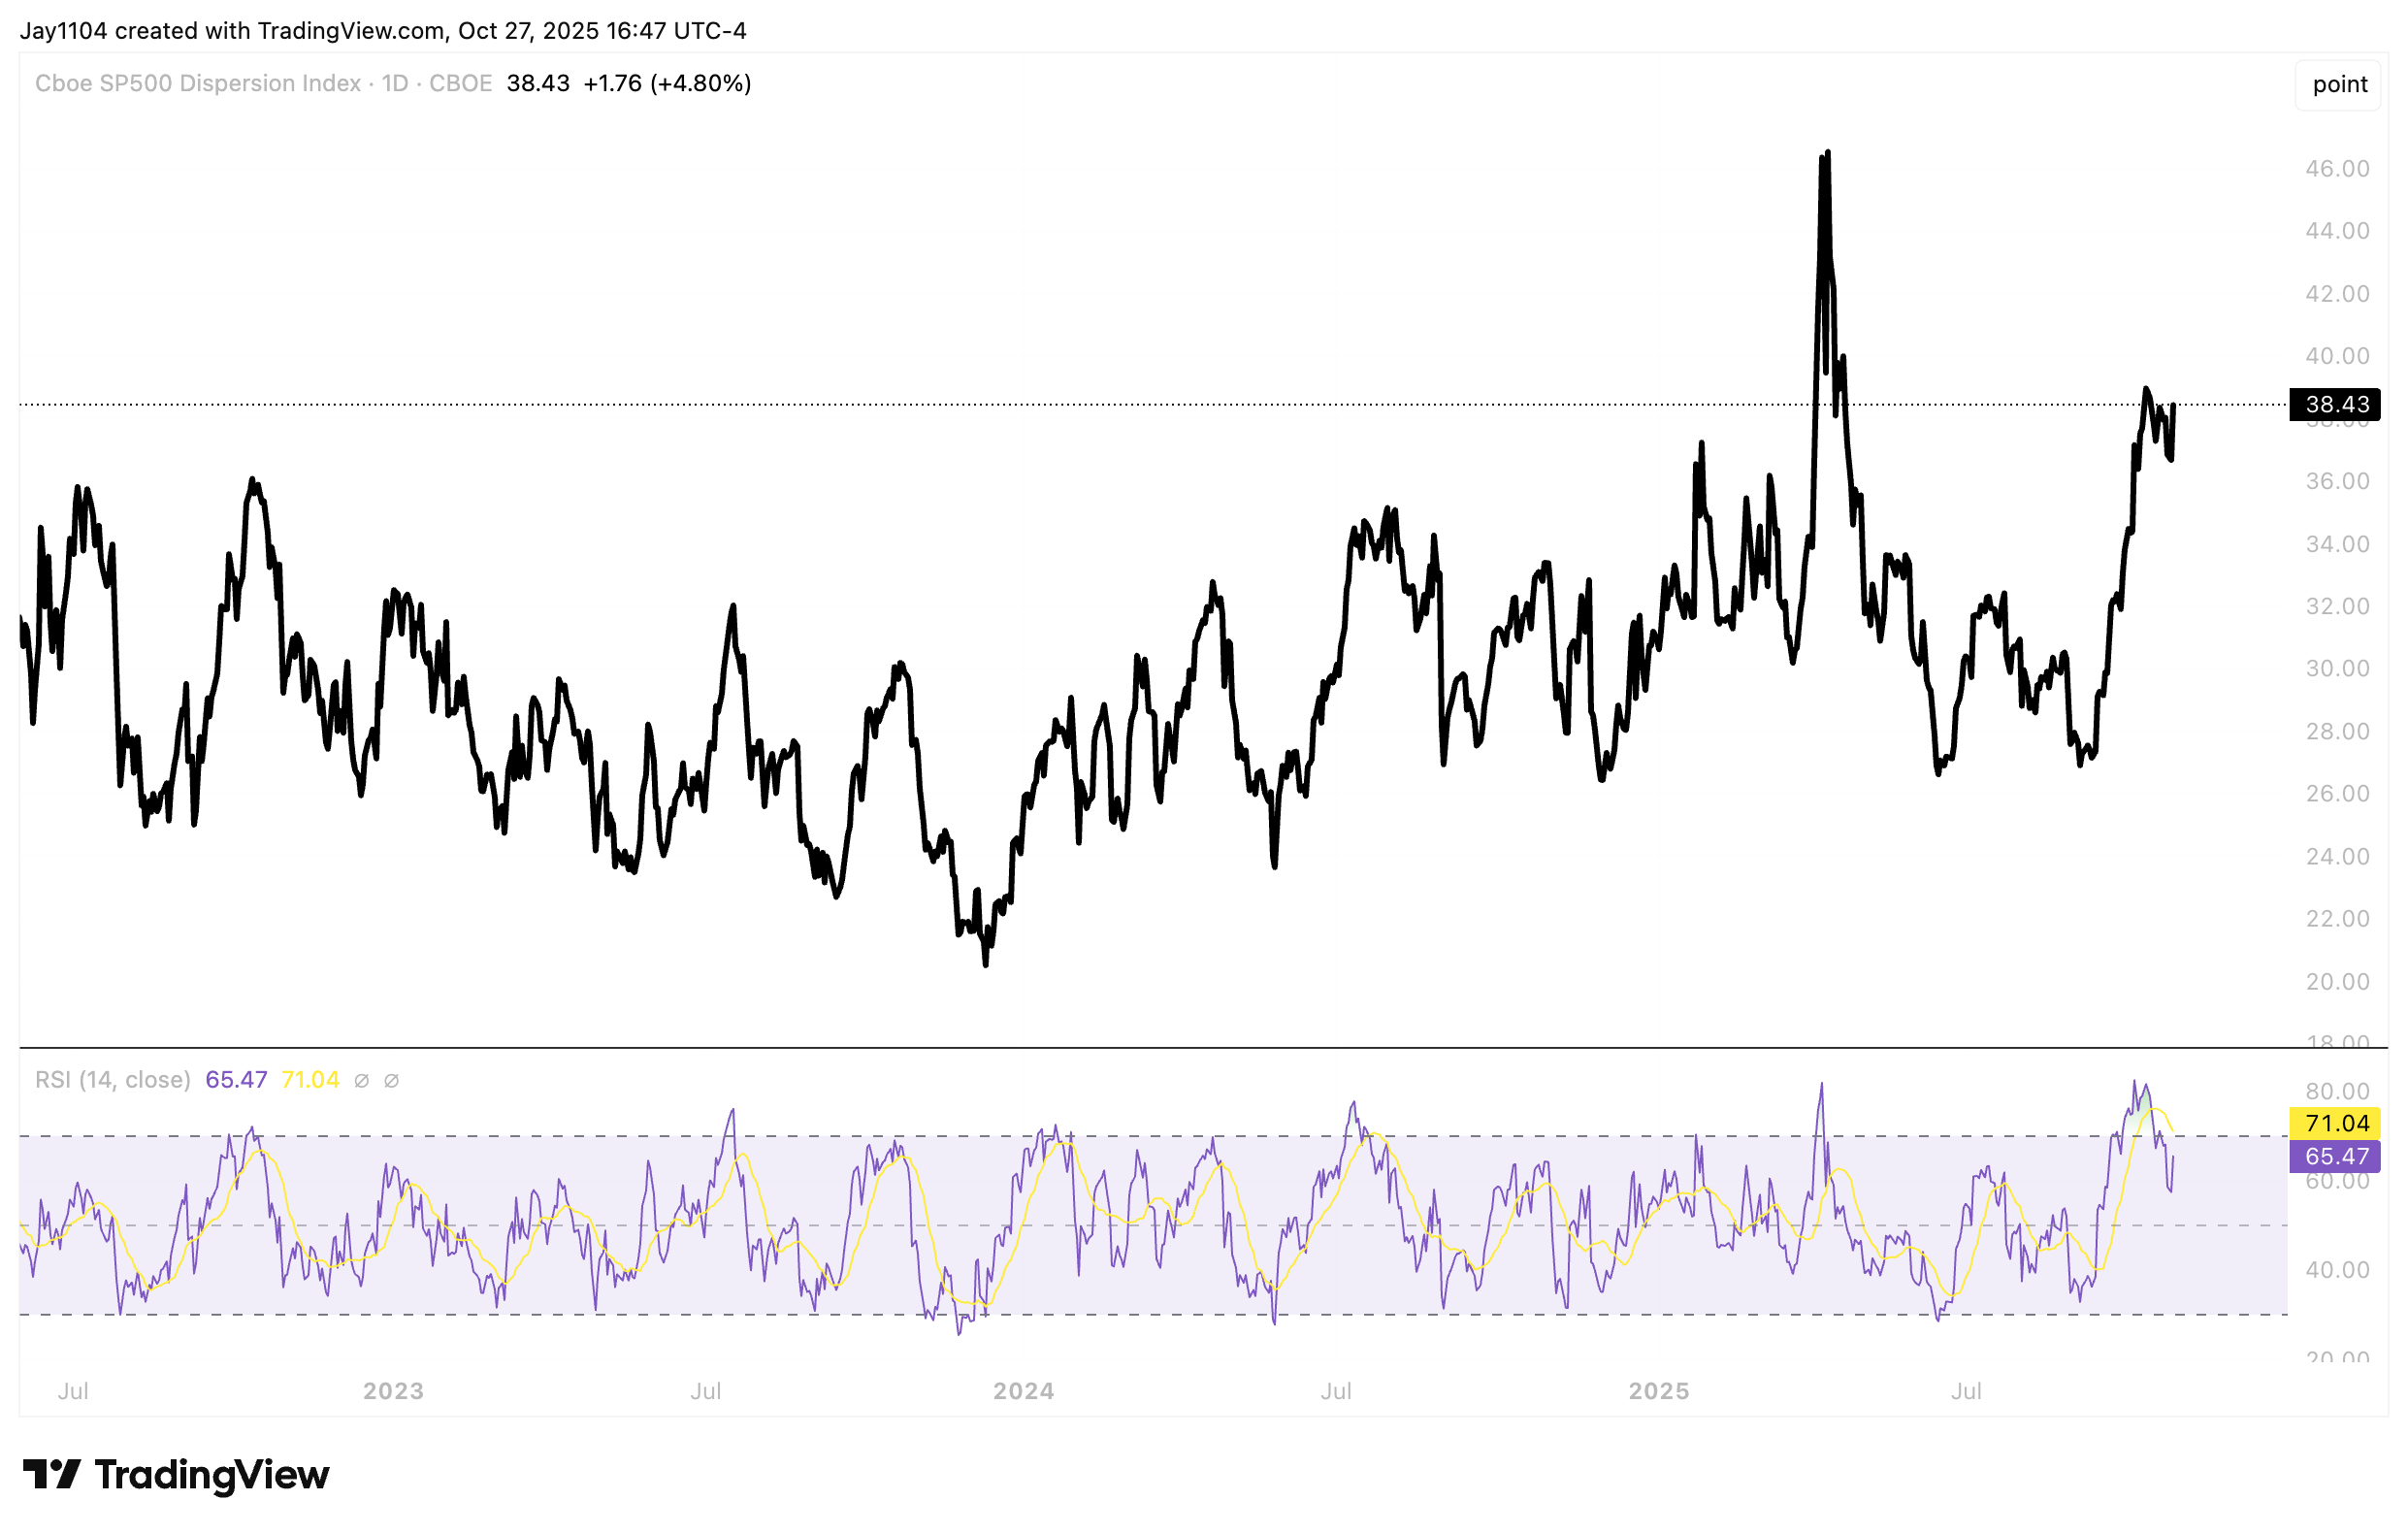
We’ve now seen, on consecutive Mondays going back to the 13th, moves of 1.6%, 1%, and now another move of about 1.2%. The problem is that after Monday, the market hasn’t done much in the days that followed, up until last Friday, which really makes one wonder how much of this move is genuine versus driven by market mechanics. Meanwhile, the S&P 500 dispersion index rose sharply by nearly 5% to 38.5, suggesting that stocks are not moving together but rather in their own distinct directions, another sign of market mechanics at play, perhaps due to earnings season dispersion.
(Source: TradingView)
(Past performance is not a reliable indicator of future results)
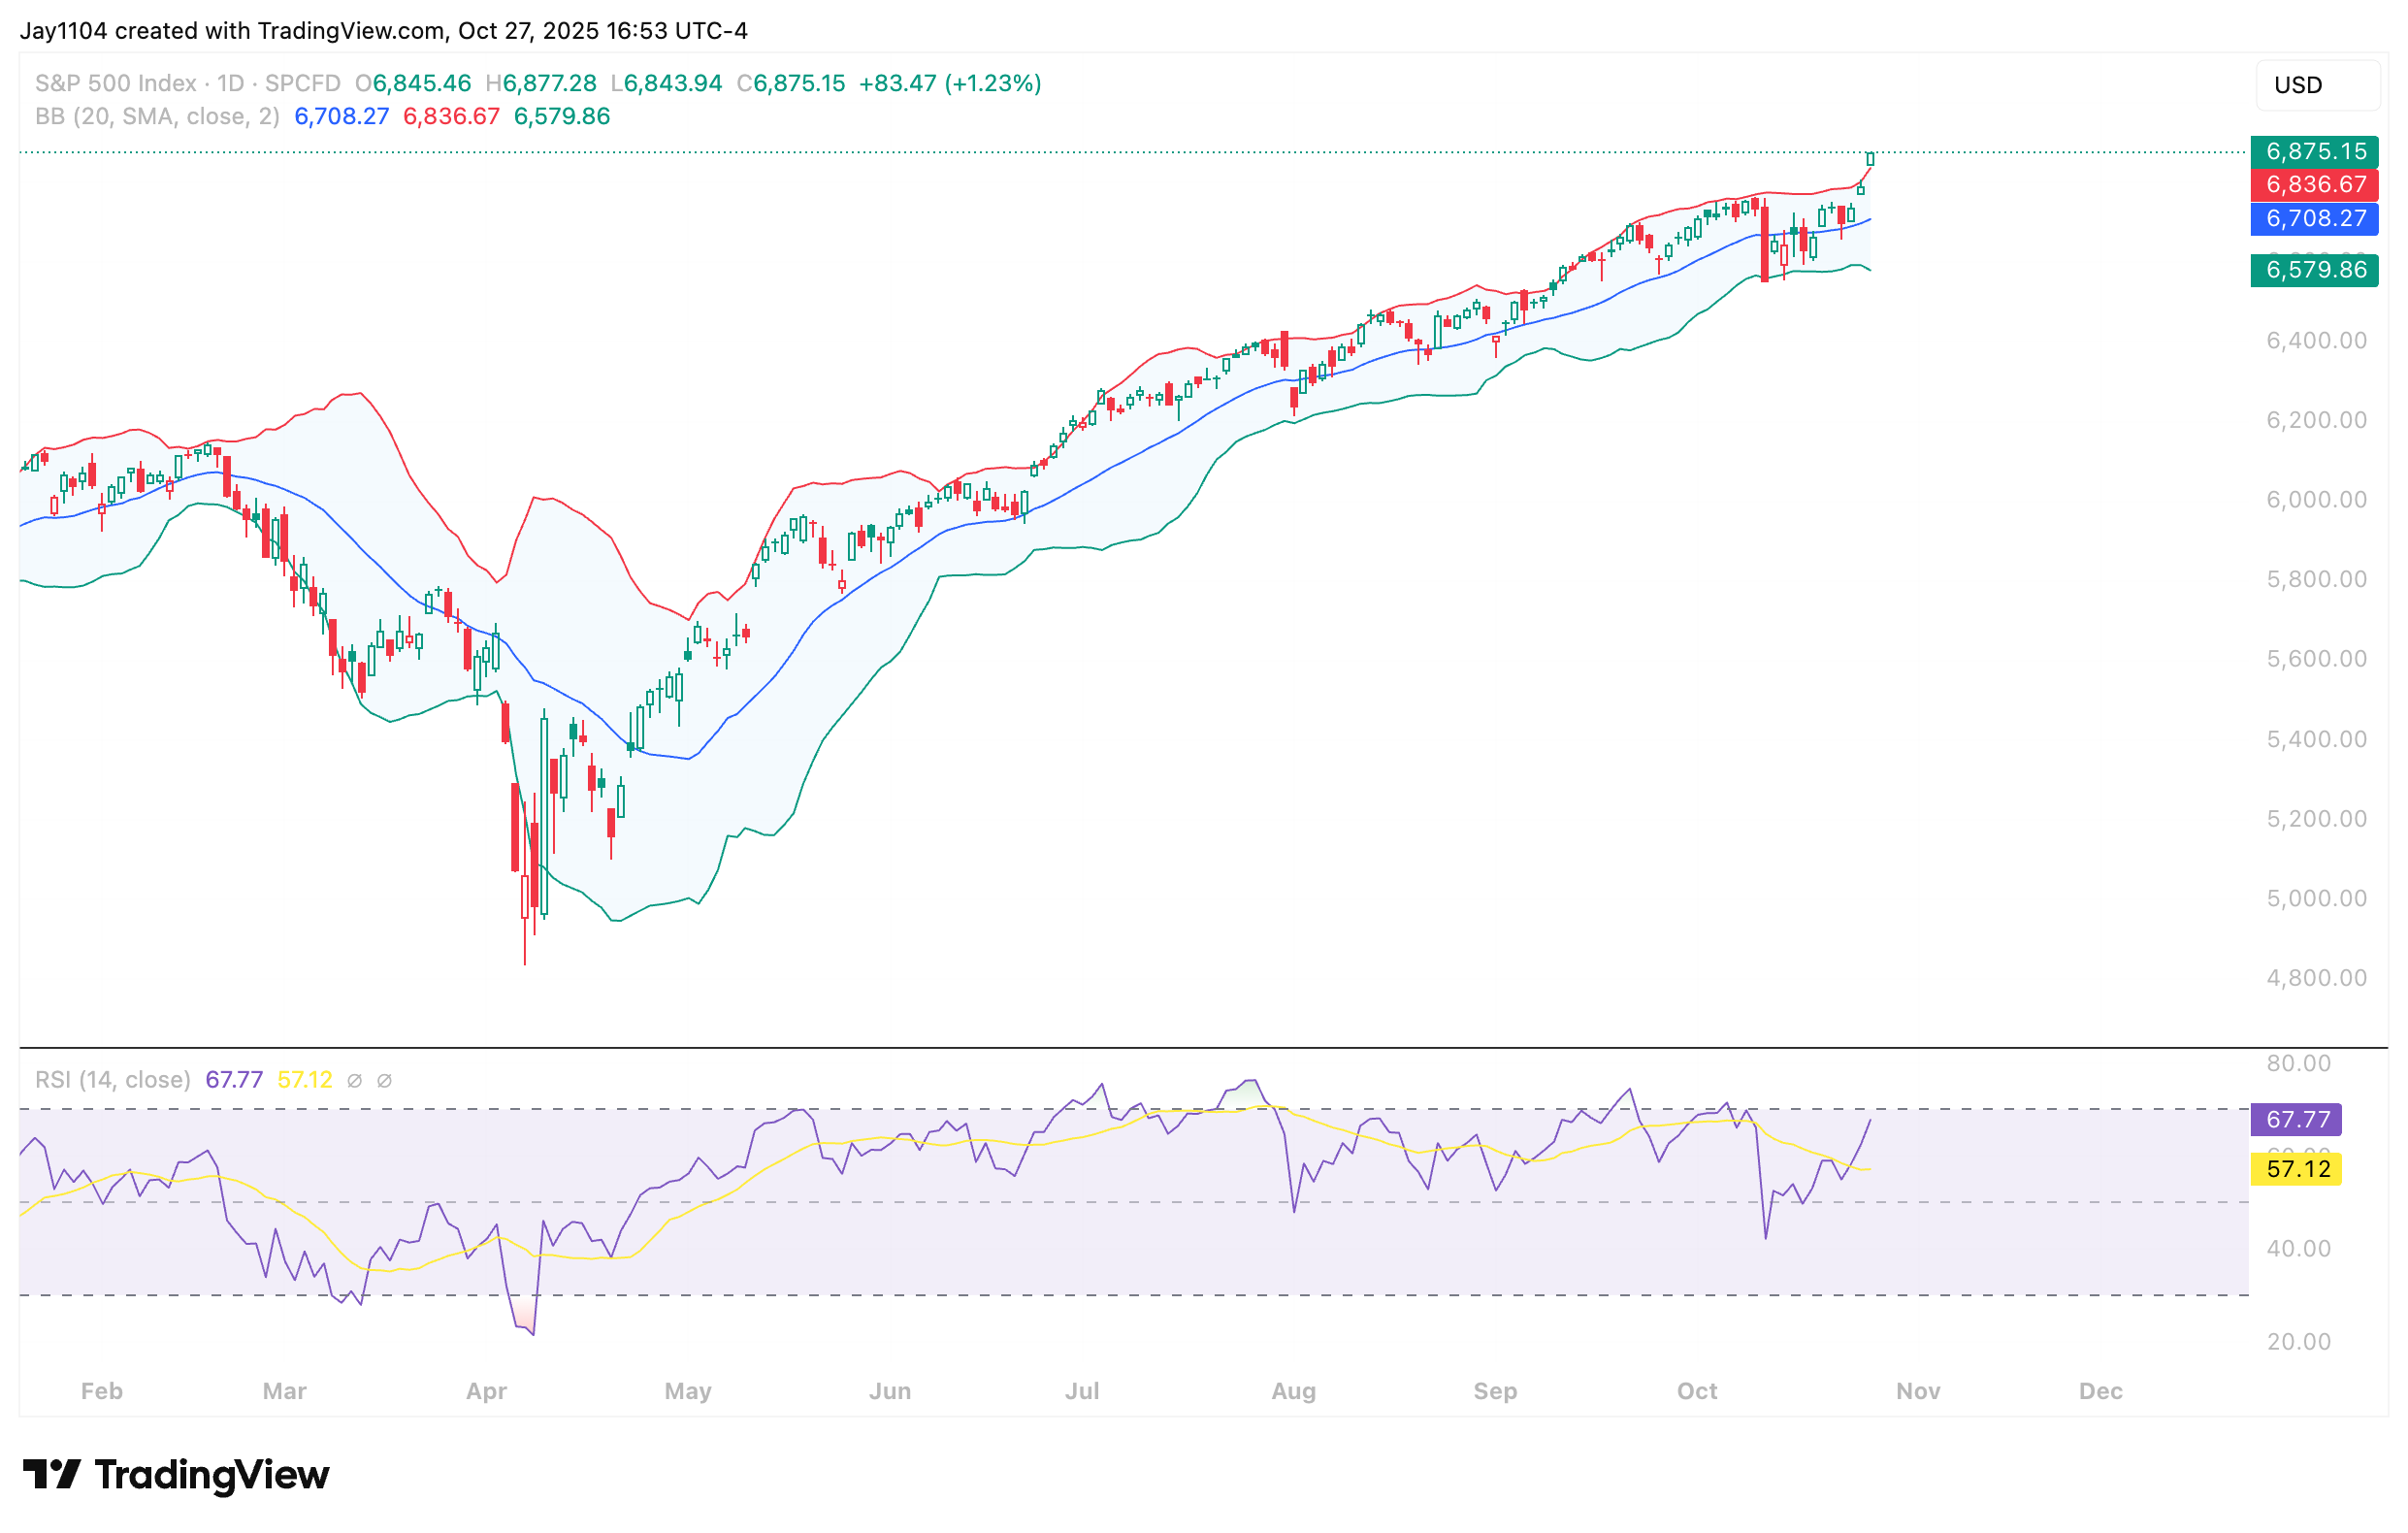
The S&P 500 gap above its upper Bollinger Band, closing the session one full bar entirely above it, something that doesn’t happen very often. This indicates the index is currently overextended and likely approaching overbought territory, though the RSI suggests there may still be room for further gains. At 68, however, it may suggests the move higher is likely quite limited at this stage.
(Source: TradingView)
(Past performance is not a reliable indicator of future results)
Gold
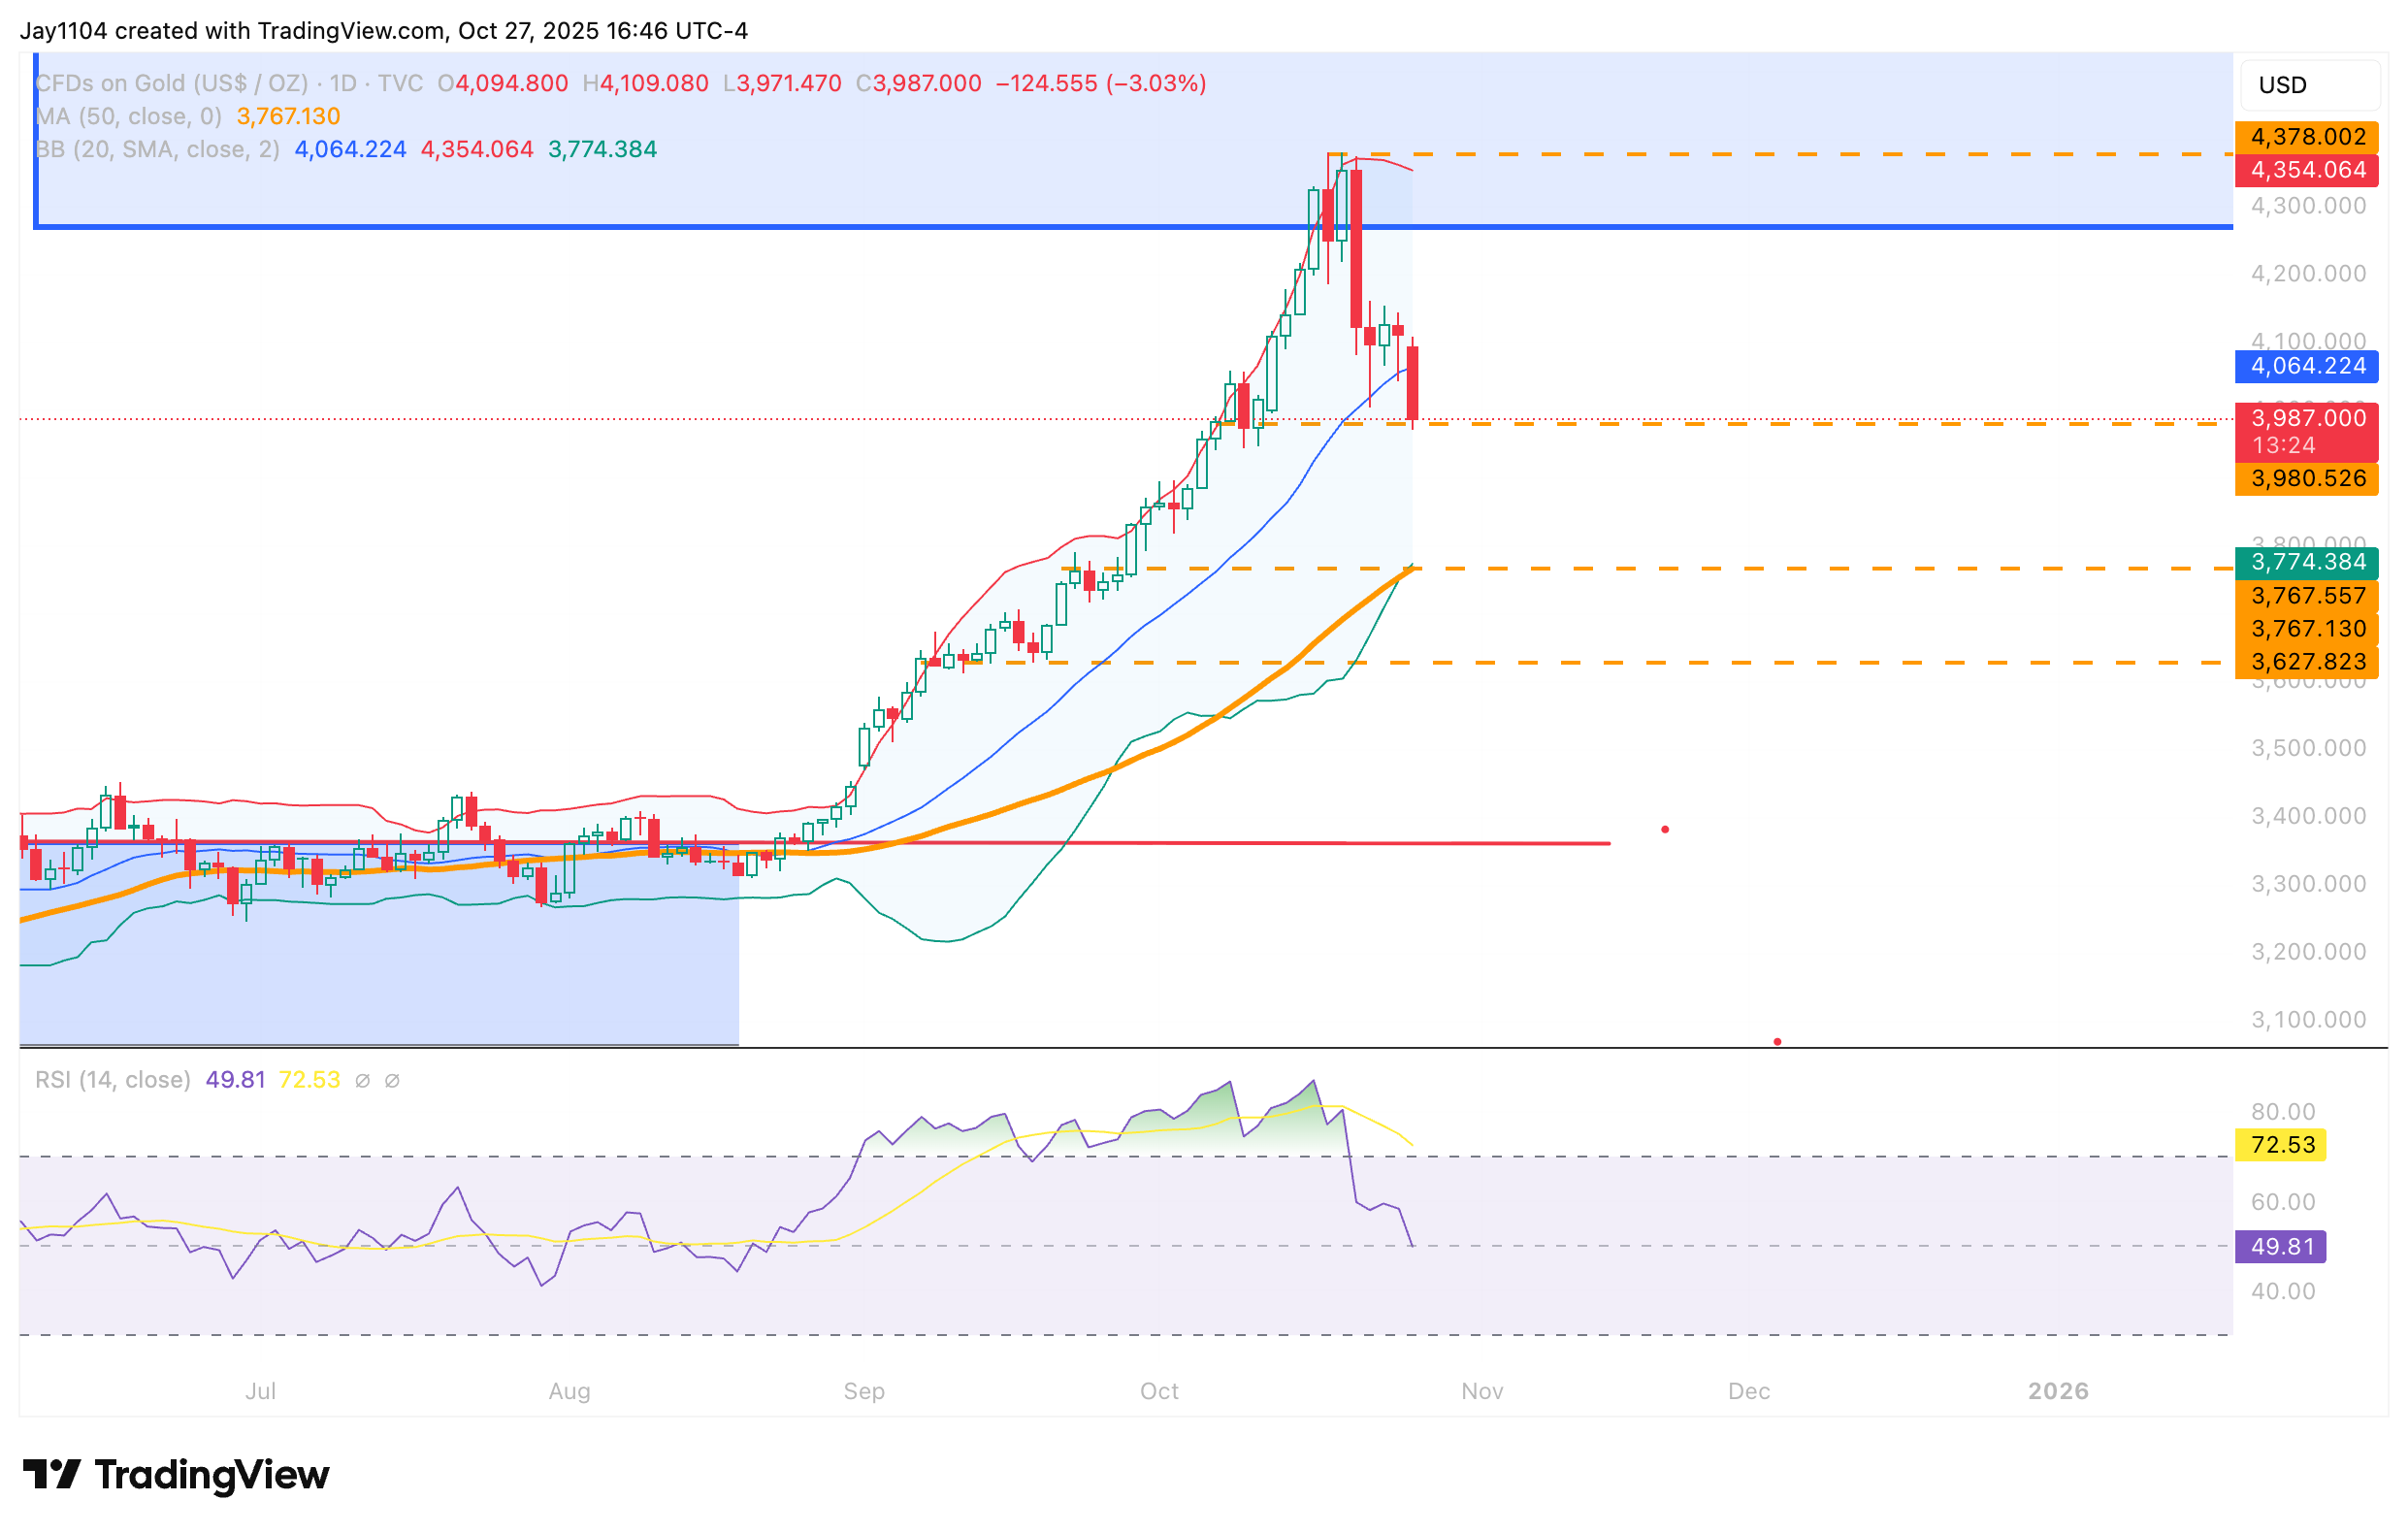
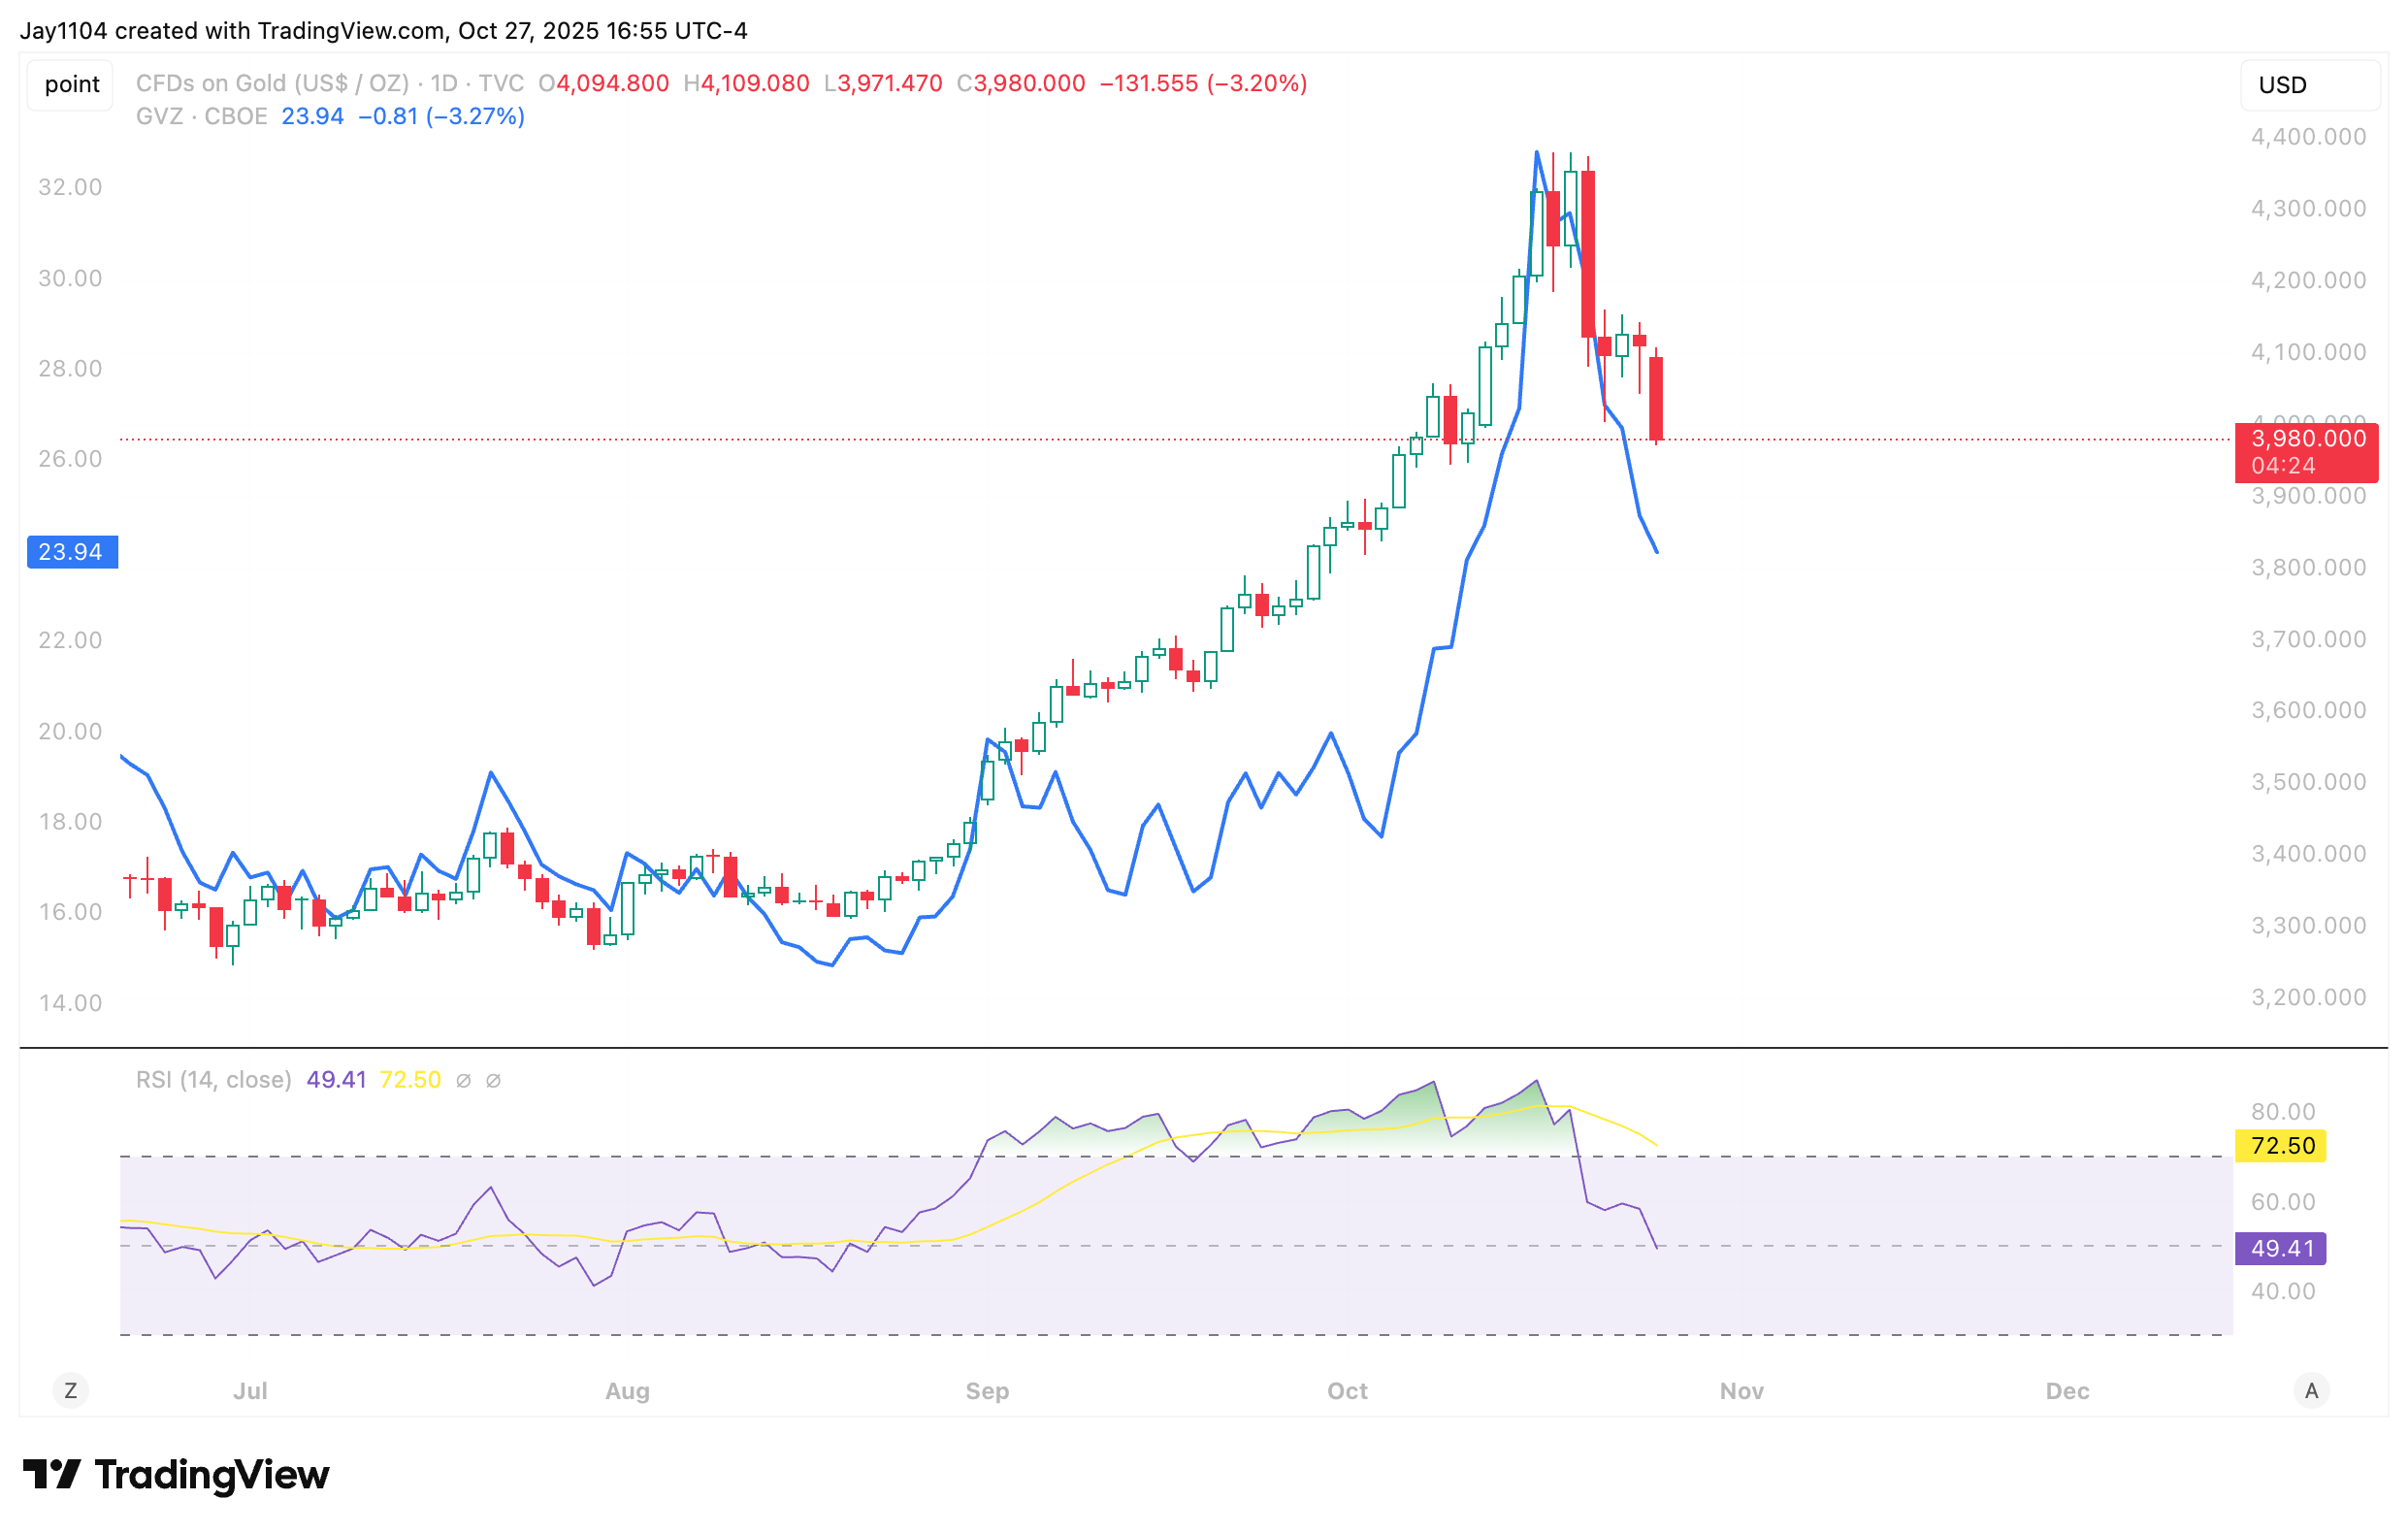
Gold fell by more than 3% on the day, dropping below the 20-day simple moving average. It has also remained under the 10-day exponential moving average, which has acted as resistance since 21 October. At present, gold is sitting on support at $3,988, and a break below this level could see the price fall towards $3,775, a move that would align with both the lower Bollinger Band and the 50-day moving average, which are converging around the same point.
(Source: TradingView)
(Past performance is not a reliable indicator of future results)
Additionally, the RSI has now slipped below 50, indicating weakening momentum, while downside pressure appears to be accelerating. At the same time, volatility measures for gold continue to decline in a rare spot-down, vol-down scenario, suggesting that the gold rally may, in fact, be in the early stages of unwinding.
(Source: TradingView)
(Past performance is not a reliable indicator of future results)
Coffee
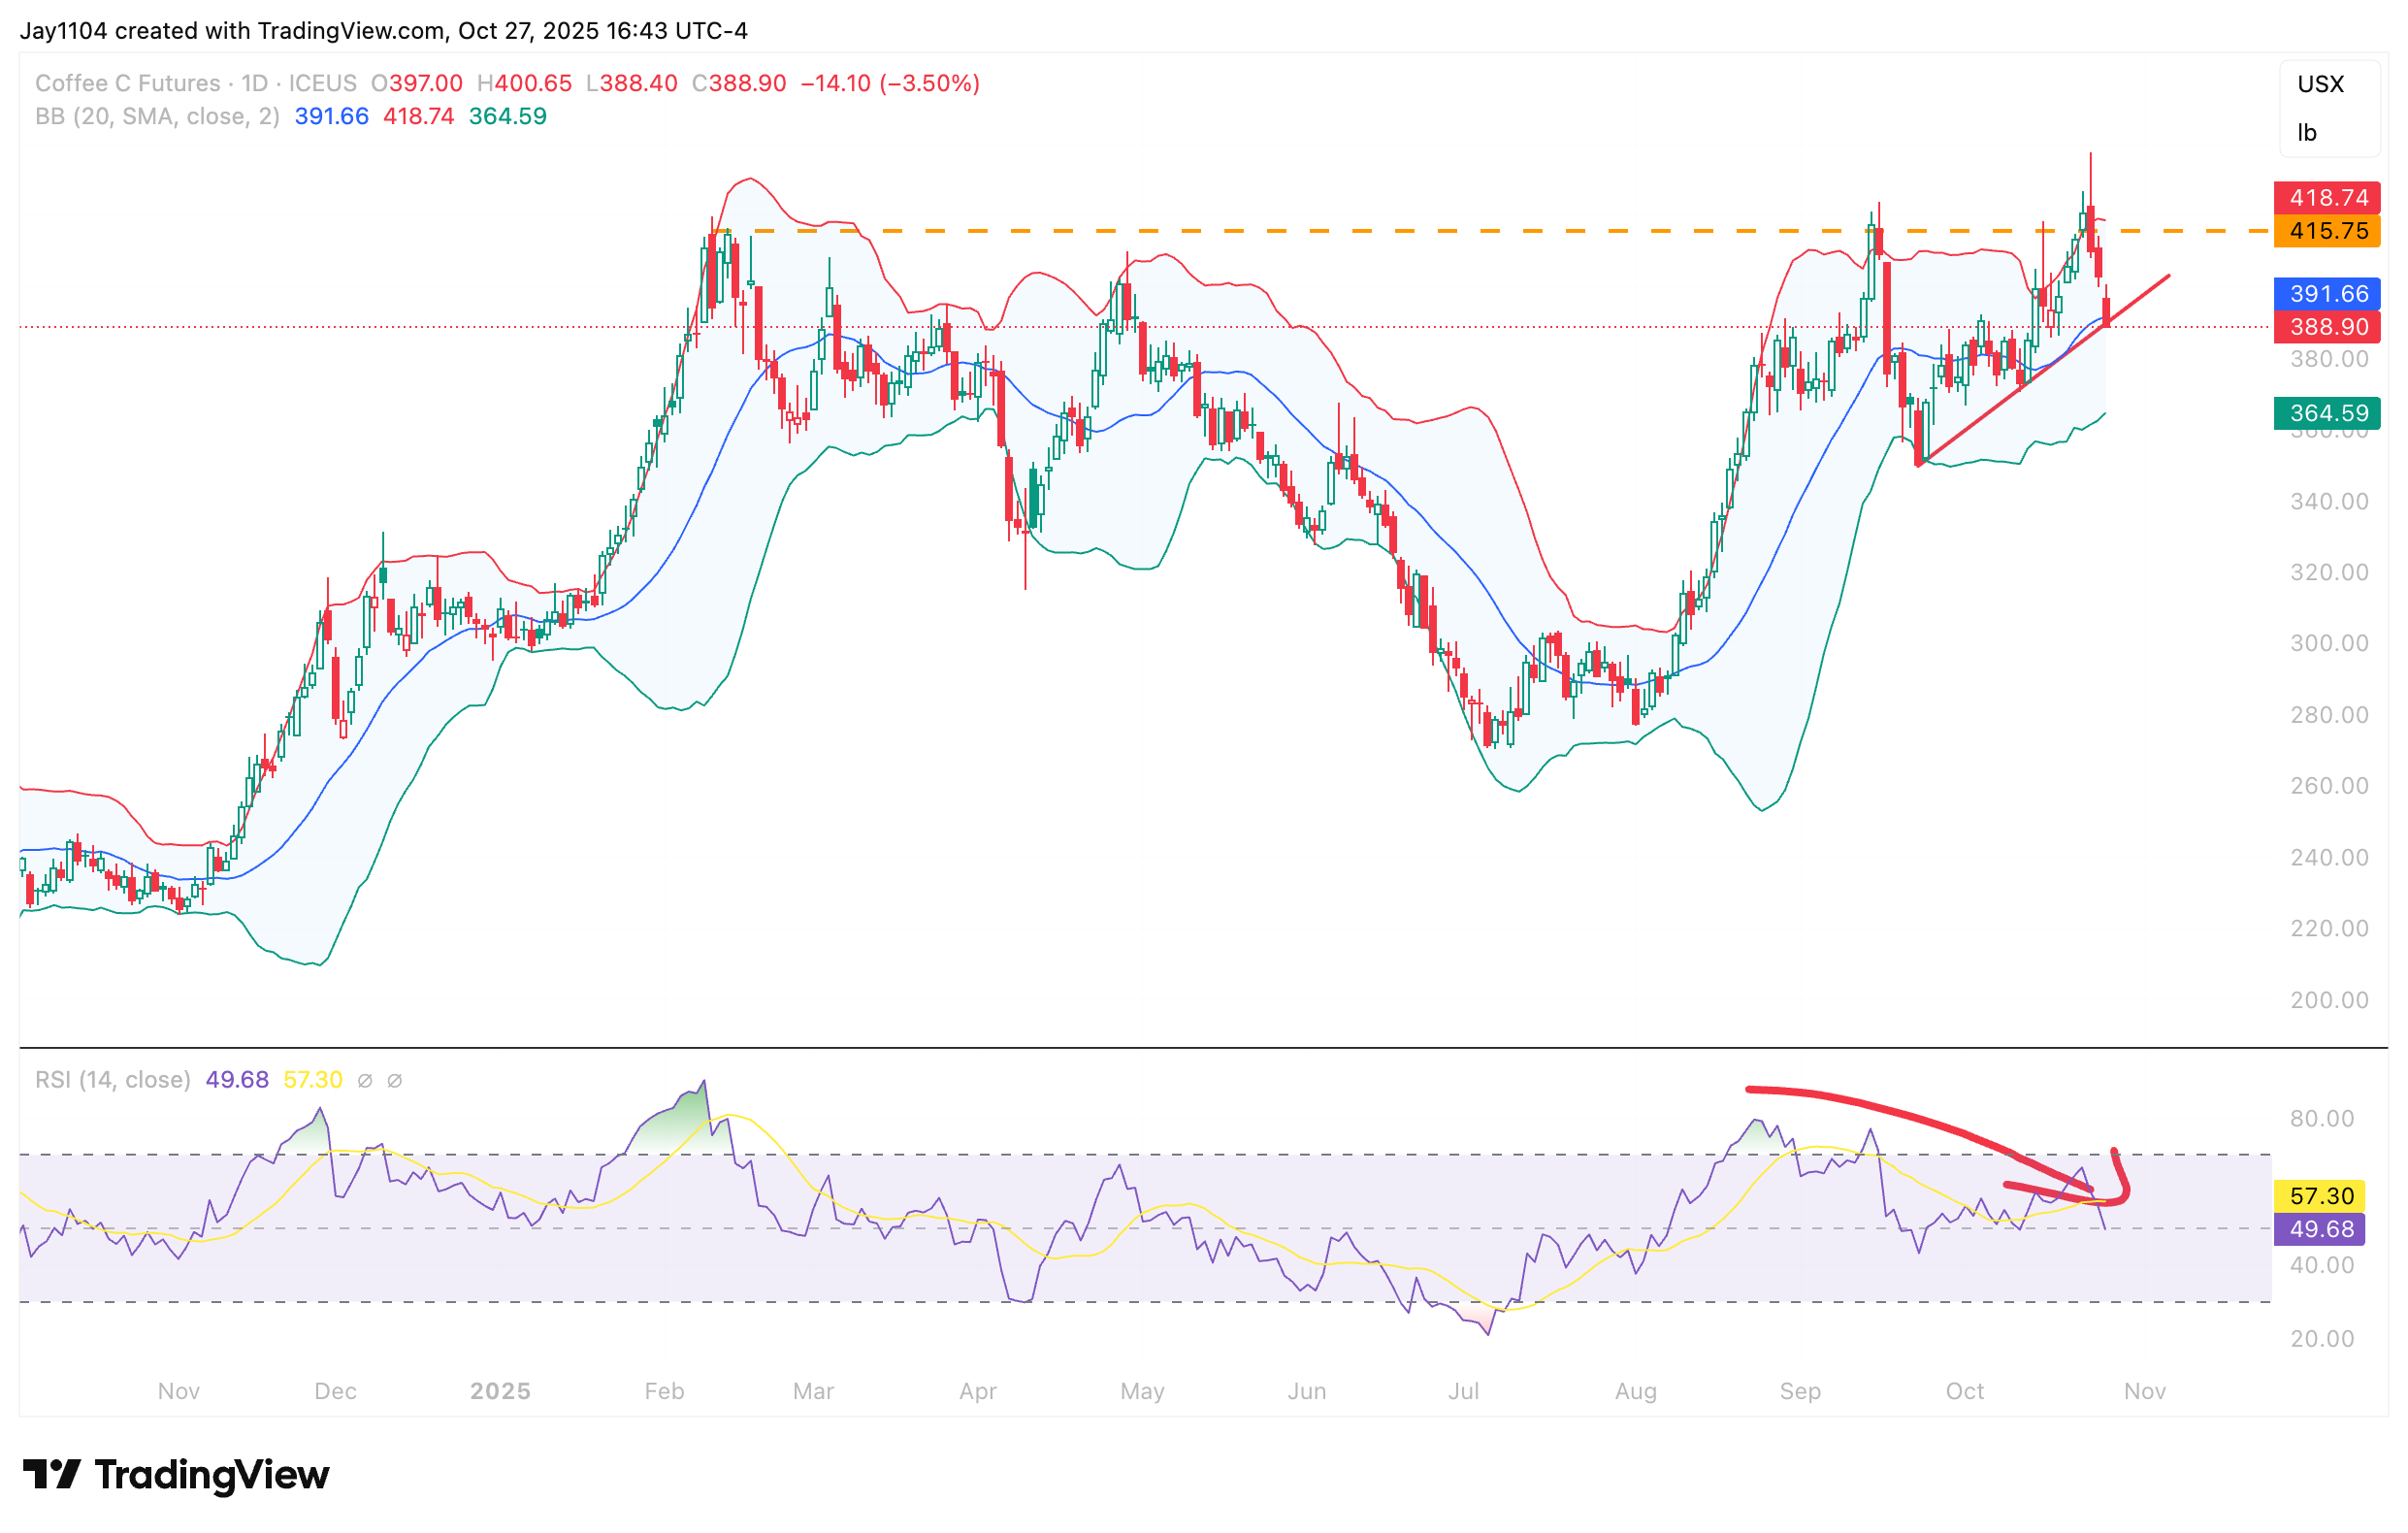
Coffee prices have surged since the beginning of August. However, more recently, they have topped out and struggled to break above $420. After reaching overbought levels and climbing above their upper Bollinger Band for the second time since early September, coffee futures are now trading back below the 20-day moving average and appear to be on the verge of breaking an uptrend that began at the start of September.
A break of this trendline and moving average could see coffee futures fall back towards the lower Bollinger Band near $365. Conversely, if prices manage to hold the 20-day moving average, a rebound towards $415 remains possible. However, judging by the Relative Strength Index, which is trending lower and showing signs of bearish divergence, it seems more likely that coffee prices will move lower before attempting another advance.
(Source: TradingView)
(Past performance is not a reliable indicator of future results)
WTI Oil
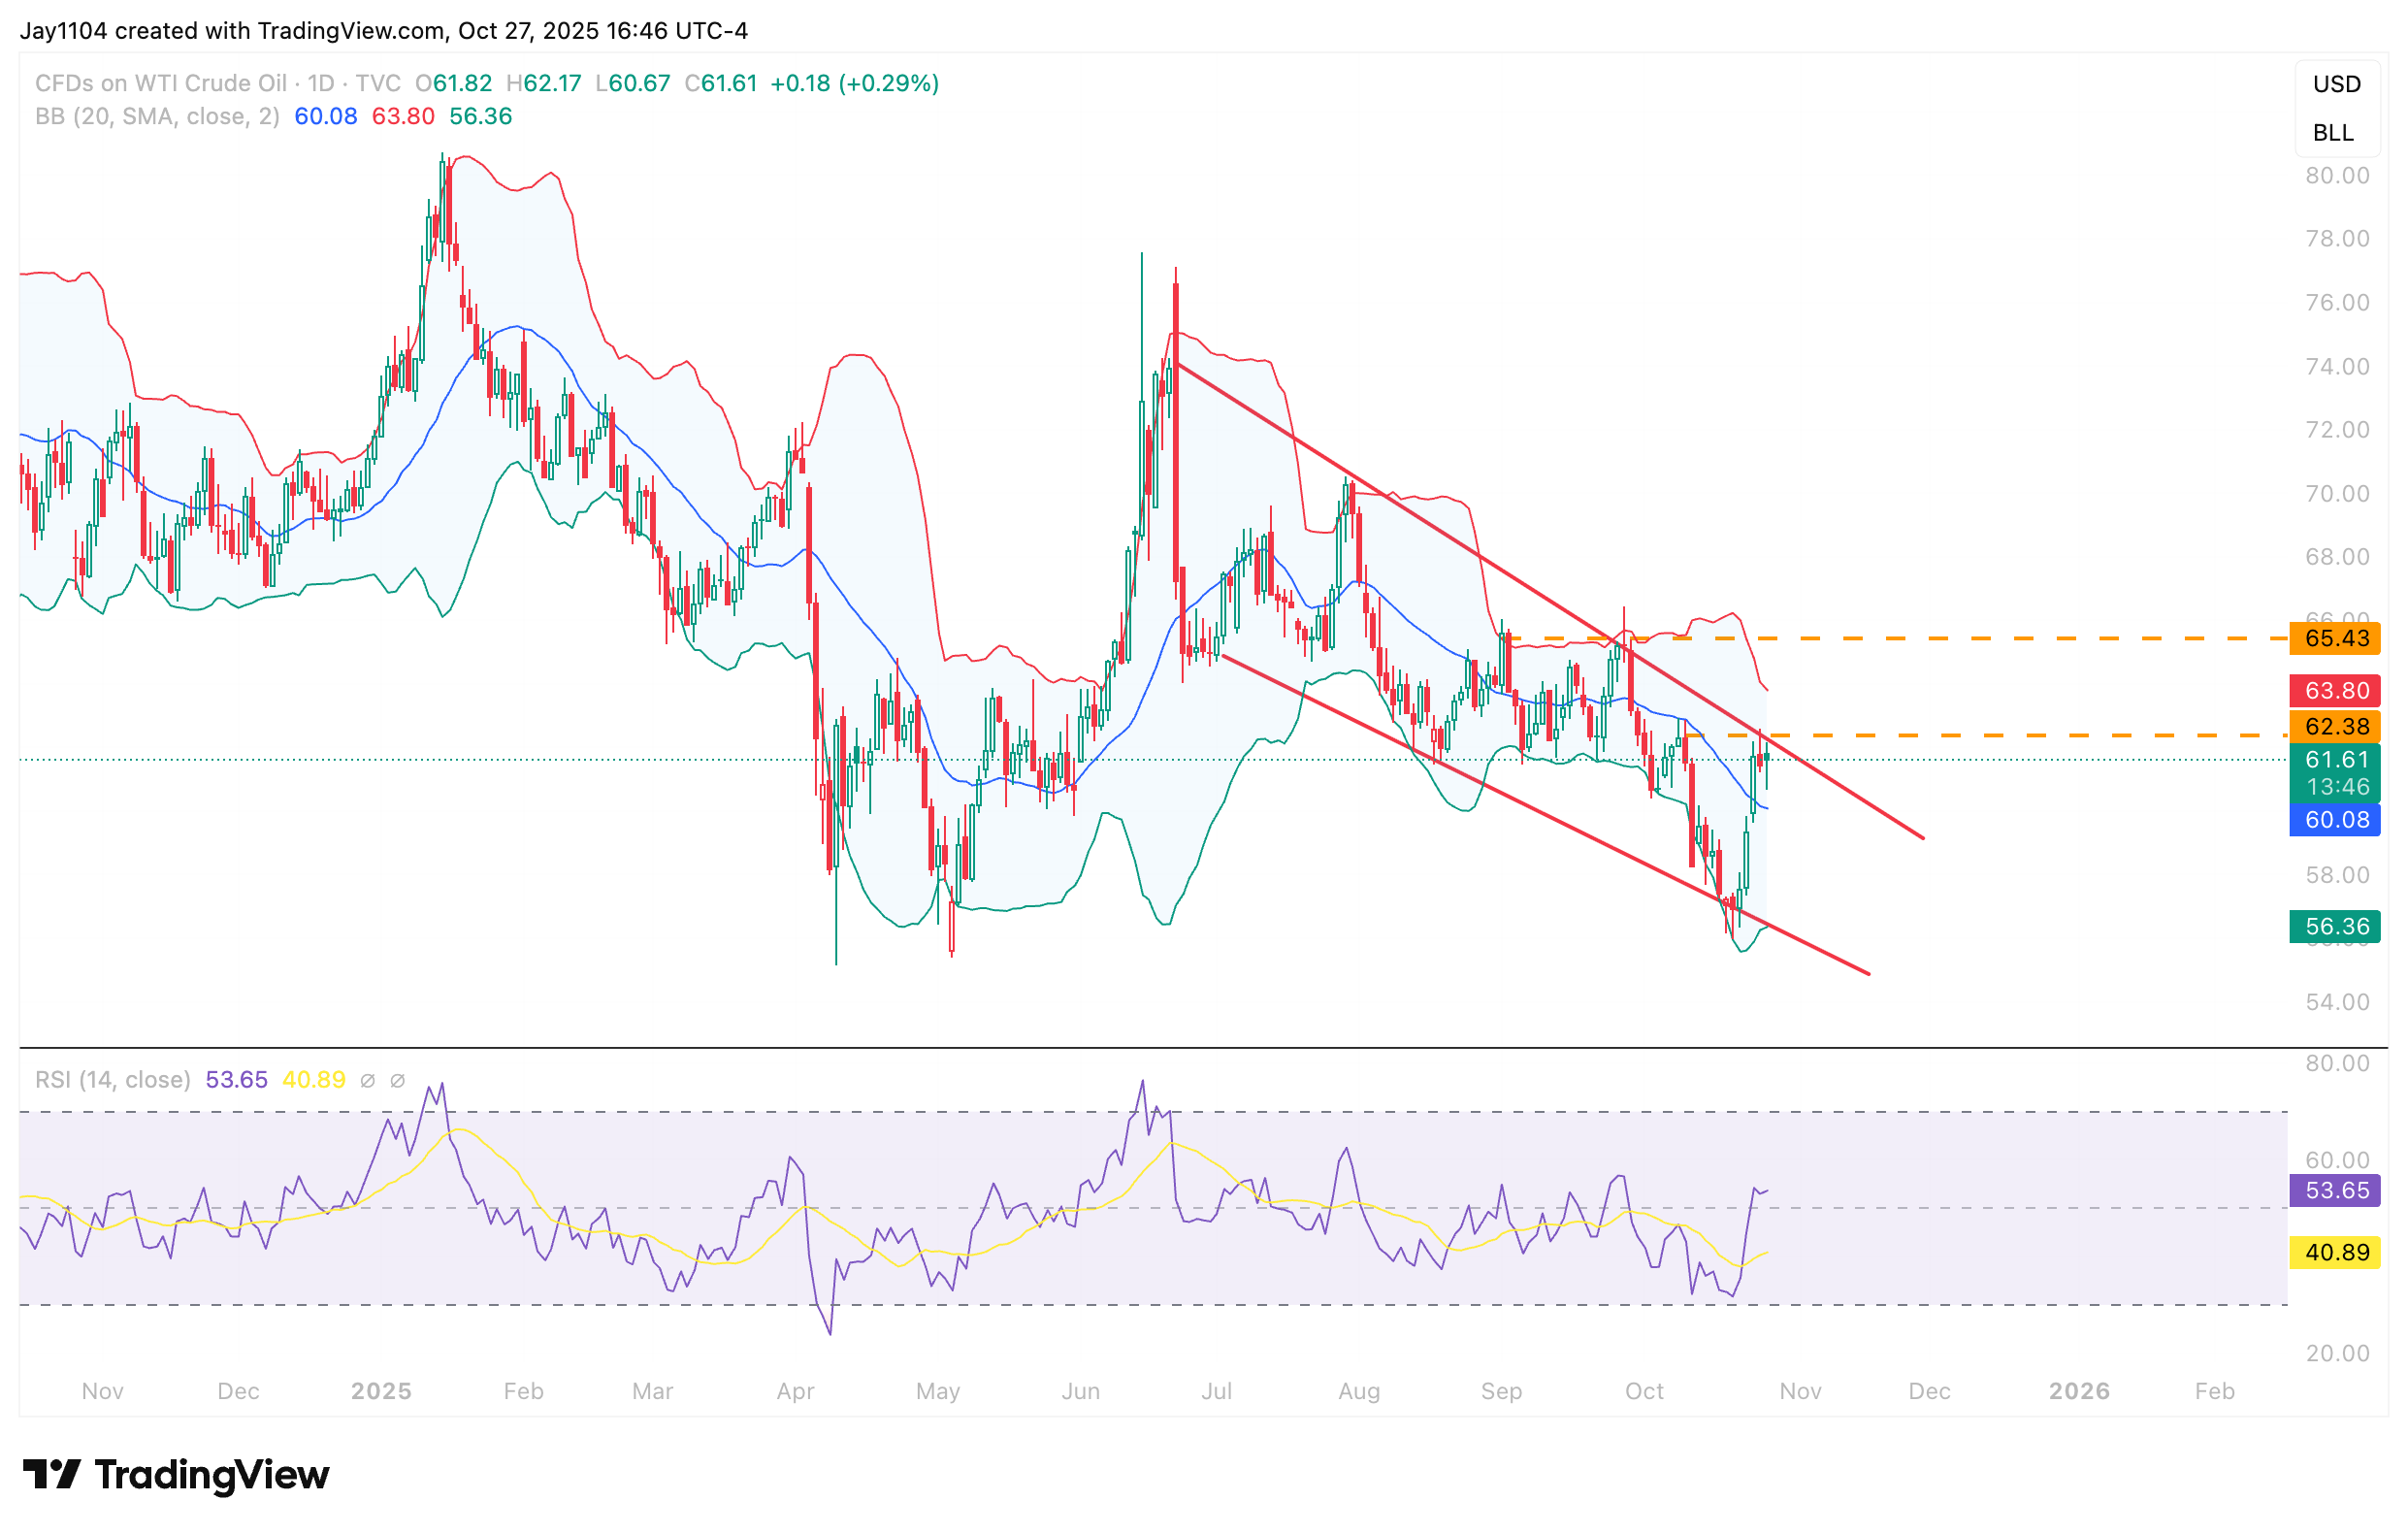
After several consecutive days of gains, WTI crude oil prices have stalled around $62.50, a key resistance level. A decisive break above this price could accelerate towards $65.50. Encouragingly, WTI has also moved above its 20-day moving average, which is a positive technical sign.
However, if prices fail to push beyond $62.50, a retracement back towards the recent lows near $56 becomes likely. That said, momentum indicators on the RSI suggest there is a strong chance oil may first advance to $65.50 before any potential pullback.
(Source: TradingView)
(Past performance is not a reliable indicator of future results)