Global equities suffer another strong pullback, but oil lead the way this time around.
Negative sentiment takes over global markets as September gets underway, with the US jobs data in focus.
US traders came back from the labour day holiday on Tuesday with a strong negative sentiment. Global equities dropped significantly in the afternoon after a relatively calm start top the European session, in what is starting to look like a repeat of August.
There doesn’t seem to be a whole lot out there to explain the intensity of the selloff, other than potentially seasonal factors. September is traditionally considered a bad month for risk appetite. Looking at how various asset classes performed, there doesn’t seem to be much else to justify the moves. With oil, gold and yields dropping alongside equites, it’s hard to justify either geopolitical concerns or safe-haven demand as the culprits of Tuesday’s selloff.
The economic calendar is also quite stale this week heading into the US jobs data on Friday which will be the key event to watch out for. Tuesday saw the ISM Manufacturing PMI data come out slightly below expectations in the US, but the reading was above the previous month, so it’s hard to see this as a key trigger of bearish sentiment.
S&P 500 & EU STOXX 600 daily charts
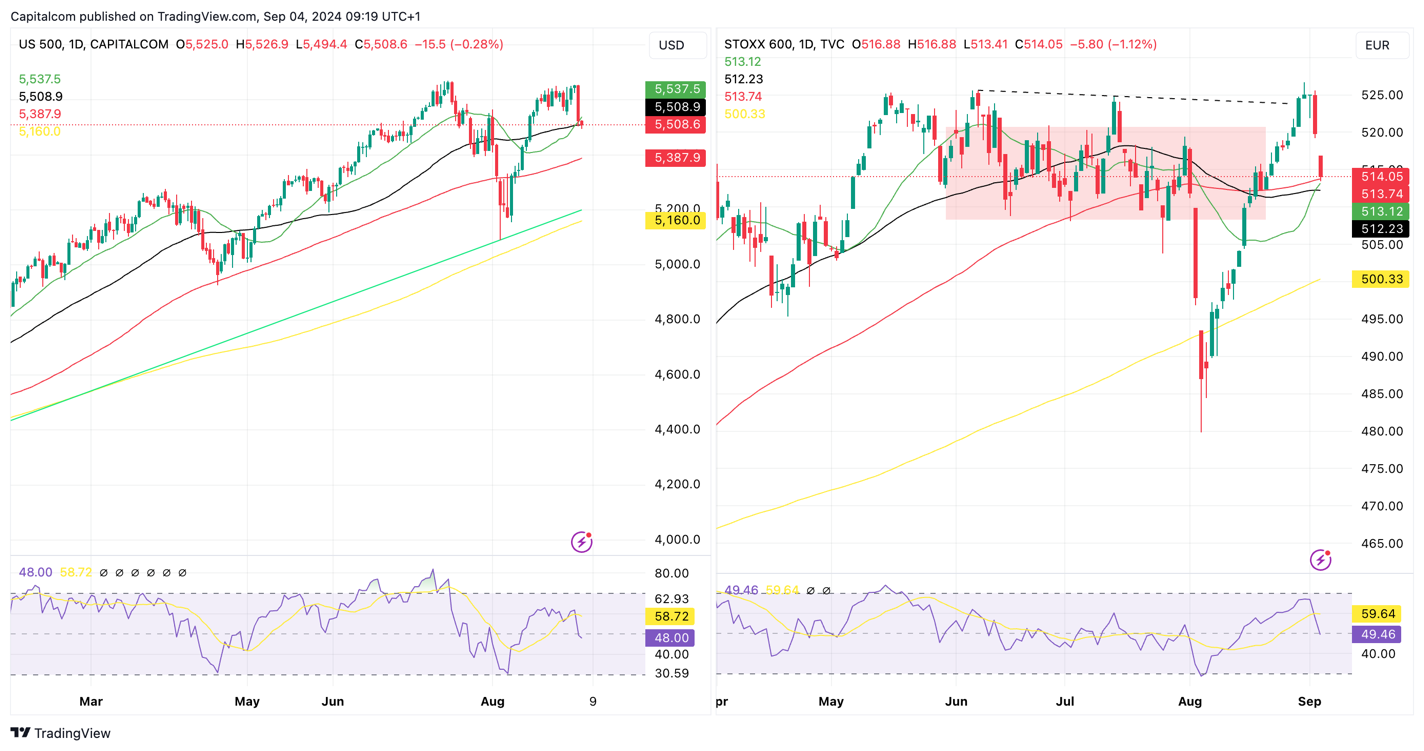
Past performance is not a reliable indicator of future results.
Looking at how the European session has kicked off in Asia and Europe we can expect further selling pressure on Wednesday as US traders come back online. Both the EU STOXX 600 and the S&P 500 are currently testing support at their respective moving averages, a key test of further appetite to move lower.
The seemingly lack of trigger in the pullback is likely to allow for sentiment to continue the path of least resistance heading, which currently seems to be lower. Thursday will see the ISM non-manufacturing PMIs as well as the ADP employment data, and whilst it is often not the best predictor of what the official jobs data will report on Friday, we could see some momentum stemming from the release.
Meanwhile, oil prices saw their worst performance since October last year, with US crude erasing the 2024 gains, dropping to a 9-month low. Ongoing geopolitical concerns haven’t been able to stop the negative sentiment that took over risk-appetite on Tuesday. Concerns about global oil demand seem to have aided the selloff. It is also likely that expectations for OPEC+ production cuts to end over the coming months continue to weigh on sentiment as a global economic slowdown takes place. Meanwhile, Iraq, the largest overproducer within OPEC+, continues to increase its output, .
US crude (WTI) daily chart
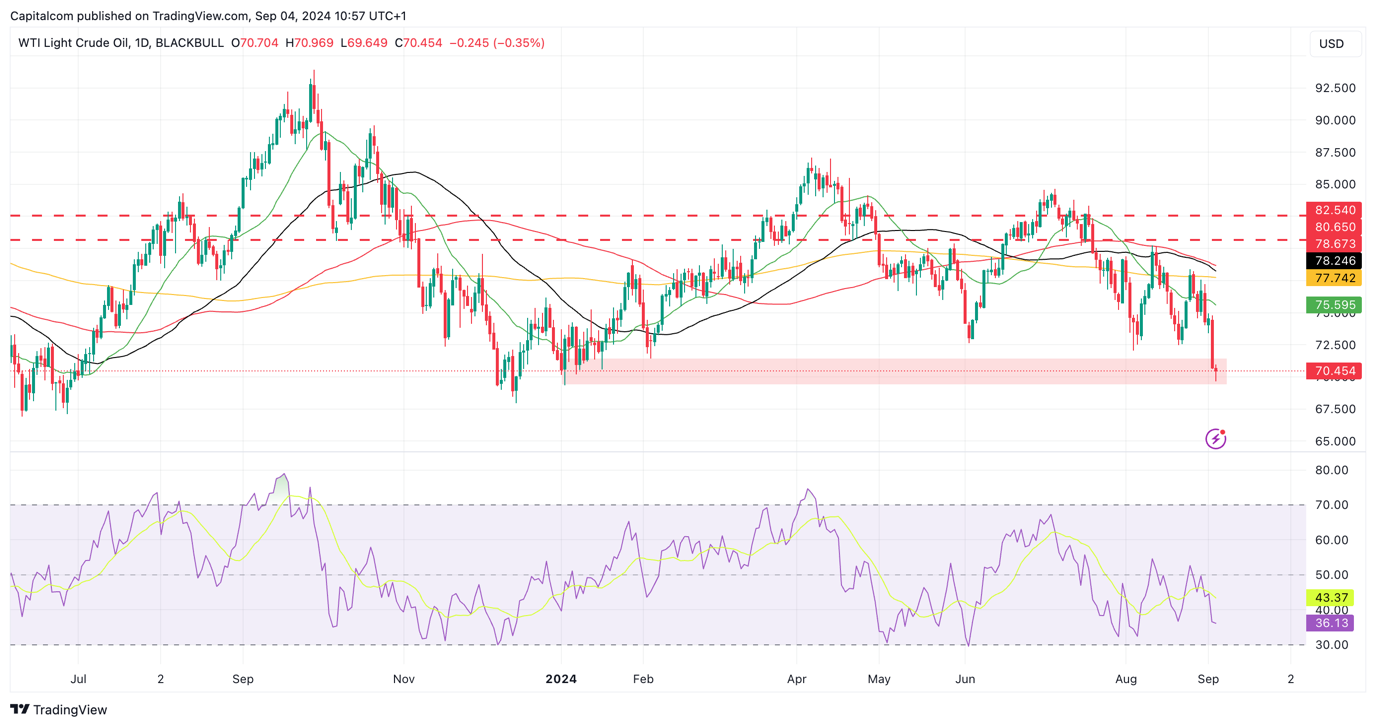
Past performance is not a reliable indicator of future results.
US crude (WTI) has entered a key support range between $69.40 and $71.40 which has already helped to minimise some of the pullback on Wednesday. Current price has pulled away from the daily lows and is hovering just above the $70 mark but the technical point towards further downside pressure if the bearish appetite cannot be contained above $69.50.