Equities Edge Up but Volatility and Rates Signal Uneasy Stability
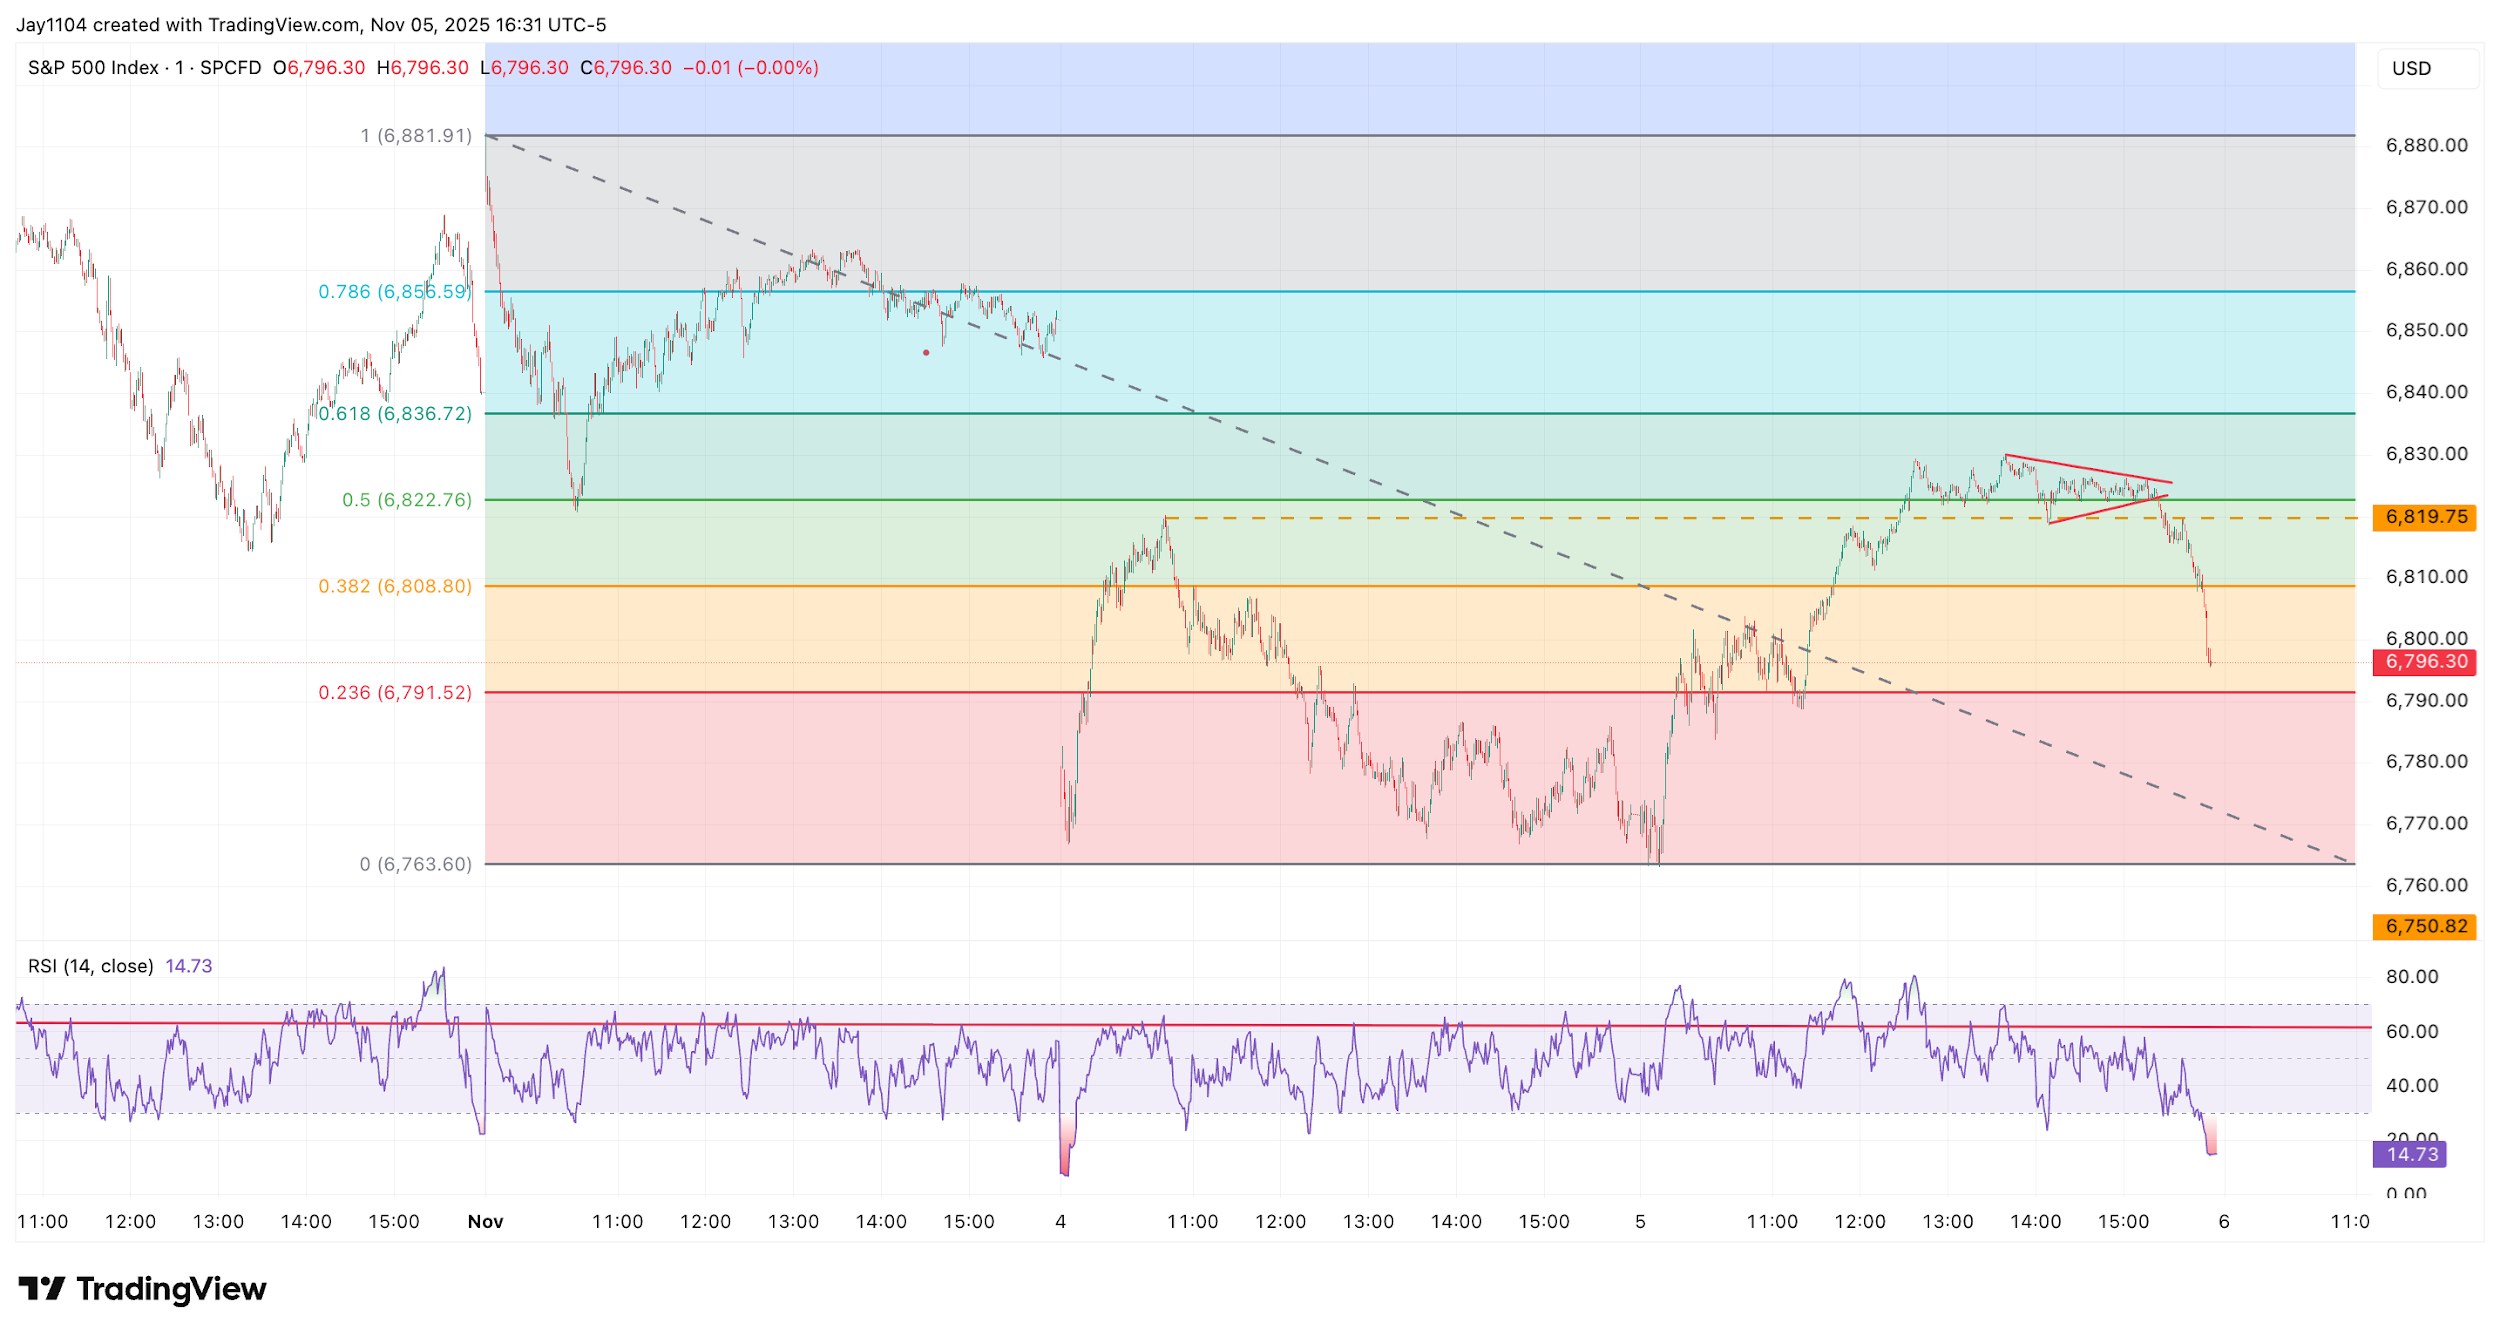
Stocks recovered on 5 November, with the S&P 500 rising by about 40 basis points. The increase partly offset some of the losses from 4 November, although not all declines were regained.
At its peak, the index was up around 80 bps, but then gave back most of these gains in the final 45 minutes.

Currently, it appears the index has rebounded to the 50% Fibonacci retracement level since the gap opening on Monday, 3 November, which acted as resistance.
(Source: TradingView)
(Past performance is not a reliable indicator of future results)
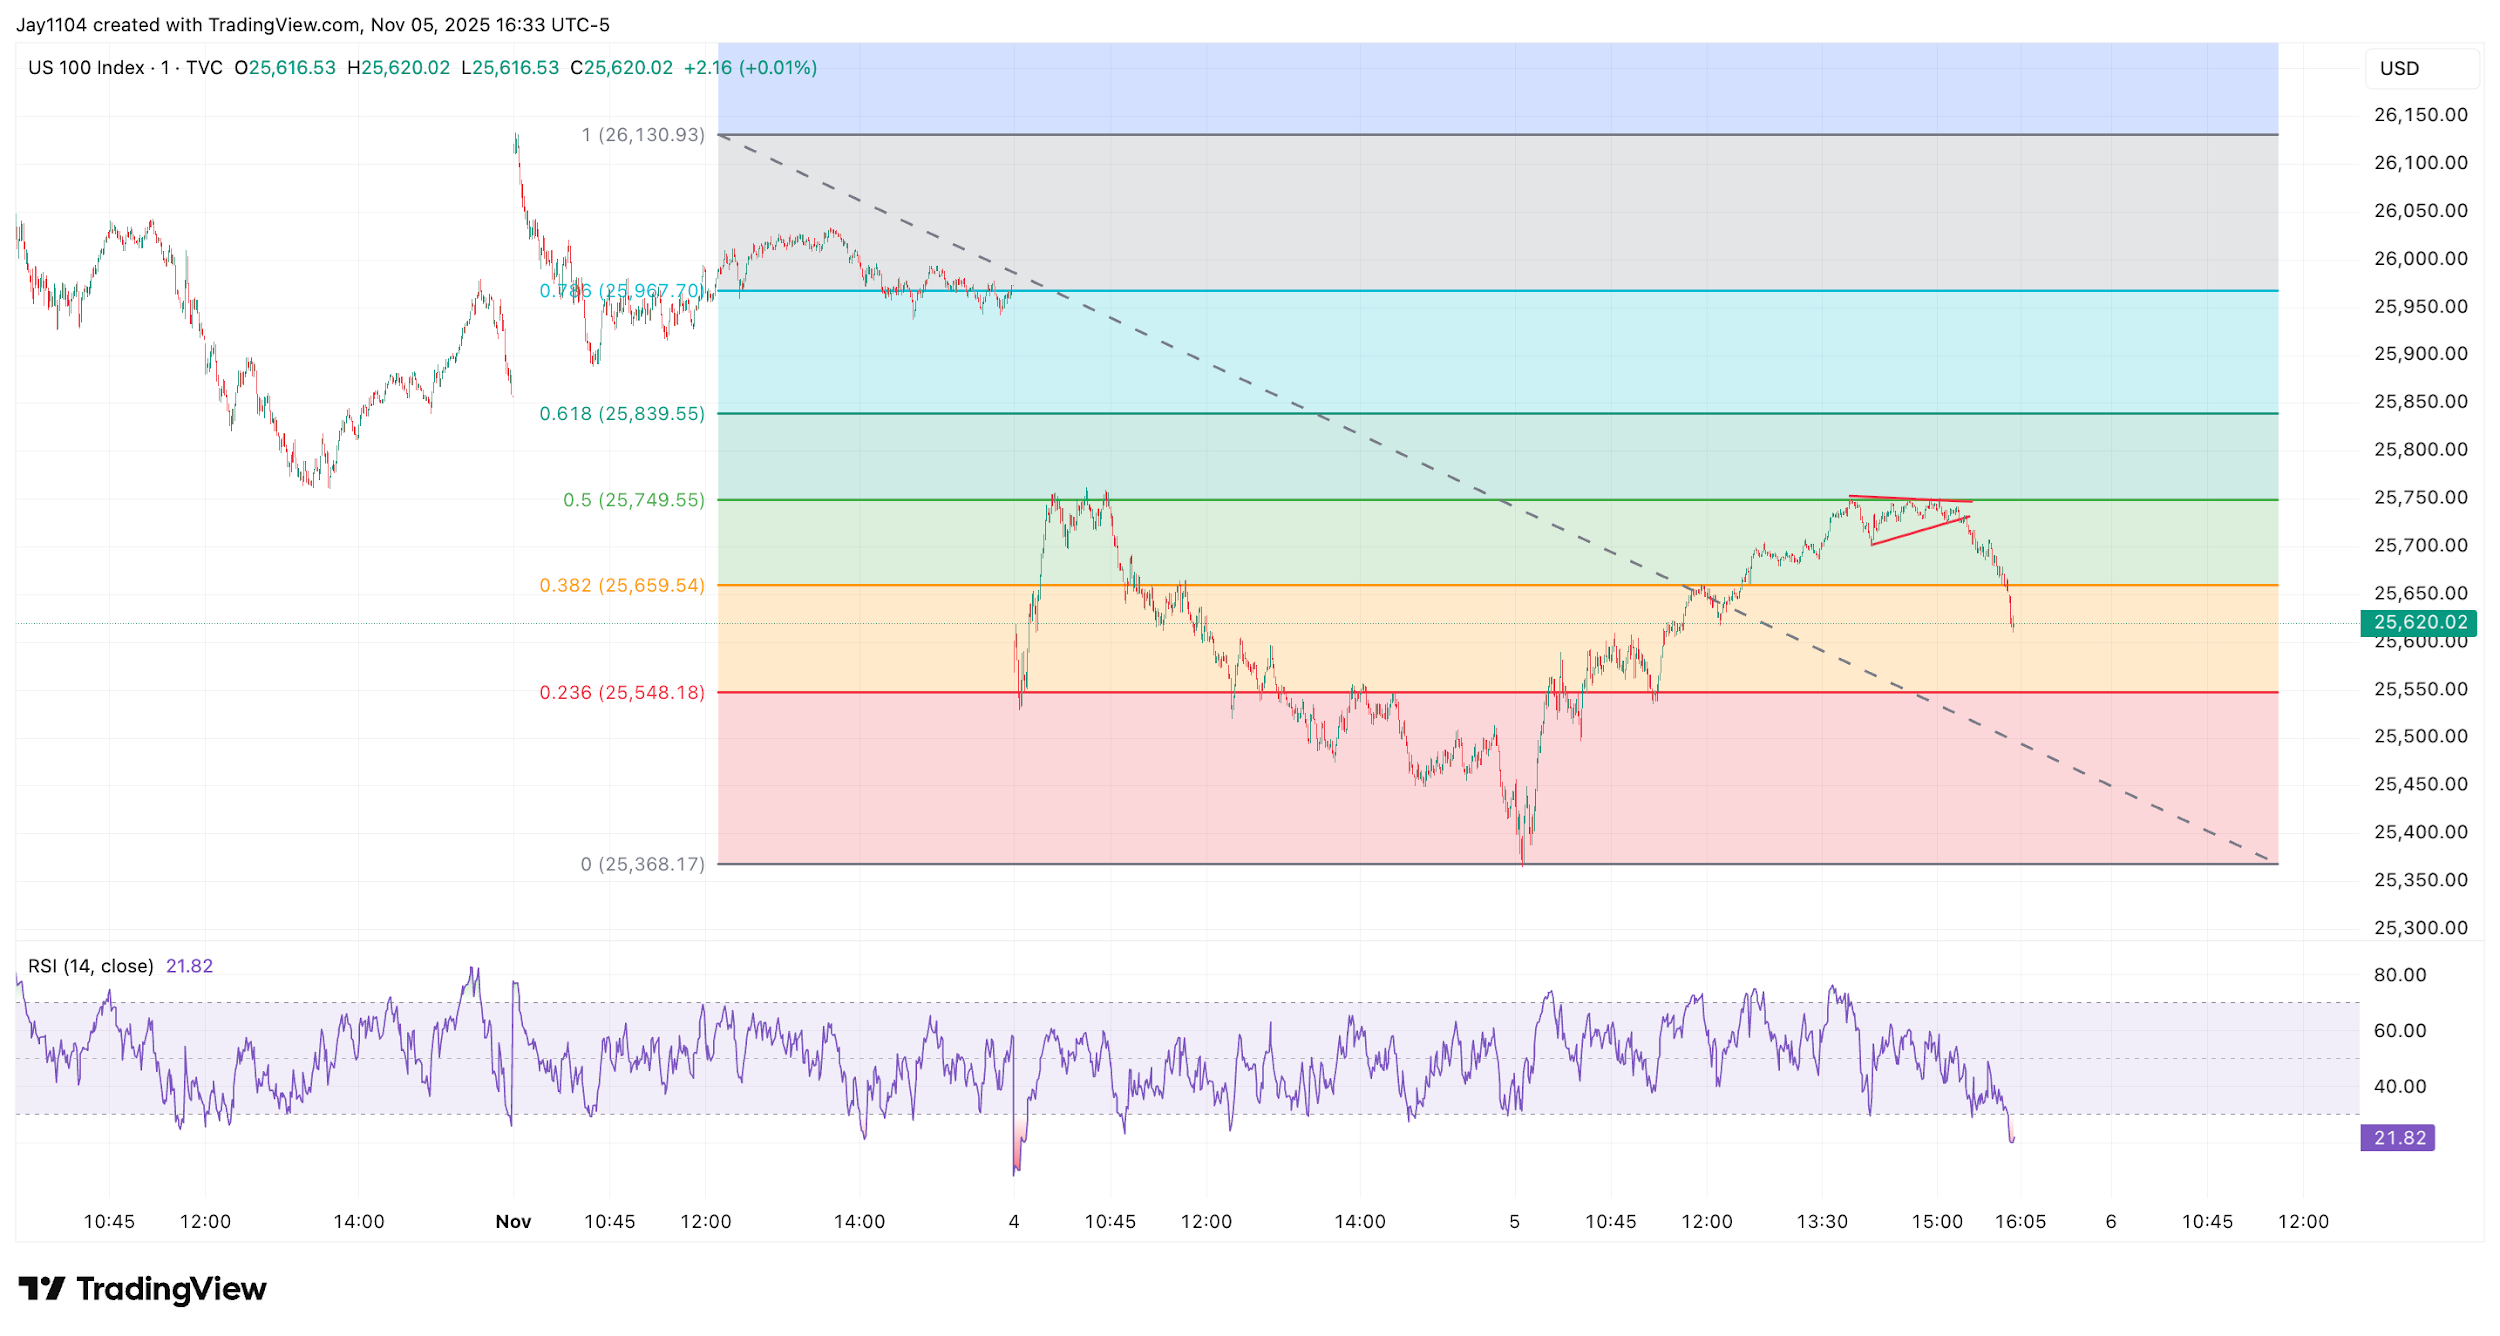
The NASDAQ-100 rose by more than 70 basis points, but, like the S&P 500, it had been higher by over 1% and was recovering about half of the losses it had experienced since gapping higher on Monday morning, 3 November. Additionally, the NASDAQ-100 failed to surpass the 50% Fibonacci retracement level at 25,750 on 4 November, which seems to be acting as a resistance level. This suggests that the recent rally might be merely a rebound within a broader downtrend that appears to be developing.
(Source: TradingView)
(Past performance is not a reliable indicator of future results)
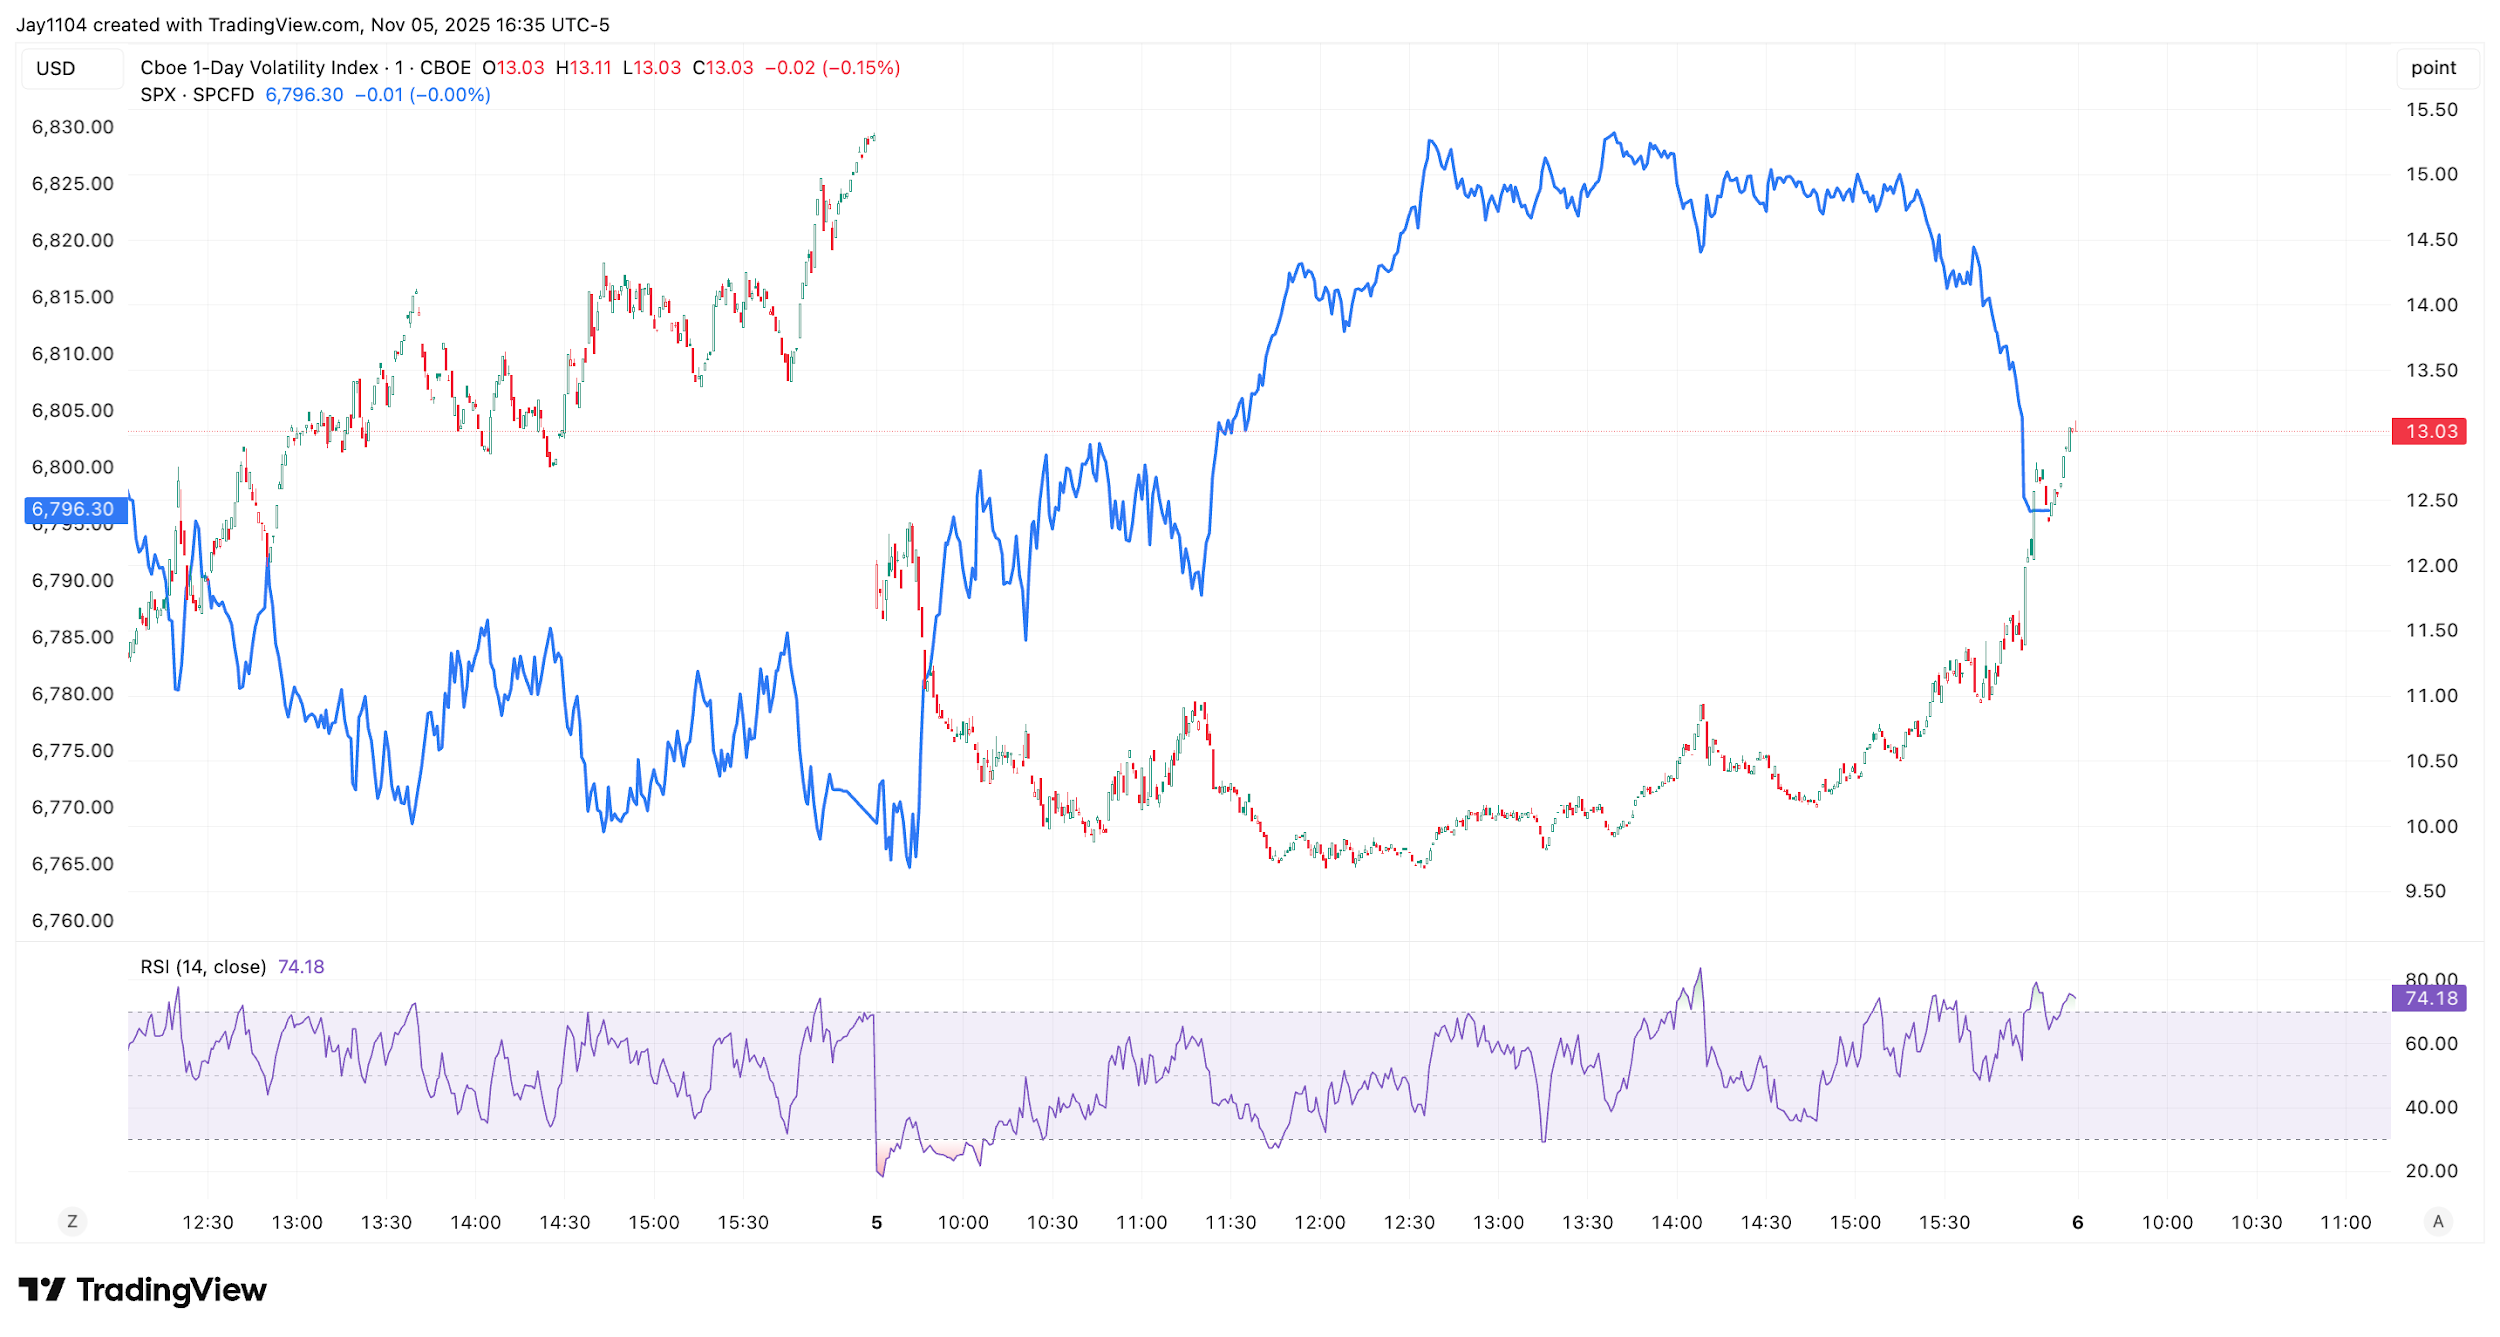
On the surface, the advance observed on 5 November appears mainly due to implied volatility levels falling from their elevated levels on 4 November, as indicated by the VIX 1-Day, which was around 15.5. The volatility index quickly decreased at the start of 5 November, and as it fell, it helped boost the S&P 500. This was notable because once implied volatility reset, with the VIX 1-Day settling around 10, the S&P 500’s rally stalled, and as the VIX 1-Day rose sharply into the end of the trading session, the S&P 500 fell. This indicates that much of the day’s price movement may have been influenced by options-related activity.
(Source: TradingView)
(Past performance is not a reliable indicator of future results)
Should the rebound on 5 November have been indeed driven solely by the resetting of implied volatility, it is possible that on Thursday, 6 November, selling will resume, potentially undercutting the lows of the 4th and breaking below 6,750 on the S&P 500. However, if the buying seen on Wednesday proves to be genuine, it is likely that the gaps created by the drop at the open on 4 November will be filled, with the S&P 500 resuming its move towards 6,850 and the NASDAQ-100 potentially rising back to around 25,975.
10-Year Rates Surge
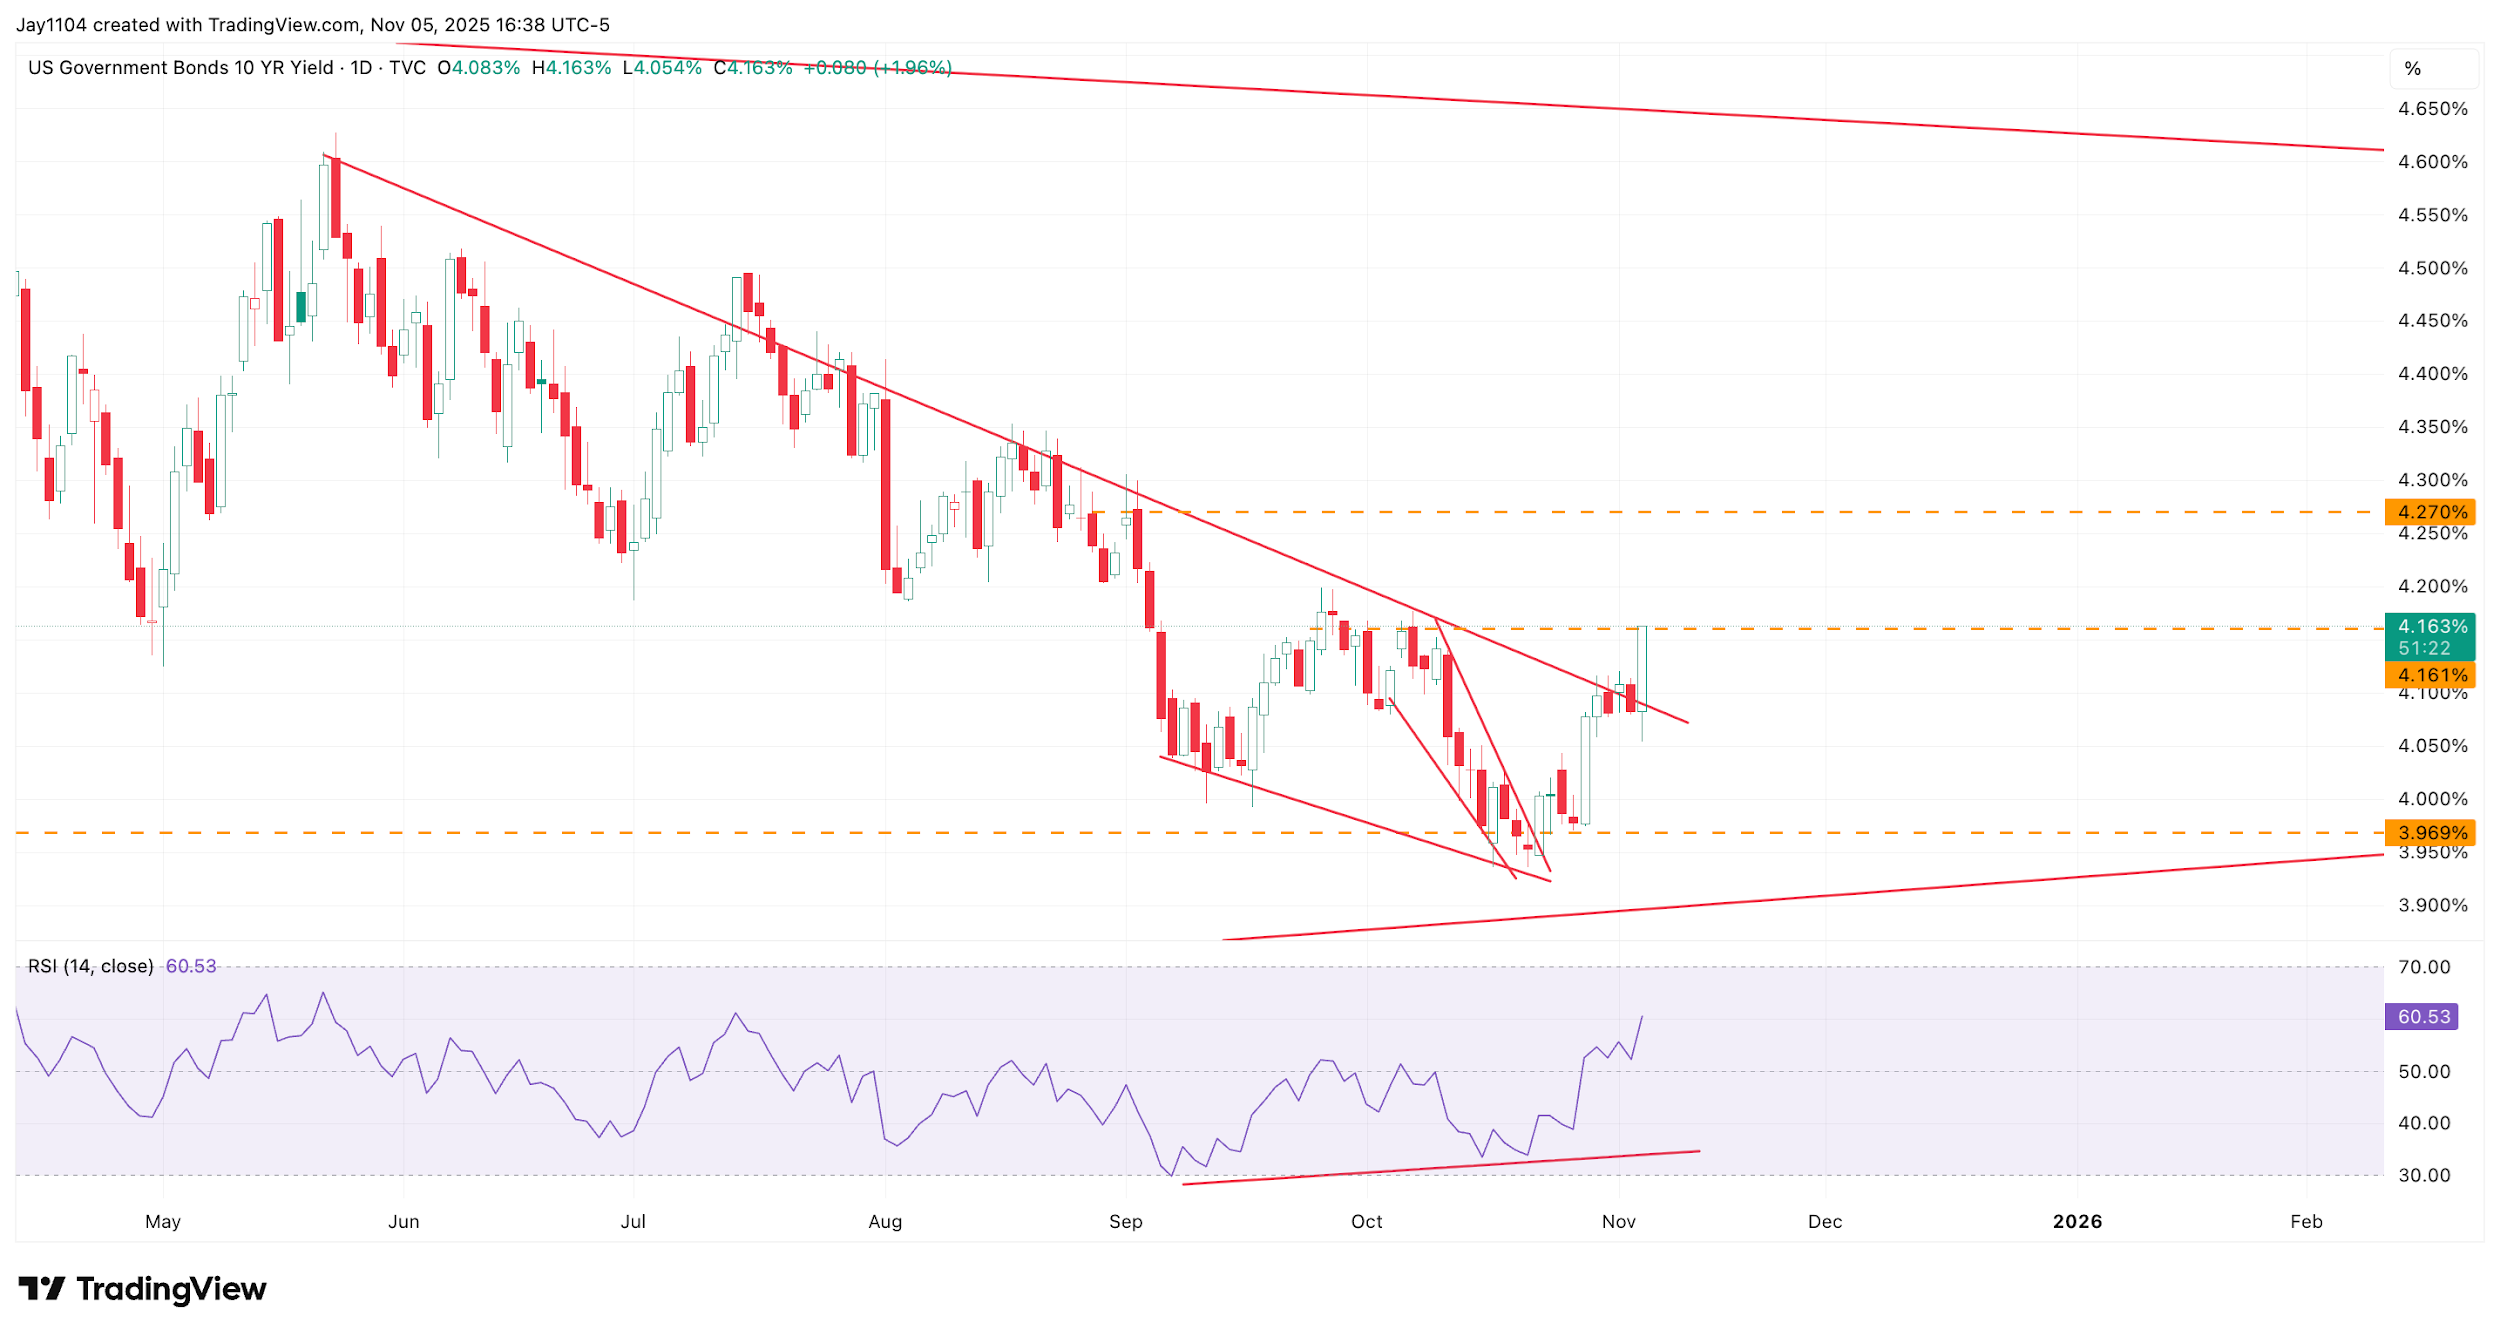
Furthermore, interest rates surged sharply after stronger-than-expected ADP employment figures and a robust ISM services report, which also suggested that inflation is not easing as much as expected. This drove the 10-year yield up by nearly 8 basis points to 4.16%. The 4.16% mark has been a key resistance level since mid-October. A breakout above this level is likely to push the 10-year yield towards 4.30%.
Moreover, the RSI is trending higher and has formed a bullish divergence—making higher lows while the yield itself made a lower low—which suggests that the 10-year yield may be poised to move sharply higher. This would run counter to the prevailing view among many market participants who have been positioning for lower interest rates due to further Fed rate cuts on expectations of a weakening labour market, a view challenged by today’s stronger data.
(Source: TradingView)
(Past performance is not a reliable indicator of future results)
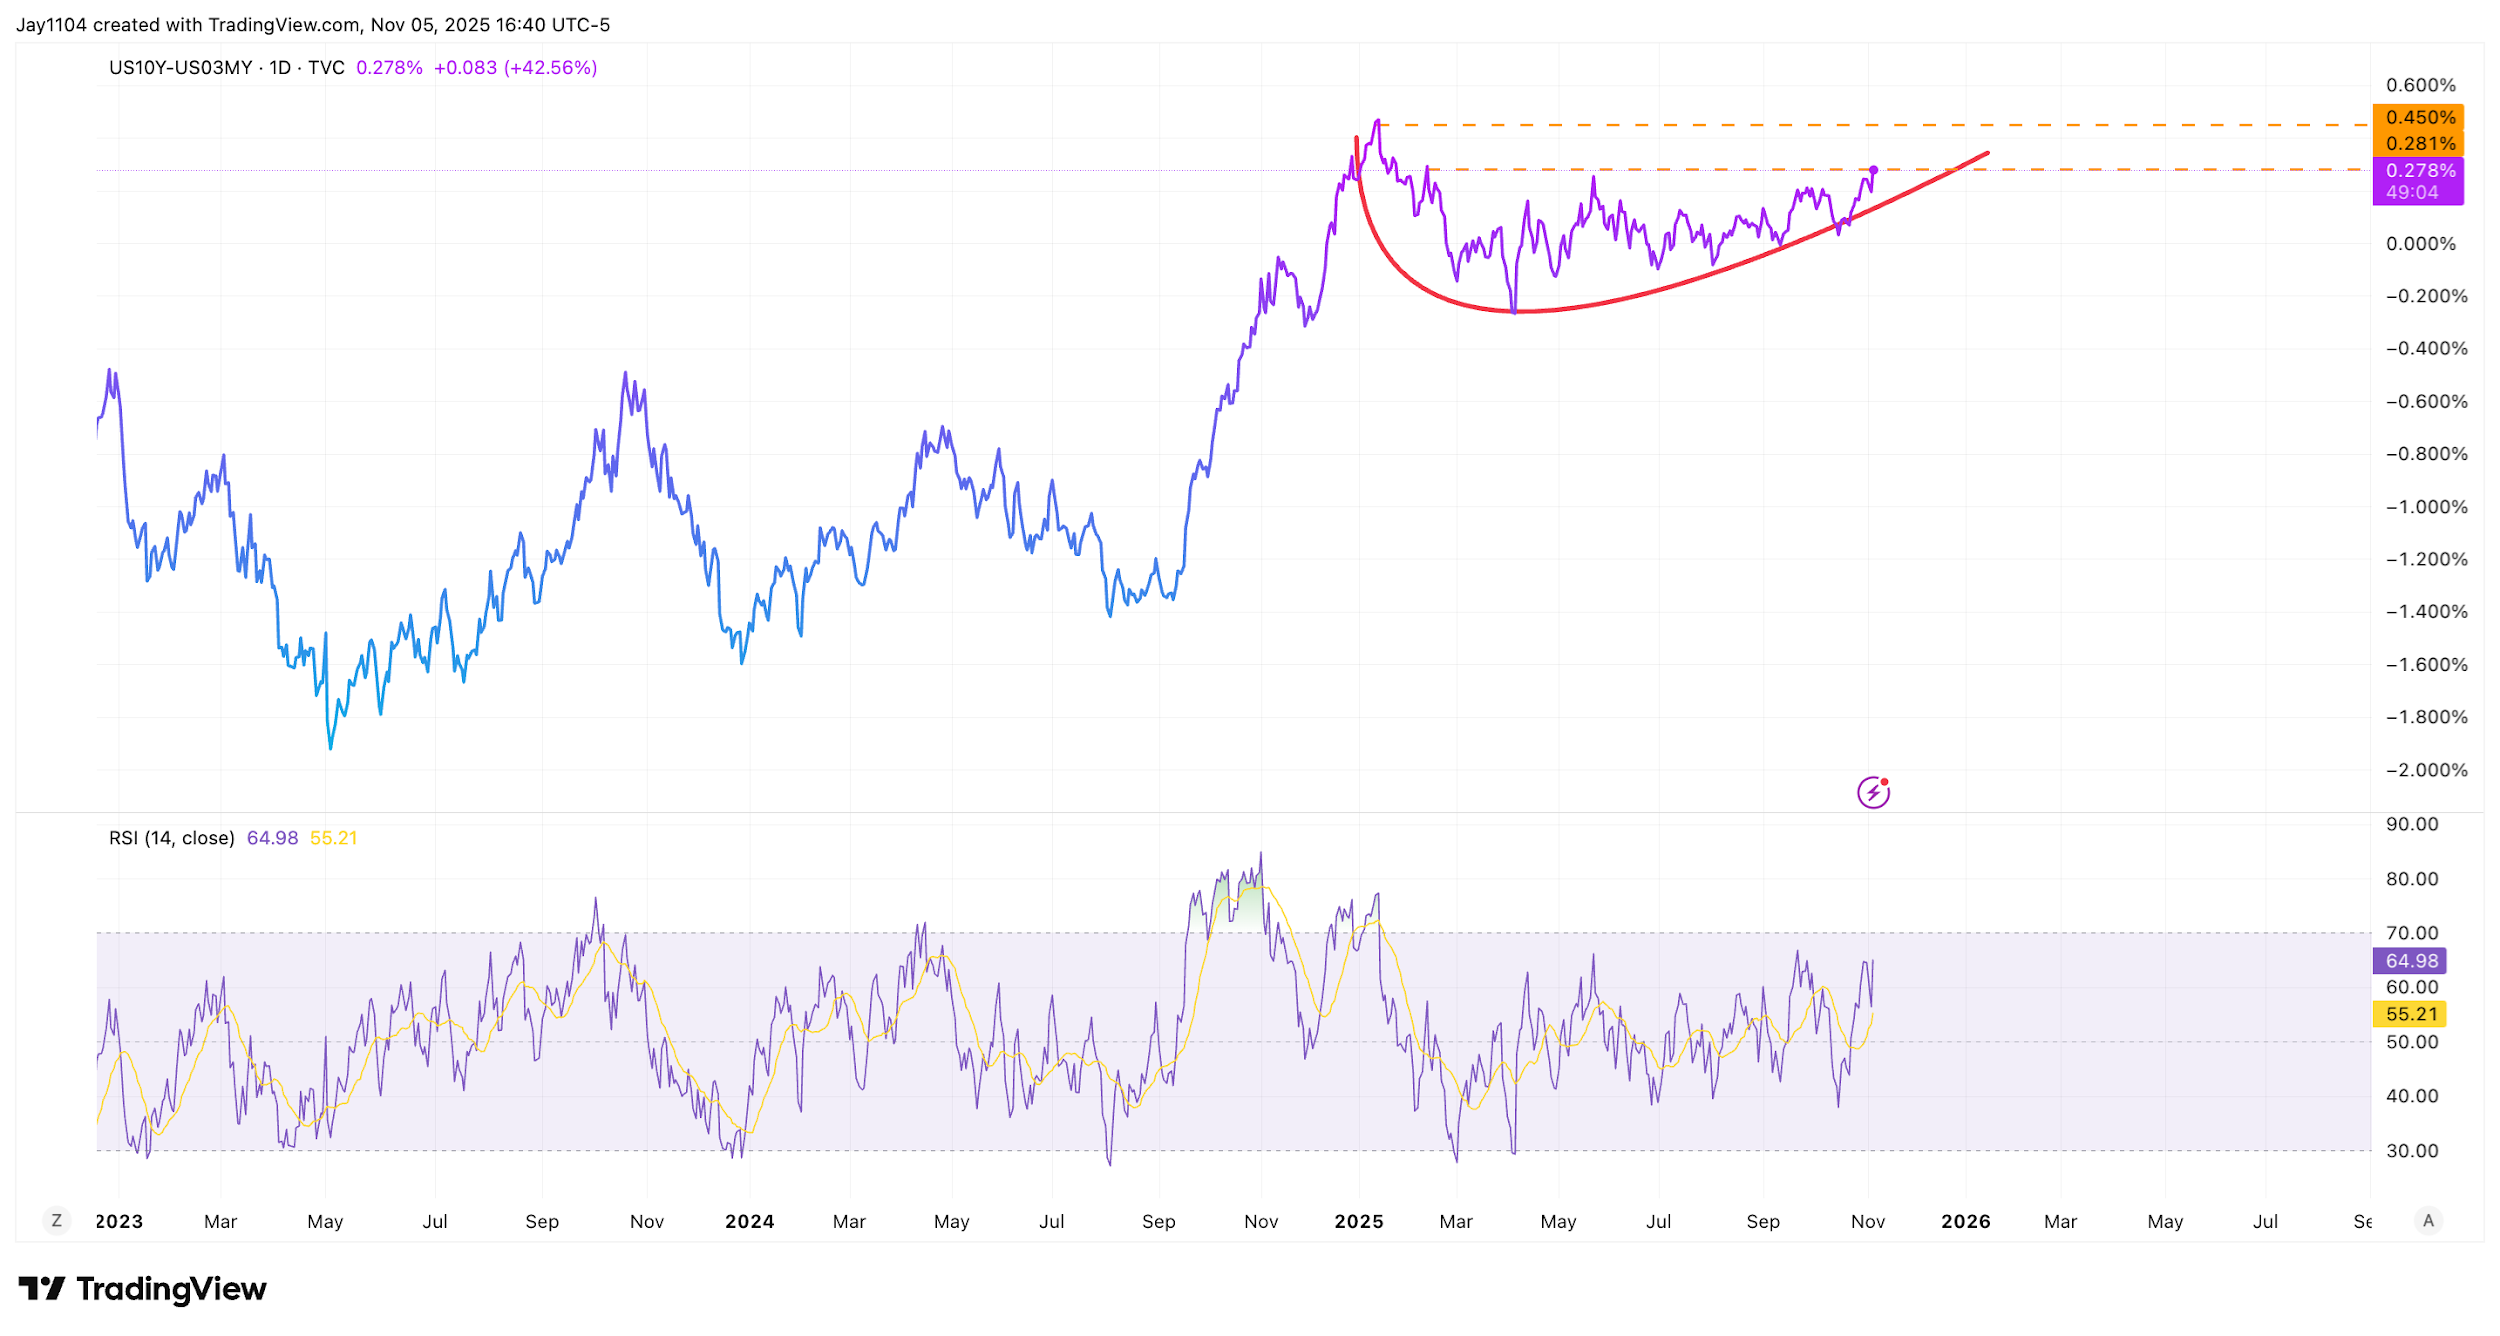
This led the spread between the 10-year and 3-month Treasury yields to widen by almost 8 basis points on the day, pushing it up to around 28 basis points — a level not seen since mid-February. This may suggest that the curve is beginning to break out and could move back towards 45 basis points, a level last reached in mid-January.
Such a move would imply that the yield curve may steepen more meaningfully. With Fed rate cuts likely to keep the front end of the curve well anchored at lower levels, while economic strength, persistent inflationary pressures, and increased Treasury issuance lift the long end, the curve could continue to normalise towards a historically steeper shape, through a bear steepening.
(Source: TradingView)
(Past performance is not a reliable indicator of future results)