Citigroup stock forecast: Third-party price targets
Citigroup (ticker: C) was trading at $93.68 early Monday 13th October in European hours, marking the session low after easing from an intraday high of $97.48.
The stock finished close to the day’s lows amid broader weakness across the banking sector, with major U.S. banks down around 6% over the past month ahead of the third-quarter earnings season (Morningstar, 13 October 2025).
Trading volumes have stayed elevated across the banking sector as markets position ahead of quarterly results. Investment banking activity is expected to offer some support, following a summer rebound in mergers and acquisitions that lifted fee income. The backdrop includes a stronger U.S. Dollar Index, trading near 99.25 (Trading Economics, 12 October 2025), and recent comments from Federal Reserve officials signalling room for further rate cuts. The central bank lowered its benchmark rate by 25 basis points to a 4%–4.25% range in September (U.S. Federal Reserve, 17 September 2025).
Citigroup stock forecast: Analyst price target view
Evercore ISI (in line rating)
Evercore ISI maintains a price target of $87 for Citigroup on 30 September 2025, reflecting a cautious stance on near-term execution risks. The firm highlights regulatory challenges and transformation costs as ongoing headwinds amid continuing restructuring efforts (TipRanks, 13 October 2025).
UBS (hold rating)
UBS maintains a $100 price target on 7 October 2025, expressing caution over profitability timelines. The Swiss bank flags concerns about Banamex’s performance and slower-than-expected returns from the group’s strategic transformation (The Globe and Mail, 8 October 2025).
Wells Fargo (overweight rating)
Wells Fargo raised its price target to $125 from $115 on 16 September 2025, reflecting greater confidence in the benefits of ongoing restructuring. Analyst Mike Mayo noted stronger growth potential and improved market positioning as key factors behind the revision (GuruFocus, 16 September 2025).
Morgan Stanley (overweight rating)
Morgan Stanley lifted its target to $129 from $107 on 29 September 2025, citing a more positive outlook on transformation progress. The firm expects steady revenue growth as the interest rate environment stabilises and deal activity improves across investment banking (MarketScreener, 29 September 2025).
Forecasts and projections are not reliable indicators of future performance. Market conditions can change unexpectedly, and past performance should not be viewed as a guide to future results.
C stock price: Technical overview
Citigroup was trading at $93.68 as of 2:12pm UTC on 13 October 2025 on 13 October 2025, remaining below its key moving average cluster, with the 20-, 50-, 100-, and 200-day SMAs positioned near $100, $97, $90 and $82 respectively. The stock sits beneath shorter-term averages but above longer-term supports, creating a neutral technical setup.
Momentum has stayed moderate, with the 14-day RSI at 33.4, indicating neither overbought nor oversold conditions. The Average Directional Index (ADX) at 17.0 points to a weak trend, while momentum oscillators present mixed signals, including short-term sell indications.
The first resistance area to monitor on any recovery lies near the Classic pivot at $100.02, followed by the next resistance zone around $107.07, which could come into view after a sustained daily close above that level. A break through the pivot would place the stock back above its 20-day moving average and could reopen scope toward the $112.65 region.
On pullbacks, initial support appears near $94.44, with the 100-day SMA around $90.28 acting as the main technical floor. A move below this longer-term average could extend declines toward the $87.39 support zone and potentially retest the 200-day SMA near $81.65 (TradingView, 13 October 2025).
This analysis is provided for informational purposes only and does not constitute financial advice or a recommendation to buy or sell any instrument.
Citigroup share price history
Citigroup emerged as a leading financial services group following the 1998 merger between Citicorp and Travelers Group, forming what was then one of the world’s largest financial institutions.
The stock reached a two-year high of $105.59 on 23 September 2025, marking a notable recovery from pandemic-era lows. However, through late 2023 and early 2024, Citi’s shares faced pressure from regulatory developments and transformation costs. The stock opened 2024 near $53.71, gradually advancing through the first quarter before briefly falling to $55.99 on 9 April, amid wider banking-sector uncertainty.
Further gains followed during the summer as confidence in CEO Jane Fraser’s restructuring programme improved, with shares rising beyond $70 by late 2024. The upward momentum continued into 2025, supported by clearer regulatory conditions and ongoing cost-efficiency progress, before recent softness saw prices pull back from the September highs.
Citigroup last closed at $93.68 on 10 October 2025, representing around 33.2% growth year to date and a 78.8% increase year on year from October 2023 levels.
Past performance is not a reliable indicator of future results. Share prices are indicative and may differ from live market prices.
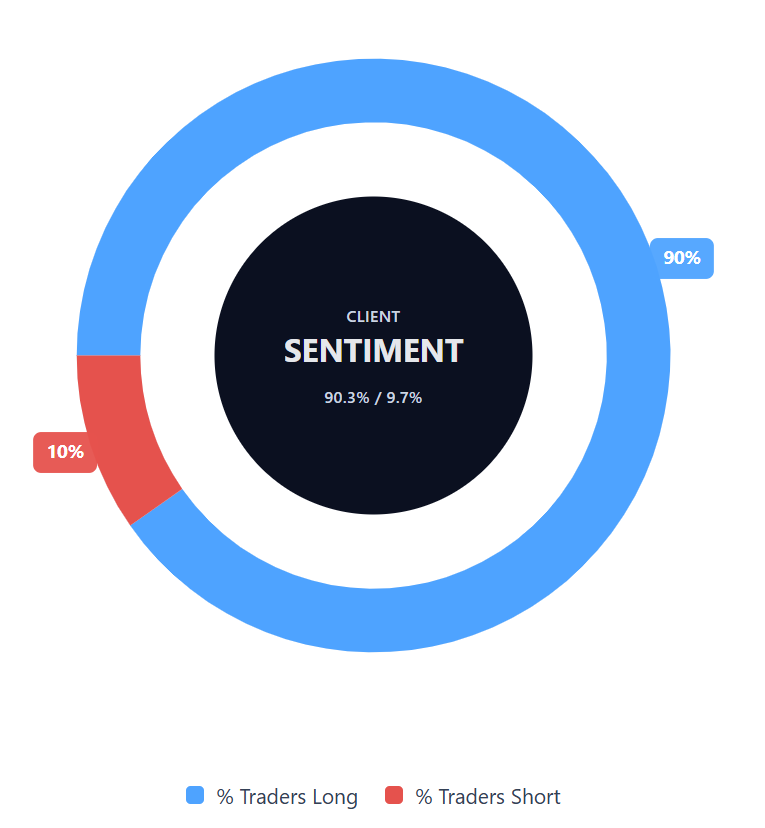
Capital.com’s client sentiment for Citigroup CFDs
As of 13 October 2025, Capital.com client positioning in Citigroup CFDs shows a predominantly long sentiment, with 90.3% of positions held by buyers and 9.7% by sellers. This represents a difference of 80.6 percentage points in favour of buyers, keeping sentiment firmly skewed to the long side.
This data reflects open positions on the Capital.com platform at the stated time and is subject to change.
FAQ
Is Citigroup a good stock to buy?
Capital.com does not provide investment advice or recommendations. Whether Citigroup shares are appropriate for a given investor depends on individual objectives, risk tolerance and financial circumstances. Traders can review independent data, analyse third-party research and consider technical indicators to form their own assessment before making any trading decision. Past performance is not a reliable indicator of future results.
Could Citigroup stock go up or down?
Citigroup’s share price can rise or fall based on a variety of factors, including earnings results, interest rate expectations, regulatory announcements, and global market sentiment. Like any publicly listed company, its valuation is influenced by both internal performance and wider market dynamics, meaning price movements can be unpredictable.
Should I invest in Citigroup stock?
Only investors who understand the risks associated with equity and CFD trading should consider exposure to Citigroup shares. It’s important to carry out independent research, use risk management tools such as stop-loss orders, and review official company disclosures before trading. Past performance is not a reliable indicator of future results. CFDs are traded on margin – leverage amplifies both profits and losses. Standard stop-loss orders are not guaranteed. Guaranteed stop-loss orders (GSLOs) incur a fee if activated.