Brilliant Basics - Part 2: Reversal Zones
Welcome to the second part of our educational series, Brilliant Basics. In this series, we'll explore how mastering the fundamentals lays the groundwork for achieving high-level performance in trading. Today, we focus on reversal zones, specifically the art of drawing support and resistance consistently across multiple timeframes.
Welcome to the second part of our educational series, Brilliant Basics. In this series, we'll explore how mastering the fundamentals lays the groundwork for achieving high-level performance in trading. Today, we focus on reversal zones, specifically the art of drawing support and resistance consistently across multiple timeframes.
Understanding Reversal Zones
Reversal zones are key areas on a chart where the price has the potential to reverse its direction. These zones are defined by support and resistance levels:
- Support is a price level where a downward momentum can be expected to pause due to a concentration of demand.
- Resistance is a price level where upwards momentum can be expected to pause due to a concentration of supply.
Drawing Support and Resistance Correctly
Drawing support and resistance levels correctly is crucial for accurate and consistent analysis. Here’s how you can ensure consistency and reliability in your charts:
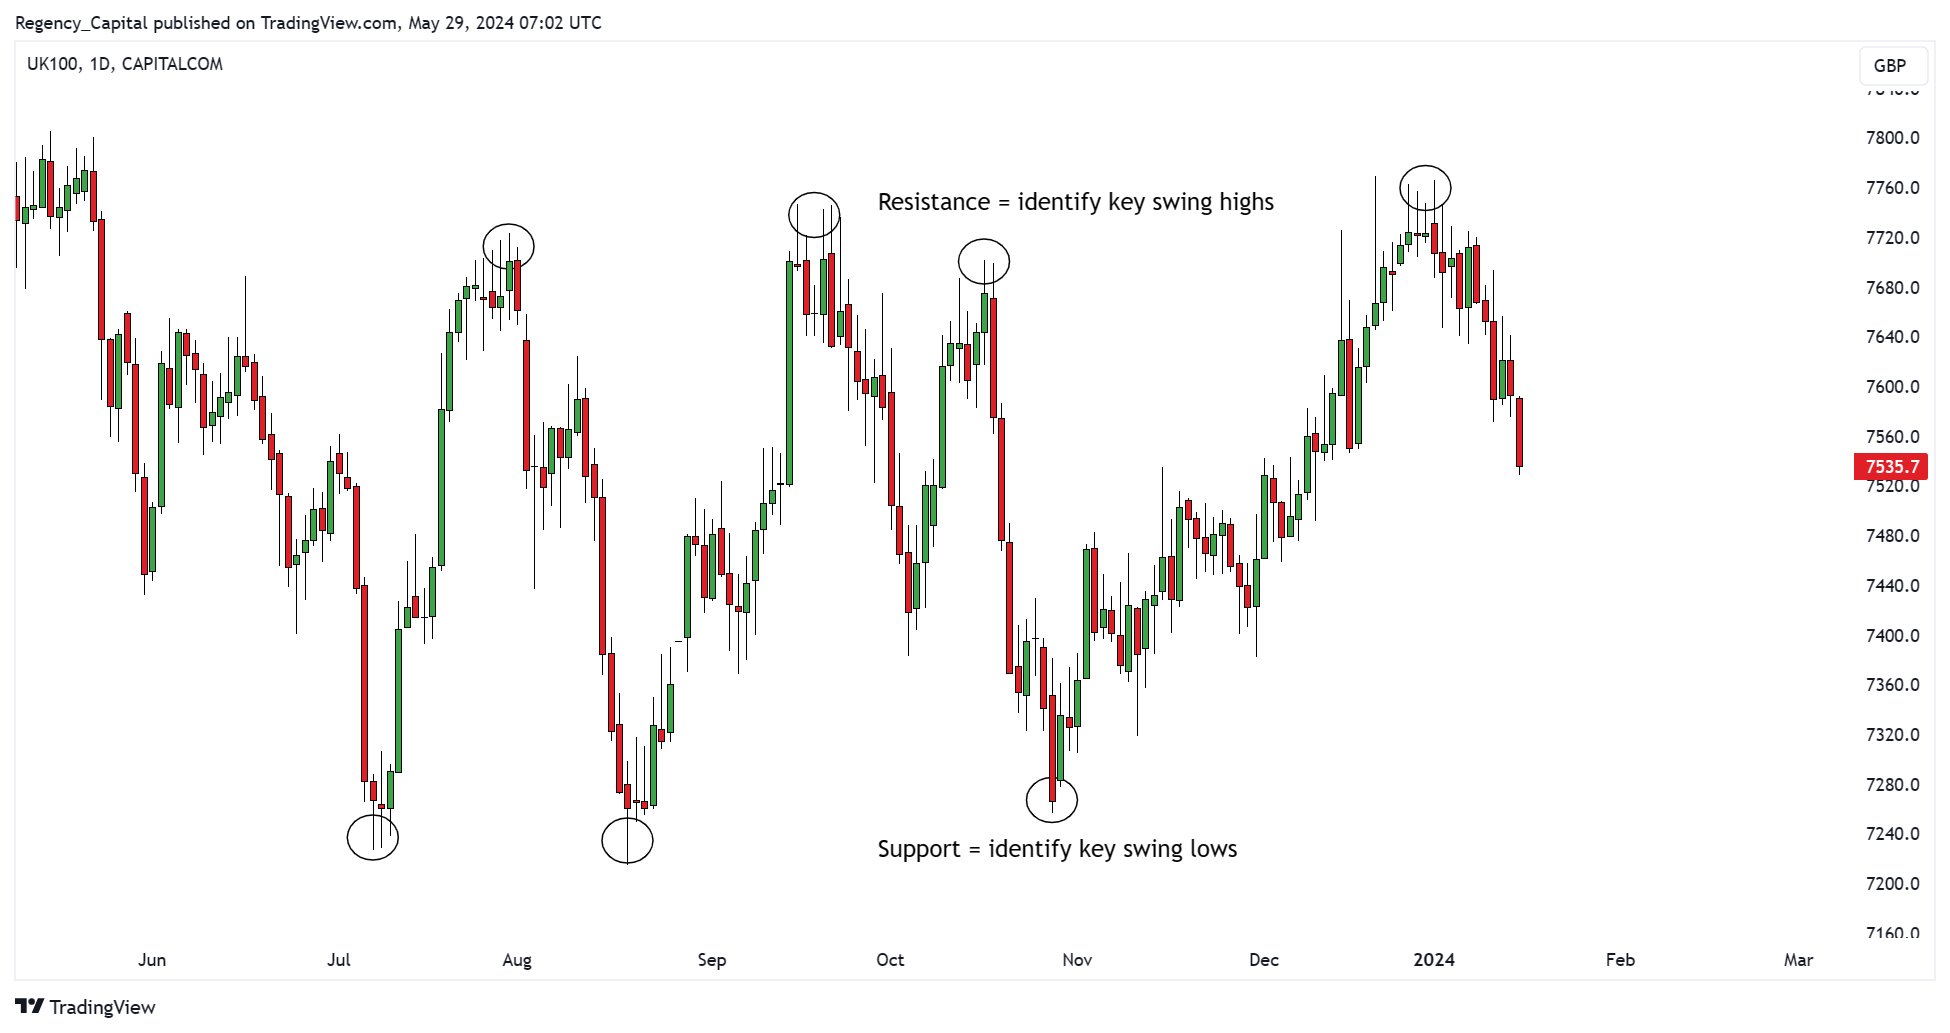
1. Identify Significant Swing Points:
- Resistance: Look for significant swing highs. A resistance level can be created by a single prominent swing high or multiple swing highs.
- Support: Similarly, support is identified by locating significant swing lows. It can be formed by a single notable swing low or multiple swing lows.
 (Past performance is not a reliable indicator of future results)
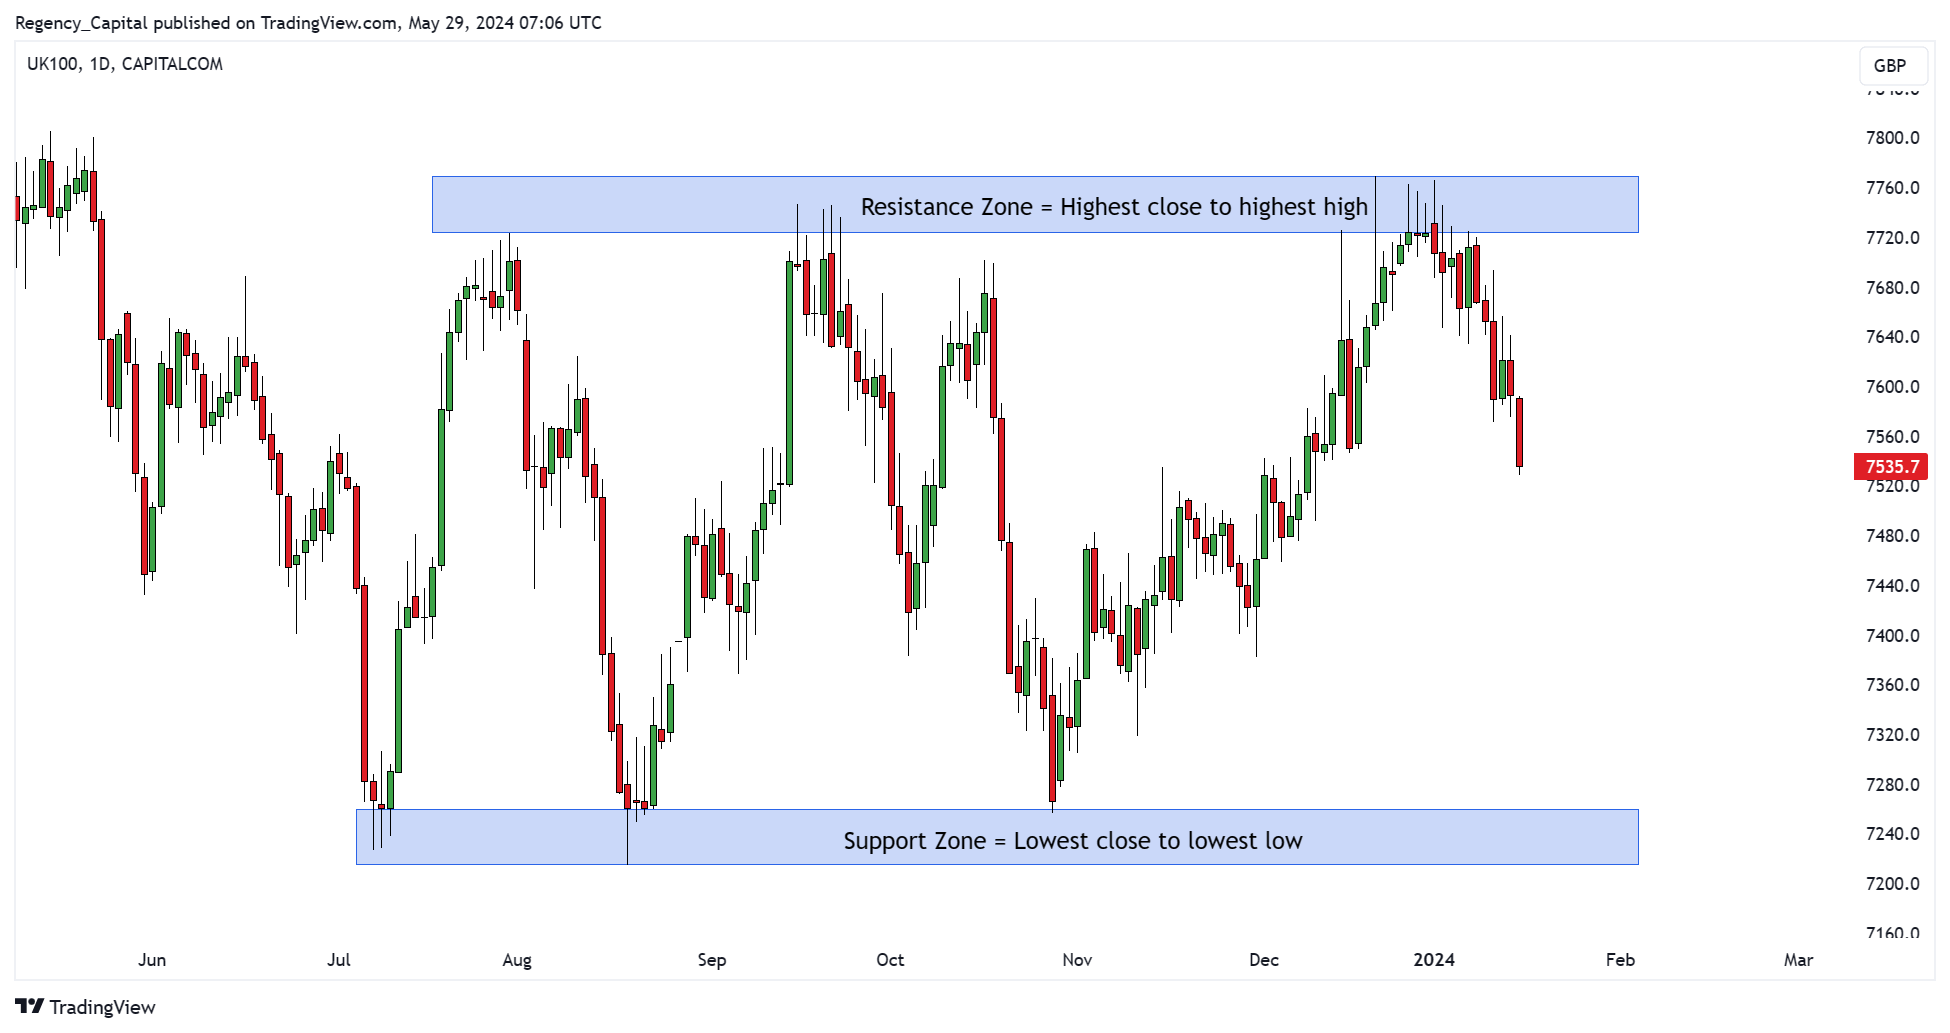
2. Define Support and Resistance Zones:
To create a more accurate representation, define support and resistance as zones rather than precise lines.
- Resistance Zone: This should be defined by the highest close and the highest high.
- Support Zone: This should be defined by the lowest close and the lowest low.
 (Past performance is not a reliable indicator of future results)
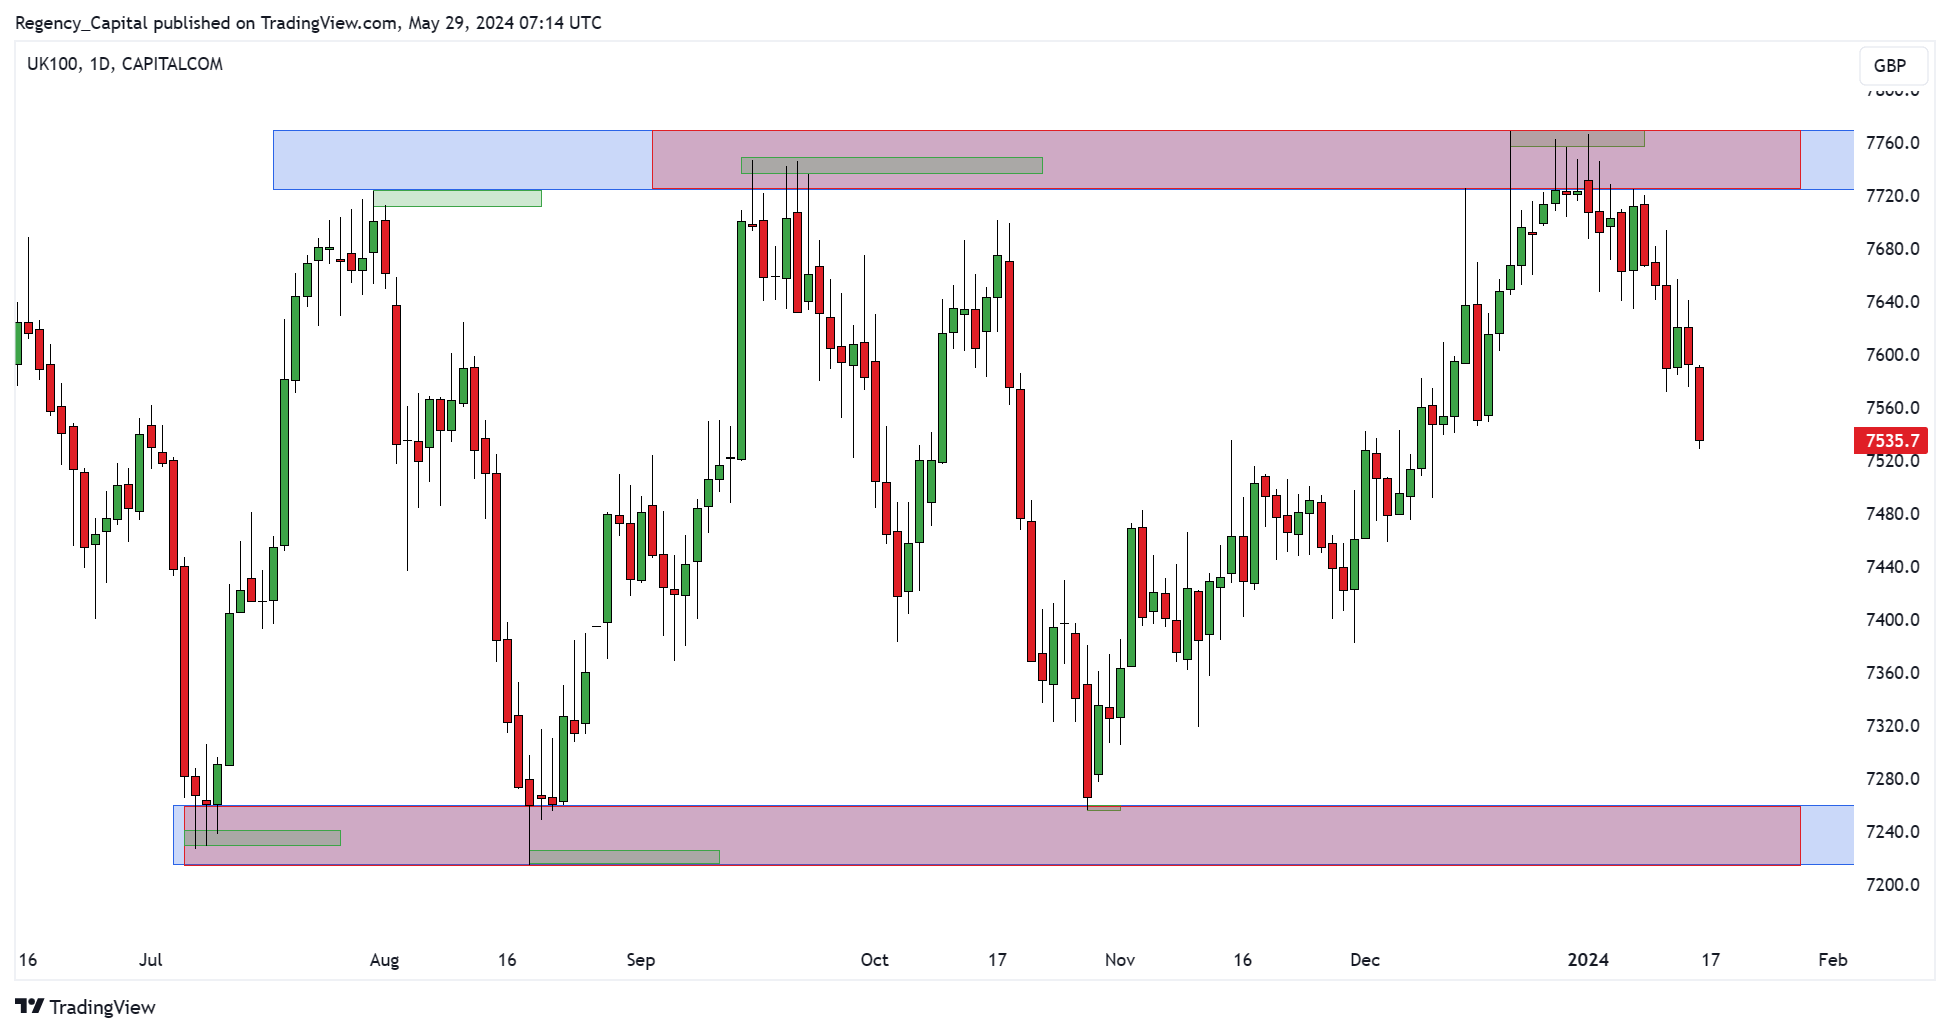
3. Use Coloured Boxes:
A handy tip is to use coloured boxes to highlight these zones. Different colours can be used for different timeframes, such as:
- Weekly: Use one colour (e.g., red).
- Daily: Use a different colour (e.g., blue).
- Hourly: Use another colour (e.g., green).
This visual differentiation helps in quickly identifying which timeframe a particular support or resistance zone belongs to.
 (Past performance is not a reliable indicator of future results)
4. Consistency is Key:
Consistency in how you draw support and resistance levels across different charts and timeframes is vital. This ensures that your analysis remains objective and reliable.
Practical Examples
Let’s look at an example of how we can use our rule set for drawing reversal zones consistently as price action evolves. For simplicity, we are going to stick to the daily timeframe:
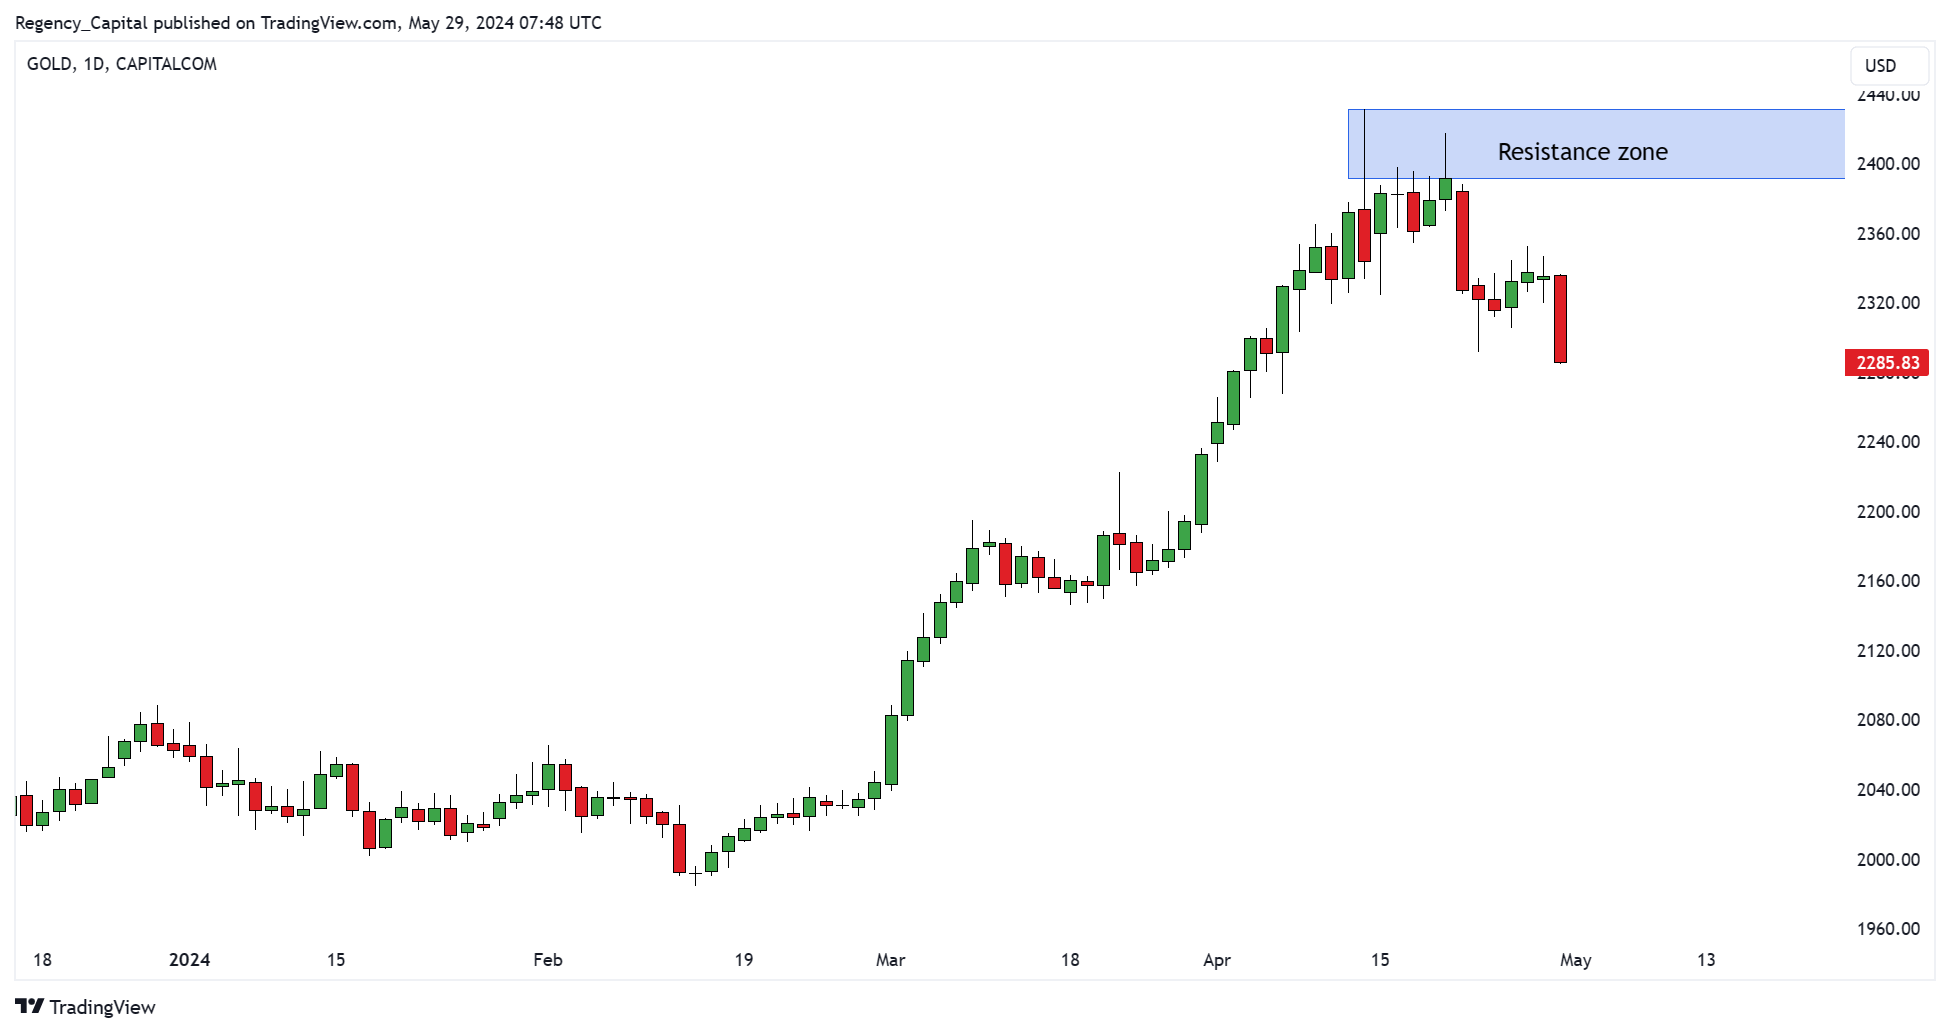
Resistance Example:
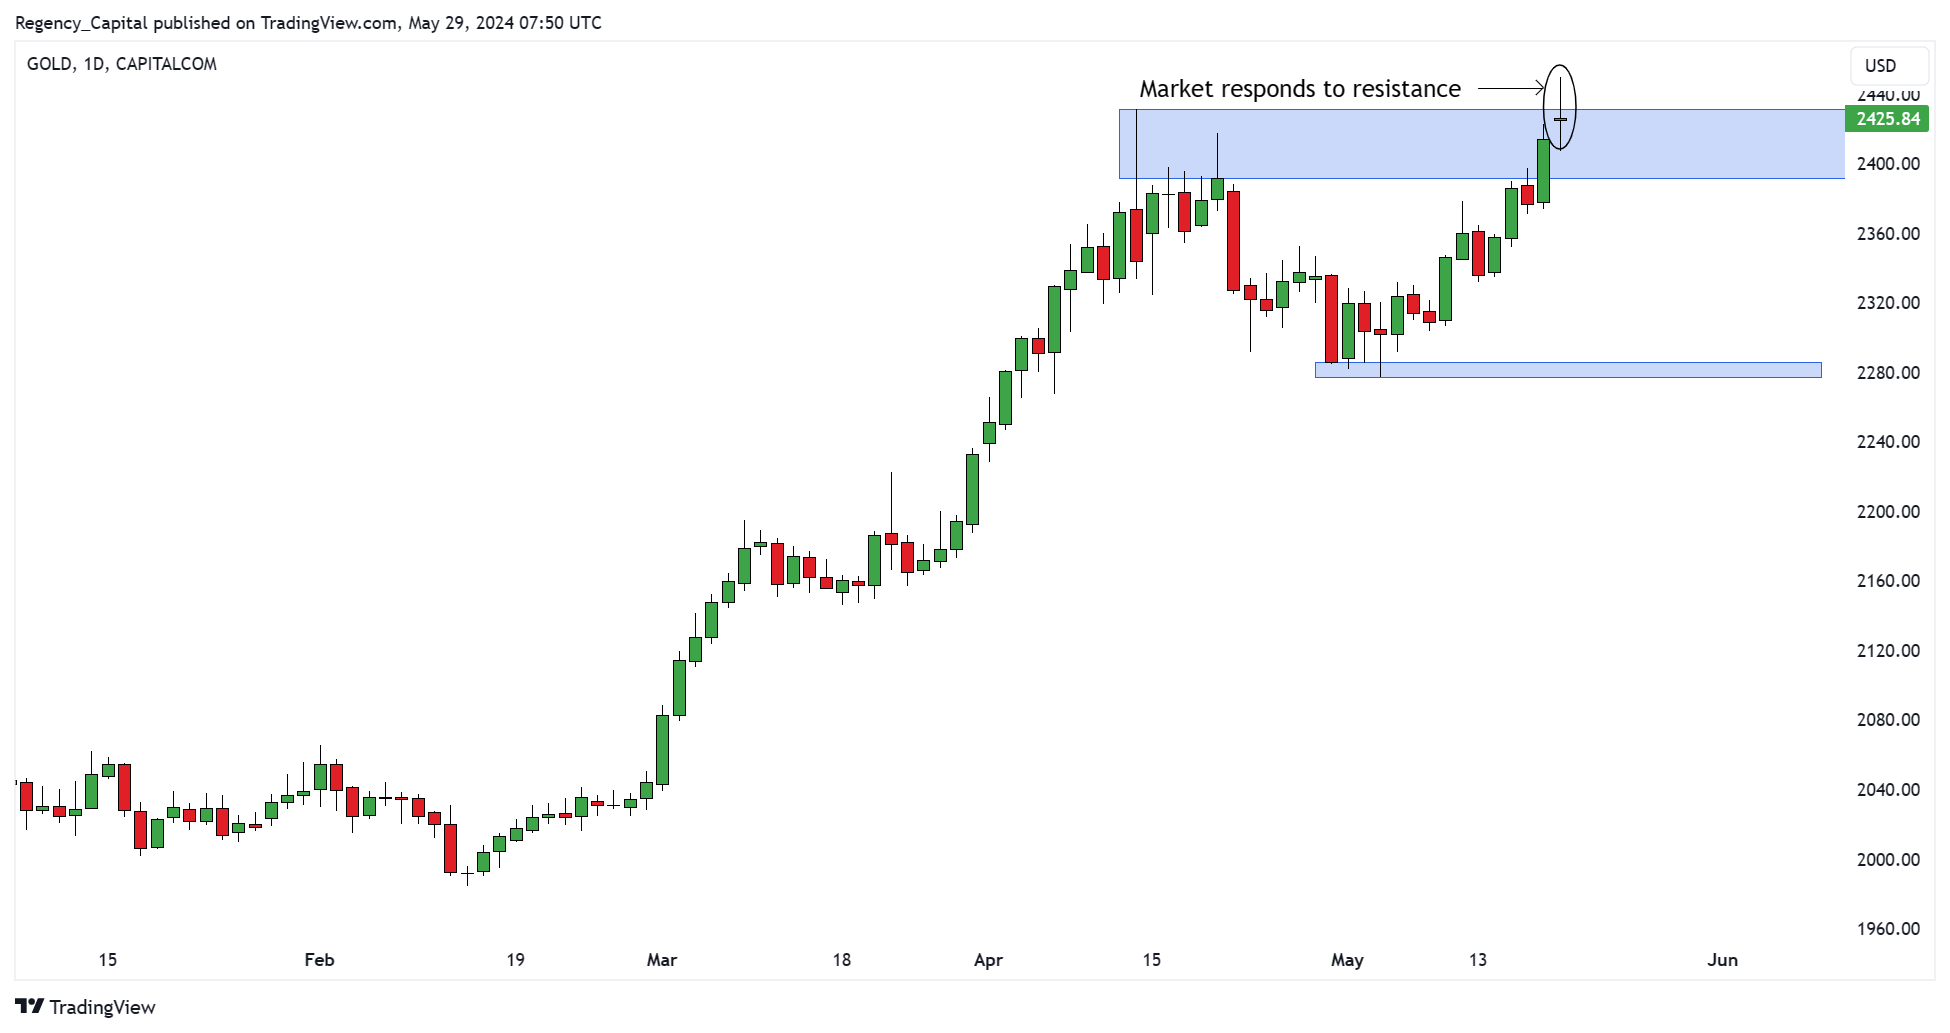
Phase 1. Draw the Zone: Locate significant swing highs on your chart. Mark the highest close and the highest high to form the resistance zone.
 (Past performance is not a reliable indicator of future results)
Phase 2. Monitor the Market’s Response: In this example, gold pushes deep into the resistance zone and breaks above resistance before closing back below resistance. This ‘fakeout’ response is potentially sufficient to initiate a short position depending on your strategy and trade plan. We have also added the new support zone onto the price chart – creating a target for shorts.
 (Past performance is not a reliable indicator of future results)
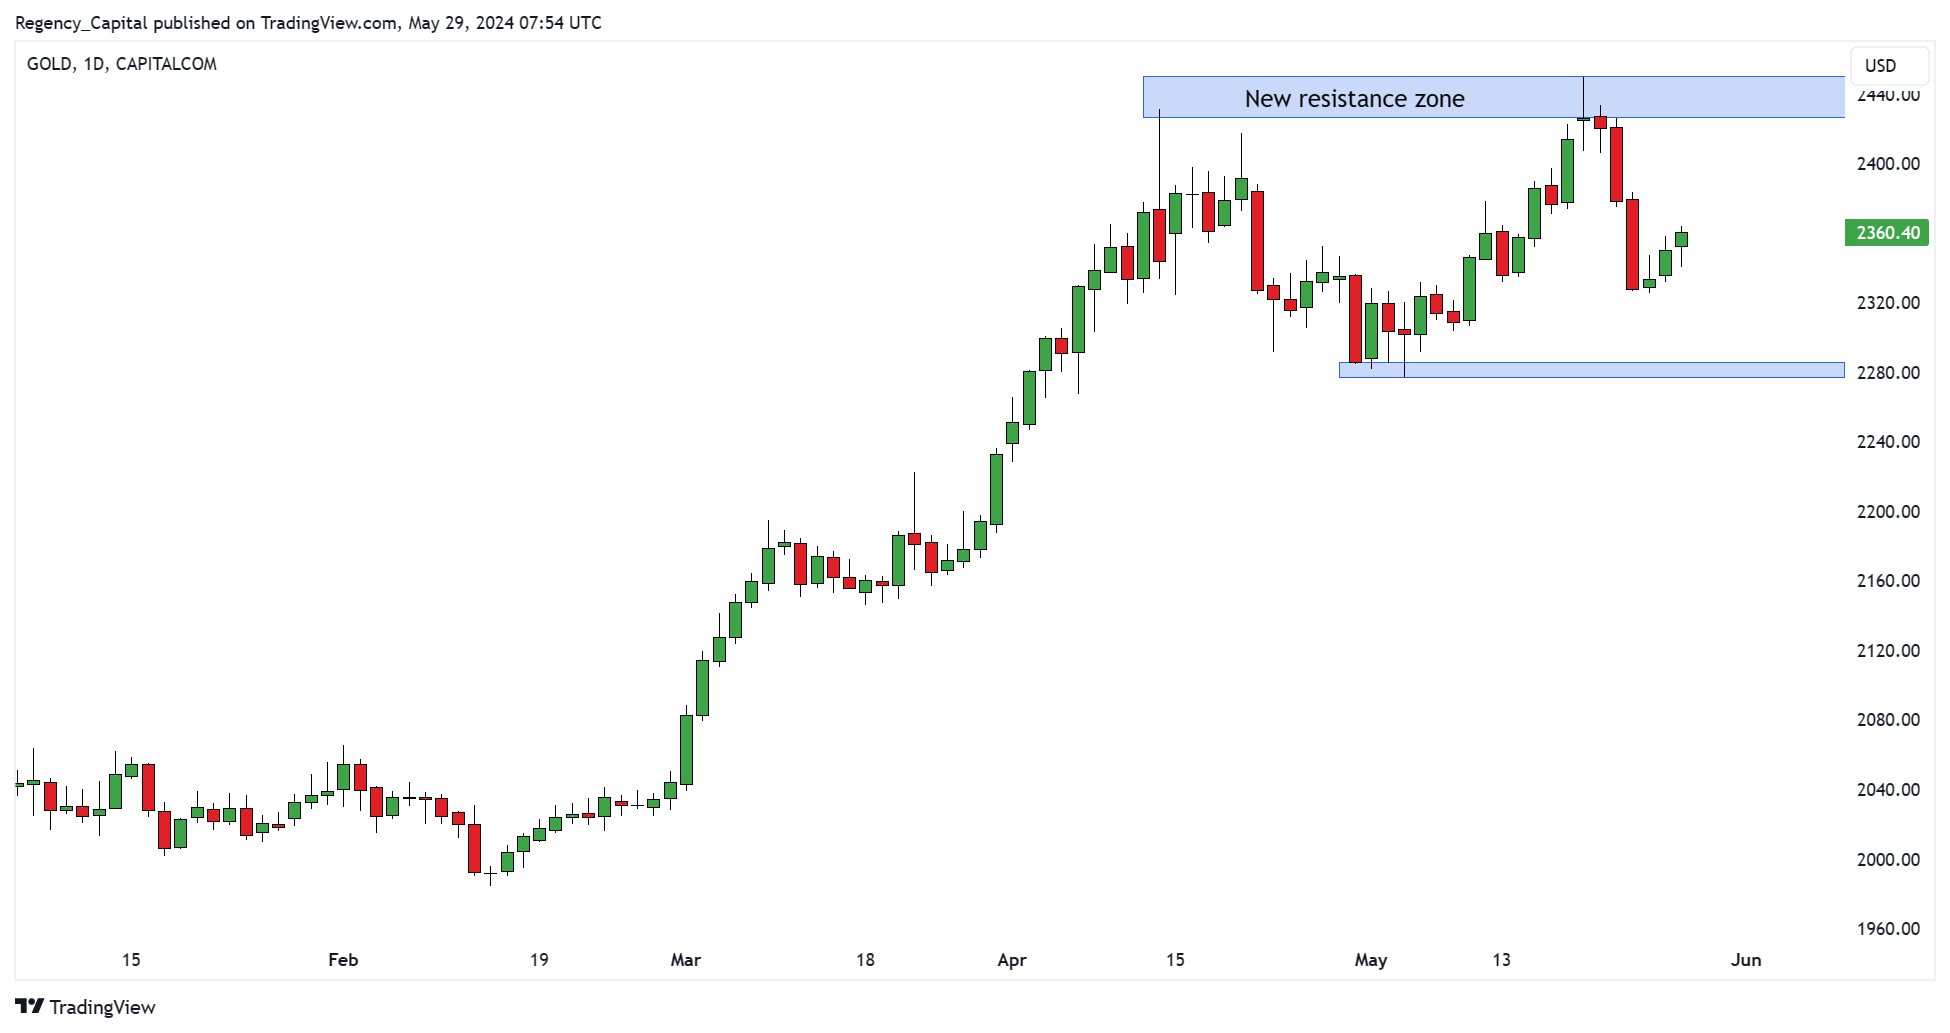
Phase 3. Redraw the Resistance Zone as Price Action Evolves: As price moves away from the original resistance zone, we can now redraw the resistance zone based on the highest high to highest close rule set.
 (Past performance is not a reliable indicator of future results)
Support Example:
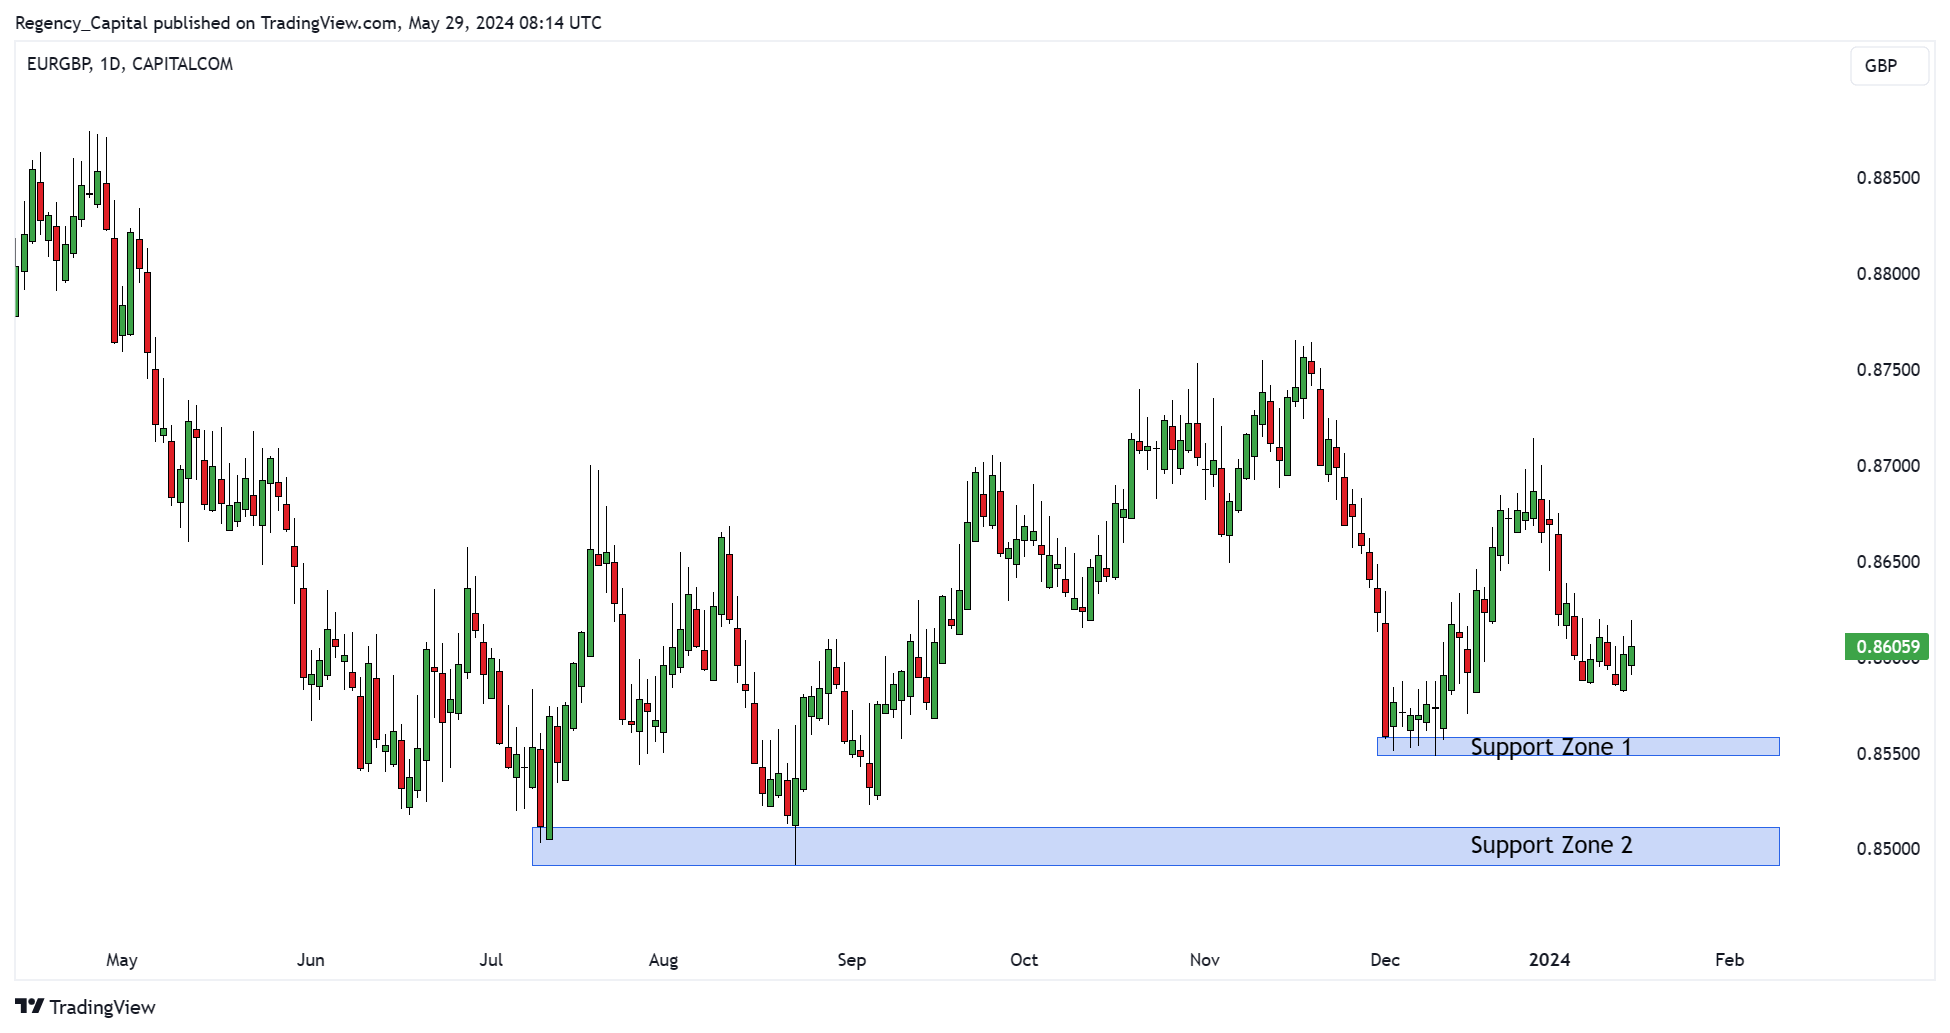
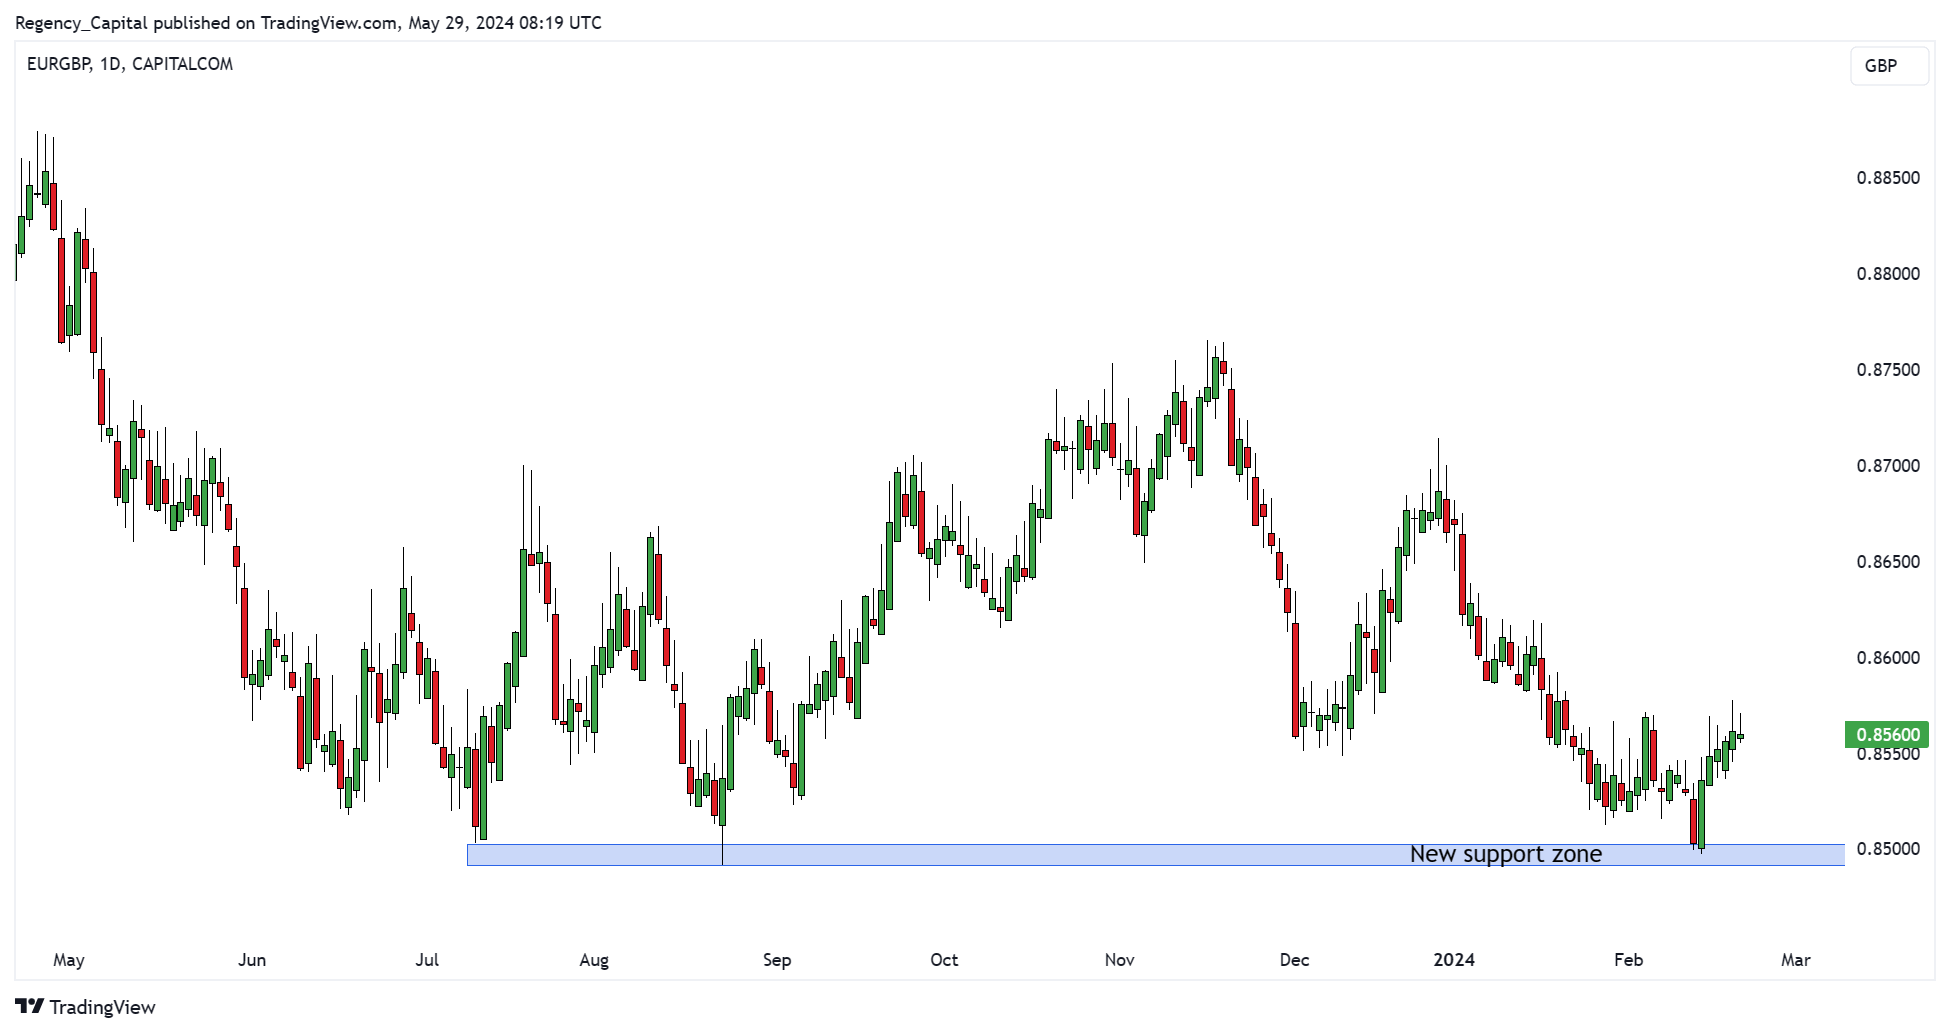
Phase 1. Draw the Zone: Locate significant swing lows on your chart. Mark the lowest close and the lowest low to form the support zone. In this example, there is a small support zone (zone 1) and a larger, more significant support zone (zone 2).
 (Past performance is not a reliable indicator of future results)
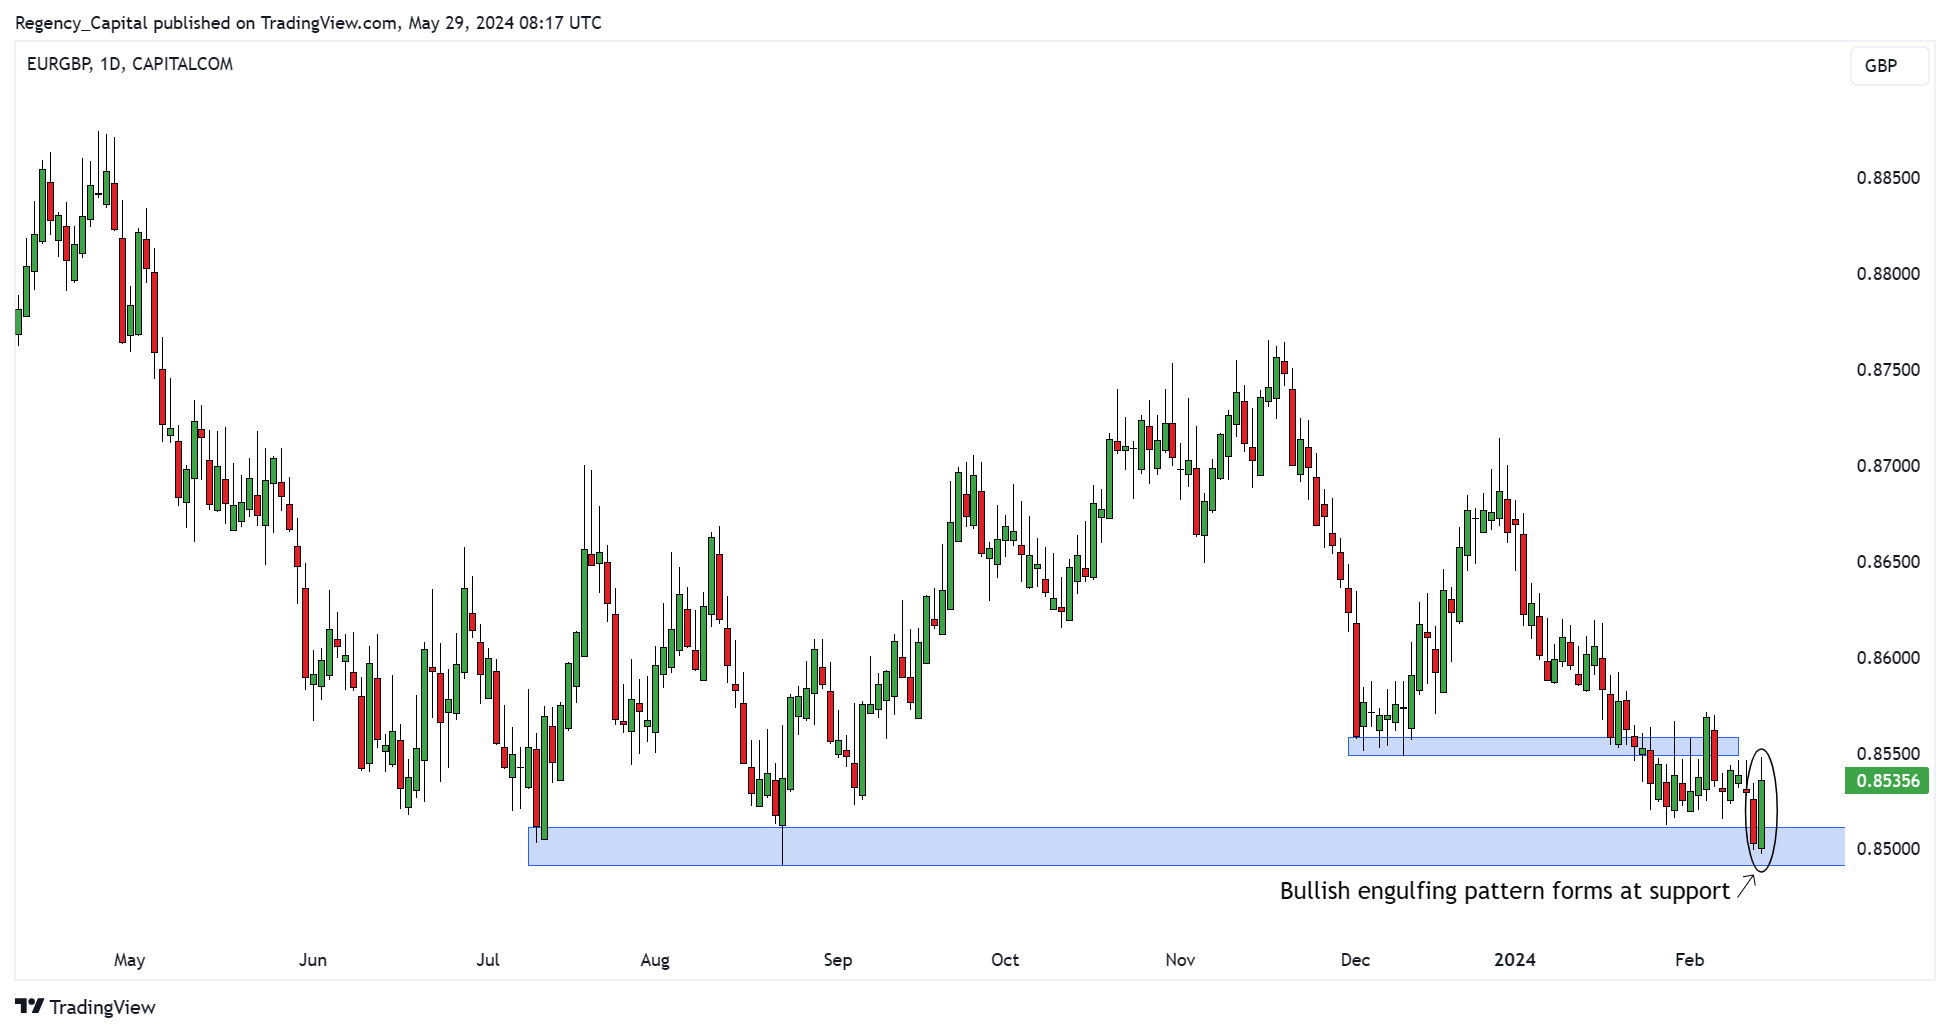
Phase 2. Monitor the Market’s Response: We can see that EUR/GBP breaks through support zone 1, but then forms a bullish engulfing pattern at support zone 2. A reversal pattern of this quality is potentially enough to initiate a long position depending on your strategy and trade plan.
 (Past performance is not a reliable indicator of future results)
Phase 3. Redraw the Support Zone as Price Action Evolves: As price moves away from the original support zone, we can now redraw the support zone based on the lowest low to lowest close rule set.
 (Past performance is not a reliable indicator of future results)
Summary
Understanding and accurately drawing support and resistance zones is fundamental for effective trading. These zones help identify potential reversal points, providing valuable insights into market behaviour. By maintaining consistency as price action evolves and using clear visual aids like coloured boxes, traders can enhance their analysis.
As we continue our Brilliant Basics series, stay tuned for Part 3, where we will delve into the concept of moving averages and their role in trend analysis. Understanding this fundamental concept will further enhance your ability to identify and follow market trends.