

DXY forecast | Fed policy, inflation and payrolls
The US Dollar Index (DXY) tracks the dollar against major currencies. In September 2026, it traded higher after the Fed’s first rate hike since 2023, alongside lower oil prices. Past performance is not a reliable indicator of future results.
US dollar (DXY) trades at 100.76 as of 8.20am UTC on 24 September 2026, within an intraday range of 100.22–100.87. Past performance is not a reliable indicator of future results.
The move follows the Federal Reserve's 25-basis-point rate increase on 16 September 2026, which lifted its target range to 3.75%–4% and marked its first hike since 2023 (CNBC, 16 September 2026). Several regional Fed presidents later said further tightening may be needed to bring inflation back towards target (Standard Chartered, 23 September 2026).
The dollar's advance has coincided with lower oil prices amid increased diplomatic efforts around the Middle East conflict, which Trading Economics linked to lower inflation expectations (Trading Economics, 22 September 2026).
Third-party DXY outlook: Fed hike
As of 24 September 2026, third-party USD forecasts show a mix of model-based and technical views following the Federal Reserve's mid-September rate decision.
Financial Forecast Center (statistical model)
The Financial Forecast Center projects a monthly average of 99.89 for September 2026, rising to 100.62 in October, 101.74 in November and 101.58 in December. Its model draws on prior exchange rates and factors including commodity prices, interest rates and economic indicators (Financial Forecast Center, 16 September 2026).
FXEmpire (technical analysis)
FXEmpire identifies near-term resistance at 100.37, 100.53 and 100.68, with support at 100.19, 100.04 and 99.89. Its analysis places DXY above its 50- and 100-period moving averages, with a move above 100.37 needed to validate the higher levels (FXEmpire, 21 September 2026).
KenMacro (desk technical note)
KenMacro identifies resistance at 100.91, 101.53 and 101.80, alongside a measured-move target around 101.10–101.40 based on a completed double-bottom pattern. A daily close below 99.93 would invalidate that scenario (KenMacro, 21 September 2026).
Long Forecast (time-series model)
Long Forecast's monthly table shows DXY opening September 2026 at 99.39 and closing at 101.93, implying a roughly 2.6% monthly rise. Its October closing projection is 102.74 (Long Forecast, 23 September 2026).
Predictions and third-party forecasts are inherently uncertain, as they cannot fully account for unexpected market developments. Past performance is not a reliable indicator of future results.
US Dollar Index: latest and upcoming macro data
The Federal Reserve raised its federal funds target range by 25 basis points to 3.75%–4% on 16 September 2026. Its statement described domestic spending as resilient and inflation as elevated (Federal Reserve, 16 September 2026). Both provide context for the US Dollar Index (DXY), although the rate decision alone does not determine its next move.
Upcoming data
As of 24 September 2026, upcoming US releases include the final estimate of second-quarter gross domestic product and August personal income and outlays on 30 September. The latter includes the personal consumption expenditures price index, a measure of US inflation (BEA, 23 September 2026).
September employment data follow on 2 October, with consumer price index data due on 14 October (BLS, 18 February 2026).
The Federal Reserve’s next policy meeting runs from 27–28 October (Federal Reserve, 16 September 2026).
US dollar: technical overview
As of 8.20am UTC on 24 September 2026, the US Dollar Index (DXY) trades above its 20-, 50-, 100- and 200-day simple moving averages (SMAs), at 99.70, 99.90, 100 and 99.20 respectively on TradingView. However, the 20-day SMA remains slightly below the 50-day SMA, leaving the shorter-term picture mixed.
TradingView's 14-day relative strength index (RSI) stands at 70.9, placing it in territory commonly described as overbought. That doesn't necessarily point to an immediate fall: RSI can stay elevated during sustained trends, although it can indicate stretched momentum.
The average directional index (ADX) stands at 30.0, suggesting a more established trend by conventional technical-analysis measures. The stochastic %K at 94.3 and Williams %R at -5.1 are consistent with the same overbought reading.
Classic pivot levels place R1 at 100.15 and R2 at 100.88, while the nine-period Hull moving average stands at 101.08. Below the current level, the pivot point at 99.35 and 200-day SMA near 99.20 provide further reference points, followed by S1 at 98.62 (TradingView, 24 September 2026).
A move through nearby resistance would bring higher levels into view, whereas a break below support would shift attention lower. As with any technical indicator, these levels don't predict future price movements with certainty.
This is technical analysis for informational purposes only and does not constitute financial advice or a recommendation to buy or sell any instrument.
US dollar index history
In late September 2024, DXY stood near 100.60 before rising through the fourth quarter and reaching a two-year high of 109.60 on 5 March 2025. The move came as resilient US data and inflation above target reduced expectations for Federal Reserve rate cuts.
The direction then reversed. Softer payrolls and CPI data through spring were followed by a sharper decline in May, taking the index below 97 by early June. DXY then traded between 96 and 99 over the summer before weakening again in the autumn.
The index reached a cycle low of 95.30 on 27 January 2026 as markets priced a faster Federal Reserve easing cycle. It later recovered above 101 by late June amid stronger-than-expected US growth data.
That recovery lost momentum through July and August, with DXY returning to around 97 before a late-summer rise took it back towards 100.80. The Federal Reserve then raised rates in September for the first time since 2023.
DXY closed at 100.81 on 24 September 2026, up roughly 3.4% year on year and 2.9% year to date.

Past performance is not a reliable indicator of future results. Prices are indicative and may differ from live market prices.
US Dollar Index: Capital.com analyst view
The US Dollar Index has traded across a roughly 14-point range over the past 12 months, from a high near 109.60 in March 2025 to a cycle low of 95.30 in January 2026, before recovering towards 100.80 by late September.
The Federal Reserve's September rate increase coincided with a near-term rise in DXY, although the index has since struggled to hold above 101. Attention now turns to whether incoming data support further tightening or bring the prospect of lower rates back into focus.
Meanwhile, wider US two-year Treasury yield spreads over German and Japanese counterparts can increase the relative appeal of dollar-denominated assets, while narrower spreads can reduce that support.
Speculative net-long futures exposure sits near the 80th percentile of its five-year range, pointing to relatively high long positioning. Stronger US data may help sustain those positions, whereas weaker figures or a shift in rate expectations may prompt some traders to reduce them.
The upcoming payrolls and CPI releases could alter the balance in either direction. The 103–104 area marks a previous resistance zone from 2024, while lower support levels may come back into focus if momentum fades.
Capital.com’s client sentiment for US dollar CFDs
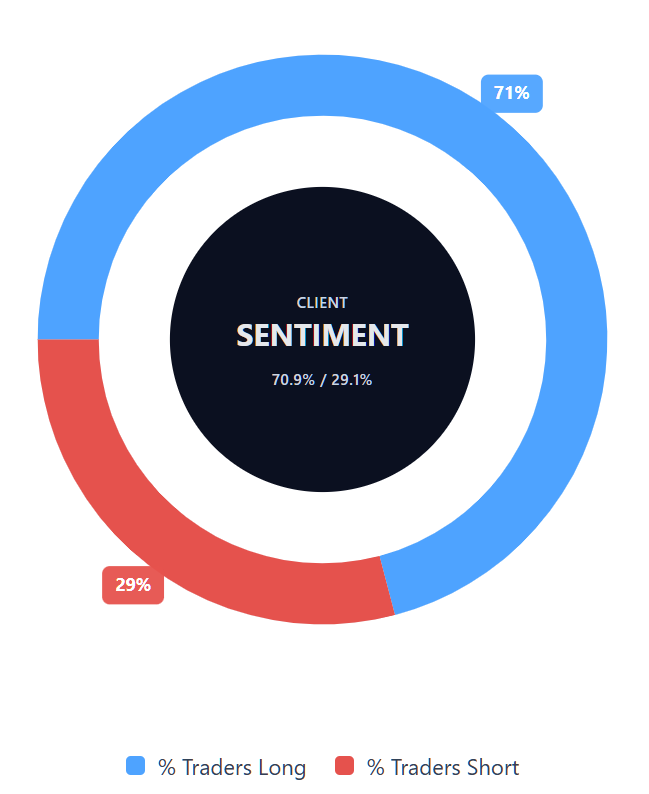
As of 24 September 2026, Capital.com client positioning in US dollar index CFDs is 70.9% buyers versus 29.1% sellers, a difference of 41.8 percentage points.
The figures reflect open positions held by Capital.com clients at the time of the snapshot. They can change quickly and don't indicate how DXY will move next.
Summary – US dollar index 2026
- At 8.20am UTC on 24 September 2026, Capital.com quoted the US Dollar Index at 100.76, within an intraday range of 100.22–100.87.
- TradingView's 14-day RSI stood at 70.9, while DXY traded above its cited 20-, 50-, 100- and 200-day simple moving averages.
- US economic data can shift interest-rate expectations in either direction, which may in turn influence the dollar.
- Further US economic releases are due before the Federal Reserve's 27–28 October meeting.
Past performance is not a reliable indicator of future results.
FAQ
What is the US dollar forecast?
Third-party forecasts cited in this article point to a range of possible near-term outcomes for the US Dollar Index (DXY). Some models place the index around 100.40–101.90 through late September and October 2026, while prediction-market pricing shows lower implied odds of a move towards 103.50. These forecasts can change as economic data, Federal Reserve policy expectations and market conditions shift.
What influences US dollar index movements?
DXY can respond to changes in US interest-rate expectations, inflation, employment data, economic growth and Treasury yield differentials. Stronger US data or higher-for-longer rate expectations may support the dollar, while weaker data or growing expectations for rate cuts may weigh on it. Geopolitical developments, commodity prices and positioning can influence the index too, although the market response will depend on how new information compares with existing expectations.
Could the US dollar index go up or down?
Yes. DXY can move in either direction as traders reassess US economic data, Federal Reserve policy and relative interest rates. Stronger inflation or employment figures may push rate expectations higher and support the dollar, while softer data may increase expectations for lower rates and weigh on the index. Technical levels can help traders monitor price action, but they don’t predict future movements and may produce conflicting signals.
Can I access US dollar exposure using CFDs on Capital.com?
You can access exposure to US dollar index CFDs on Capital.com, which lets you take long or short positions without owning the underlying currencies. Alternatively, you may wish to trade CFDs on forex pairs that include the US dollar – such as EUR/USD, GBP/USD, AUD/USD, or USD/JPY.*
*Contracts for difference (CFDs) are traded on margin, and leverage amplifies both profits and losses.