Silver (XAG/USD) reclaims $30, but Gold-Silver ratio rises amid tariff turmoil
Silver (XAG/USD) is back above $30, bouncing from recent lows — but the rebound might not tell the whole story.
Silver (XAG/USD) has bounced back above the $30 mark in recent sessions, recovering from last week’s tariff-driven selloff. Like gold, silver is often considered a safe haven asset, offering protection in times of uncertainty. However, the recent market chaos triggered by Trump’s aggressive tariff policies has weighed on nearly all asset classes, including precious metals.
While some of the selling may be due to forced liquidations to cover broader portfolio losses, silver faces a unique challenge: its dual identity as both a store of value and an industrial metal.
Tariffs Complicate Silver’s Demand Outlook
Unlike gold, which often thrives during market stress, silver's performance is more nuanced. Its significant industrial applications—in sectors like solar energy, electronics, and electric vehicles—tie its price more directly to the health of the global economy. As a result, the price of silver is likely to see direct implications as a result of Trump’s tariffs. For example, tariffs on Chinese solar panels could reduce U.S. solar buildout, curbing silver consumption whilst Tariffs on imported metals – like steel or aluminium - can raise production costs in industries that also use silver. This industrial sensitivity makes silver more exposed to the downside risk of a prolonged trade war than gold.
A huge part of the outlook for global markets going forward is how the tariff environment evolves. Unfortunately, the uncertainty continues as Trump has said he plans to move forward with the announced tariffs, even as many global leaders have reached out to try and reach an agreement. However, he has hinted that he may be open to some negotiations, which could lead to a rapid improvement of risk sentiment if confirmed.
For now, the tit-for-tat trade war between China and US is a major concern for silver. China is one of the largest silver consumers globally — not for jewellery, but for industrial use. The main demand drivers are electronics & semiconductors, solar panels (China is the world’s largest solar manufacturer and silver is key in photovoltaic cells) and electric vehicles and batteries. The high level of tariffs that have been taunted could disrupt global supply, increase costs and reduce the demand for silver, which would weigh on prices.
Despite the industrial drag, if tariff tensions escalate, markets may begin to price in an increased risk of a global economic slowdown. In that case, safe-haven flows could return to both gold and silver, potentially offsetting some of the weakness stemming from industrial demand destruction.
Gold-Silver Ratio Highlights Market Preference
One key indicator to watch is the gold-silver ratio, which measures how many ounces of silver are needed to buy one ounce of gold. This ratio has been rising, reflecting gold’s outperformance and increasing investor preference for it.
Silver’s dual role makes it lag behind gold during periods of economic uncertainty. Gold, often favored by central banks and institutions, is currently attracting more capital than silver, skewing the ratio further.
Silver (XAG/USD) daily chart & Gold-Silver ratio
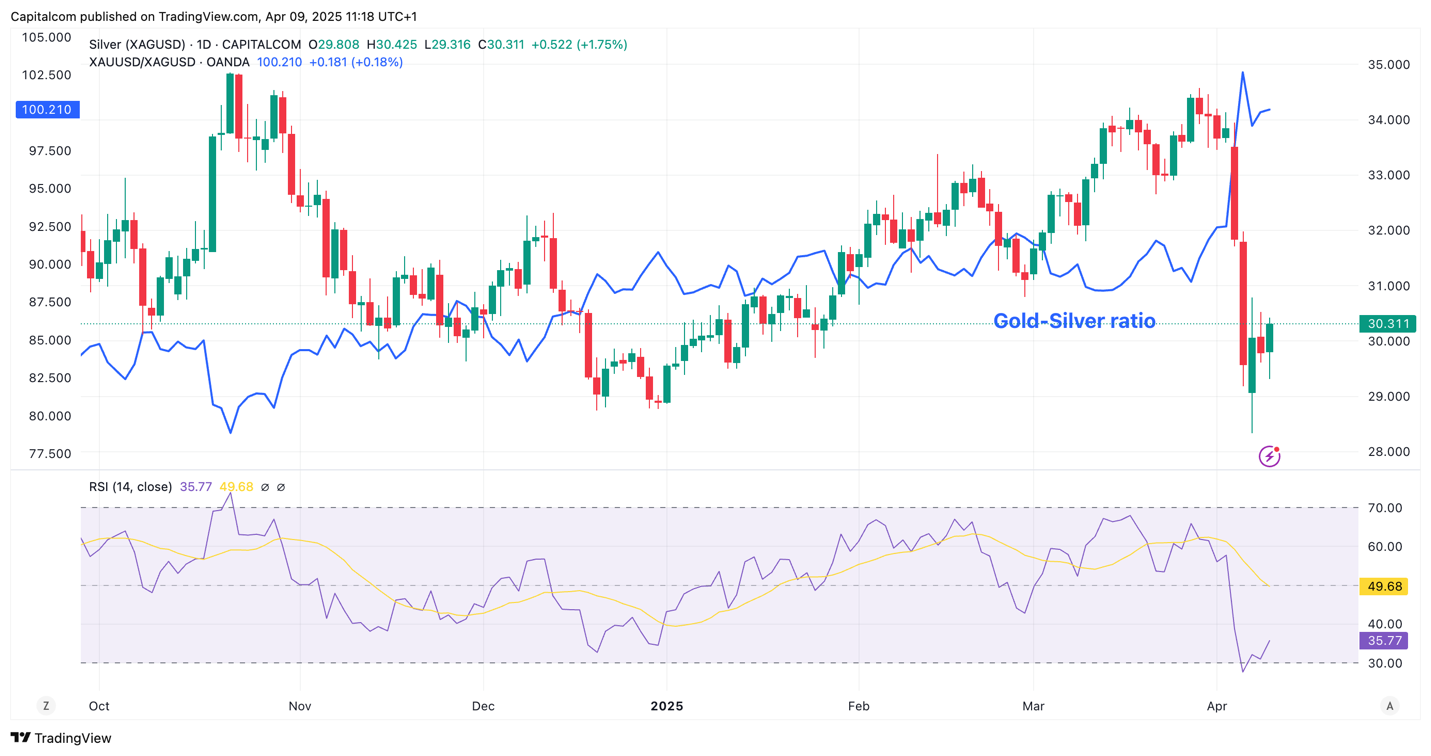
Past performance is not a reliable indicator of future results.
Bottom Line
Silver has reclaimed the psychologically important $30 level, but ongoing tariff uncertainty continues to cloud the outlook. The metal remains caught between industrial vulnerability and safe-haven demand. While a worsening trade war could support silver in the long run, the short-term risks from demand disruption—especially in China—are real.
The gold-silver ratio’s spike further suggests that investors currently prefer gold over silver. Until clarity returns to trade negotiations, silver is likely to remain volatile, dancing to the tune of both macroeconomic fear and industrial fragility.