Market Analysis: global stocks continue to recover
A drop in recession concerns has allowed stocks to recover some bullish momenutm ahead of the Jackson Hole Symposium next week.
Bullish appetite continues to drive the recovery in global stock indices. Improved sentiment stemming from lesser concerns of a global recession has driven investors back into the stock market after last week’s meltdown. This has led to markets shifting their expectations of the September rate cut from 50 basis points to 25, currently at 80%.
Stronger-than -expected US July retail sales reinforced the bullish sentiment and drove global stocks higher on Thursday. A bigger drawdown in oil inventories also helped improve appetite as it alludes to stronger consumption from US consumers.
The S&P 500 is up 9% since the lows on Monday August 5. It is now facing the resistance that enabled the pullback last week at 5,564, a level that could be broken over the coming days is sentiment continues to improve. The RSI continues to point upwards even as it flattens slightly.
S&P 500 daily chart
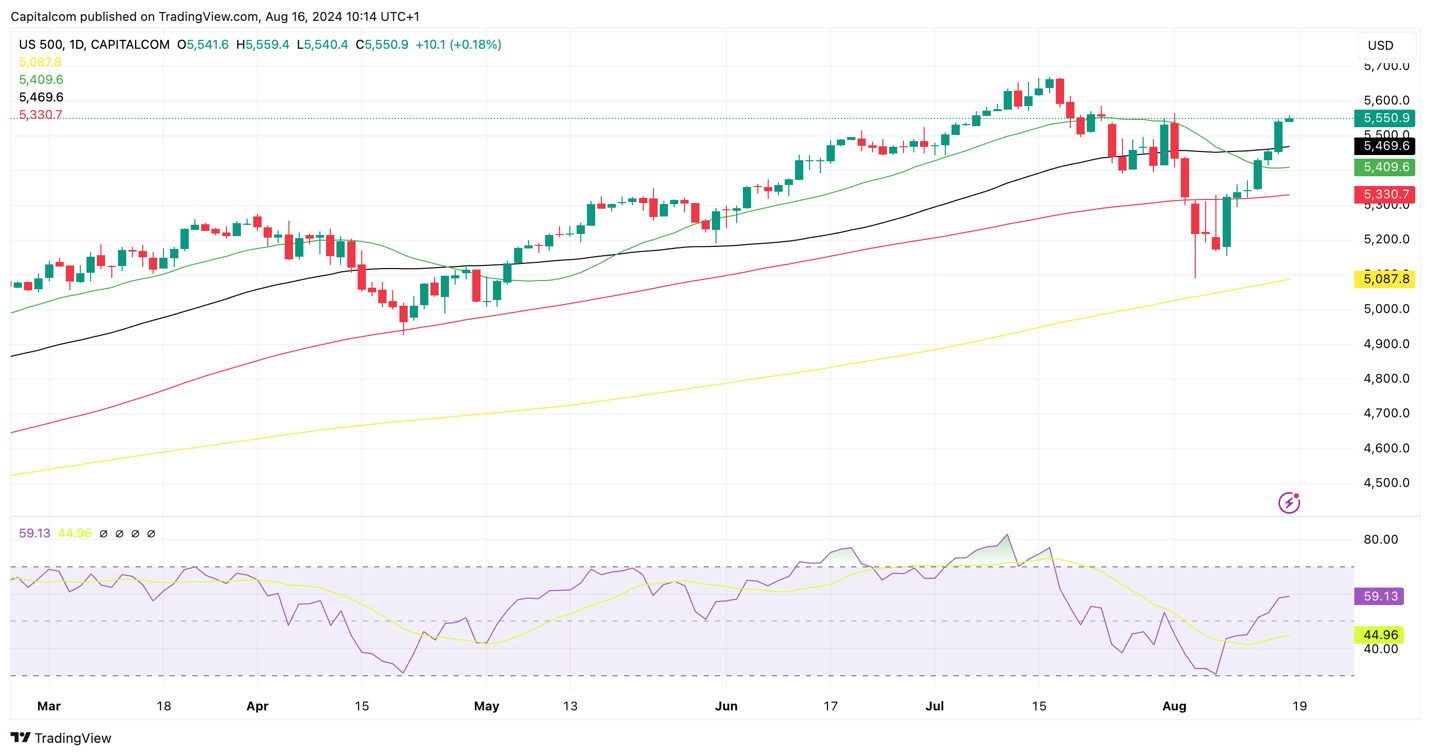
Past performance is not a reliable indicator of future results.
After a few busy weeks of economic data releases, the calendar is slightly bare next week so sentiment will likely continue being a key driver. Notable events will be the US Democratic national convention, the Fed minutes and the Jackson Hole Symposium. Increased focus will be placed on the central bank as markets look for any further guidance on monetary policy. Some FOMC members have reiterated that the data does not show significant concerns about a recession, therefore justifying the Fed’s decision to keep rates unchanged in August. Nonetheless, markets will want confirmation that a rate cut is definitely coming in September, and so Powell’s appearances at the symposium will be heavily scrutinized. We could see some further volatility stemming from this at the latter part of next week.
Elsewhere, equity indices are also making headway in Europe, with the DAX 40 and STOXX 600 attempting to close the gap from the pullback last week. Both indices have seen strong daily gains with a pattern of higher highs and lows consolidating the upside momentum. Both RSIs are also pointing higher as is the fact that most of the key moving averages have been cleared once again.
The STOXX 600 has now entered a choppy area where there is usually a lot of two-way trade which could see some resistance arise in the coming days, starting with the 512.50 level. Beyond it, 515.90 has been a level that has reverse the momentum a few times in the past.
Meanwhile, the DAX 40 has moved above a medium-term ascending trendline which could see support arise around 18,200 if the momentum turns lower. Previous resistance has concentrated around 18,550 but we could see some selling pressure before that as the index moves away from its daily high during Friday’s session.
DAX 40 & STOXX 600 daily charts
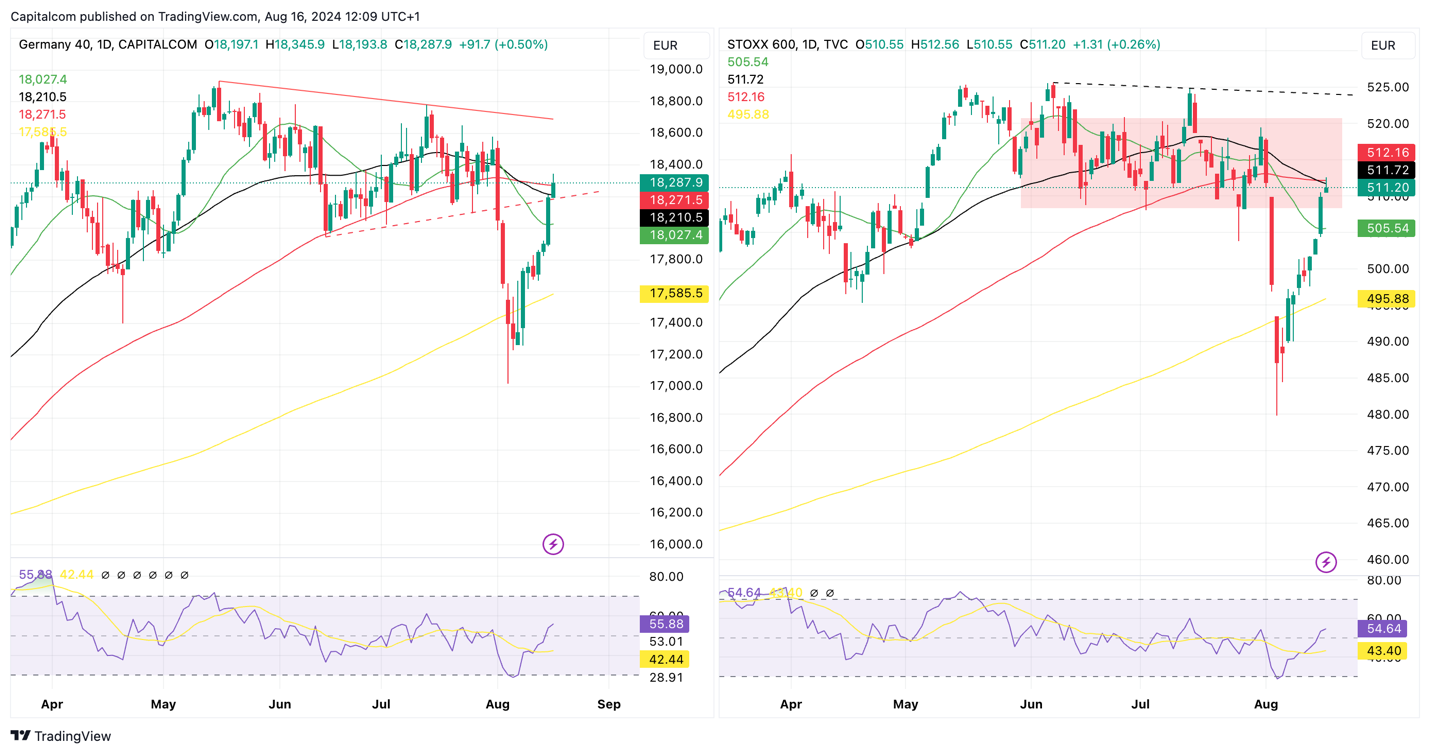
Past performance is not a reliable indicator of future results.