Eni stock forecast: Q1 earnings, buyback expansion
Eni is an Italian energy group listed on the Borsa Italiana, with its latest update shaped by Q1 2026 earnings, higher hydrocarbon production and a larger €2.8 billion buyback. Explore third-party ENI price targets and technicals. Past performance is not a reliable indicator of future results.
Eni S.p.A. (ENI) is trading at €23 in afternoon European trading as of 2:19pm UTC on 27 April 2026, within an intraday range of €22.92–€23.46 on Capital.com's quote feed. Past performance is not a reliable indicator of future results.
The share has been supported by Eni's Q1 2026 results, published on 24 April 2026, in which the company reported adjusted net profit of €1.302 billion and a 9% year-on-year increase in hydrocarbon production, while nearly doubling its share buyback programme to €2.8 billion and raising its full-year cash flow from operations guidance to €13.8 billion (Eni S.p.A., 24 April 2026).
Brent crude, a key revenue driver for Eni, has traded around $102–$103 per barrel in April 2026 amid the ongoing Middle East conflict, with Confindustria Centro Studi noting in its April 2026 flash report that oil averaged $102 per barrel across the month (Confindustria Centro Studi, 21 April 2026). Italy's broader macro backdrop has also weakened, with the Bank of Italy projecting GDP growth of just 0.5% for 2026 and citing energy-price pressure on domestic demand (Bank of Italy, 3 April 2026). Italy's exposure to fossil fuel price shocks has drawn further attention, with Euronews reporting that the country is the most exposed EU member to fossil fuel volatility and has called for a united European energy transition (Reuters, 23 April 2026).
Eni stock forecast 2026–2030: buyback grows and analyst targets diverge
As of 27 April 2026, third-party Eni stock predictions reflect a broadly constructive stance, shaped by the company's Q1 2026 results, its expanded buyback programme, and sustained elevated Brent crude prices. The following targets summarise leading broker and consensus views from that period.
Barclays (Buy maintained)
Barclays analyst Lydia Rainforth retains a Buy rating with a 12-month ENI stock forecast of €28.50. The affirmation follows sustained upstream production momentum and Eni's track record of delivering on its strategic goals, with shares having risen by roughly 90% over the preceding 12 months (MarketScreener, 16 April 2026).
Exane BNP Paribas (upgrade to Outperform)
Exane BNP Paribas upgraded ENI to Outperform from Neutral and raised its 12-month price target to €27.50 from €16. The firm cited Eni's positioning following the Middle East oil crisis, noting that two years of strategic delivery and high cash flow exposure to tighter oil prices had begun to shift investor sentiment, while the confirmation of CEO Claudio Descalzi for a fifth term removed a key governance overhang (Investing.com, 17 April 2026).
RBC Capital Markets (Neutral maintained)
RBC Capital Markets analyst Biraj Borkhataria retains a Neutral rating on ENI, holding the firm's 12-month price target steady at €28. The note followed Eni's Q1 2026 earnings release, in which the company reported adjusted net profit of €1.302 billion and raised its full-year cash flow from operations guidance to €13.8 billion amid a revised Brent assumption of $83 per barrel (MarketScreener, 24 April 2026).
UBS (Buy maintained)
UBS analyst Joshua Stone maintains a Buy rating on ENI with a 12-month price target of €28.50. The stance is consistent with the target set by the firm on 8 April 2026 and reflects Eni's volume growth trajectory and enhanced shareholder return commitments following the Q1 results (The Globe and Mail, 25 April 2026).
MarketScreener (broker consensus)
MarketScreener aggregates 22 analyst estimates and reports a mean 12-month price target of €24.42 against a last close of €22.30, with a consensus rating of Outperform. The spread of individual estimates reflects divergence between firms applying a structurally elevated oil price scenario and those using a more conservative forward Brent assumption (MarketScreener, 24 April 2026).
Predictions and third-party forecasts are inherently uncertain, as they cannot fully account for unexpected market developments. Past performance is not a reliable indicator of future results.
ENI stock price: Technical overview
The ENI stock price trades at €23 as of 2:19pm UTC on 27 April 2026, sitting just below its 20-day simple moving average (SMA) at around €24 and broadly in line with the 30-day SMA at around €23. The 50-, 100- and 200-day SMAs at around €22, €19 and €17 all sit below the current price, indicating that the longer-term trend backdrop remains upward-sloping even as near-term momentum has softened.
The 14-day relative strength index (RSI) reads 50.87, placing it in neutral territory and indicating that the shares are neither overbought nor extended to the downside. The average directional index (ADX) at 27.1 indicates that an established, if moderately paced, trend is present, according to TradingView data captured at the same time.
On the upside, the classic R1 pivot at €26.63 represents the nearest reference above the current price; a daily close through that level would bring the R2 area near €28.41 into view. The Ichimoku base line at €23.23 and the Hull moving average at €23.13 both sit fractionally above the last price, forming a near-term overhead reference band in the €23.10–€23.60 area.
To the downside, the classic pivot (P) at €23.18 sits just above the last price and acts as an initial reference point. Below that, the 50-day SMA near €22 represents the next meaningful support area, with S1 at €21.40 the subsequent level if that area gives way (TradingView, 27 April 2026).
This is technical analysis for informational purposes only and does not constitute financial advice or a recommendation to buy or sell any instrument.
Eni share price history (2024–2026)
ENI’s stock price opened April 2024 at around €15.29 and traded in a relatively tight band through the summer, touching a local high near €14.87 in May before drifting gradually lower through the second half of 2024 and closing the year at €13.10 on 30 December 2024.
The slide extended into early 2025, with ENI touching a two-year low of €11.04 on 9 April 2025, coinciding with a broader sell-off in European energy stocks as global trade tariff fears and softer oil demand weighed on the sector. The stock found its footing from mid-April 2025 onwards, recovering steadily through the summer as Brent crude stabilised and Eni's upstream volumes held firm.
By late 2025, the shares had climbed back above €16, closing the year at €16.18 on 30 December. The rally gathered momentum in early 2026, with ENI breaking above €20 in early March and pushing towards a two-year high of €25.06 on 7 April 2026, supported by a sharp rise in Brent crude amid Middle East tensions and Eni's upgraded capital return programme.
ENI closed at €22.99 on 27 April 2026, approximately 75.5% above its April 2025 low and 10% above its 30 December 2025 close, reflecting a marked year-to-date advance.
Past performance is not a reliable indicator of future results. Share prices are indicative and may differ from live market prices.
Eni (ENI): Capital.com analyst view
Eni S.p.A.'s (ENI) price performance over the past 12 months reflects a notable turnaround, with the stock recovering from a two-year low near €11.04 in April 2025 to trade around €23 as of 27 April 2026. That recovery has been supported by a sustained rise in Brent crude prices, Eni's Q1 2026 adjusted net profit of €1.302 billion, and the company's decision to nearly double its share buyback programme to €2.8 billion. Those same factors also carry risk, however: the elevated oil price environment is partly a function of Middle East supply uncertainty, and any de-escalation or deterioration in demand could reverse some of the tailwind that has supported the stock.
Eni's expanded upstream production, including a major offshore gas discovery in Indonesia announced in April 2026, adds a longer-term growth dimension. At the same time, Italy's broader macro backdrop has softened, with the Bank of Italy projecting GDP growth of just 0.5% for 2026, which could dampen domestic energy demand and weigh on investor appetite for Italian-listed equities. The stock's recovery also leaves it trading materially above where it began 2025, a factor that may influence how different market participants assess its current valuation.
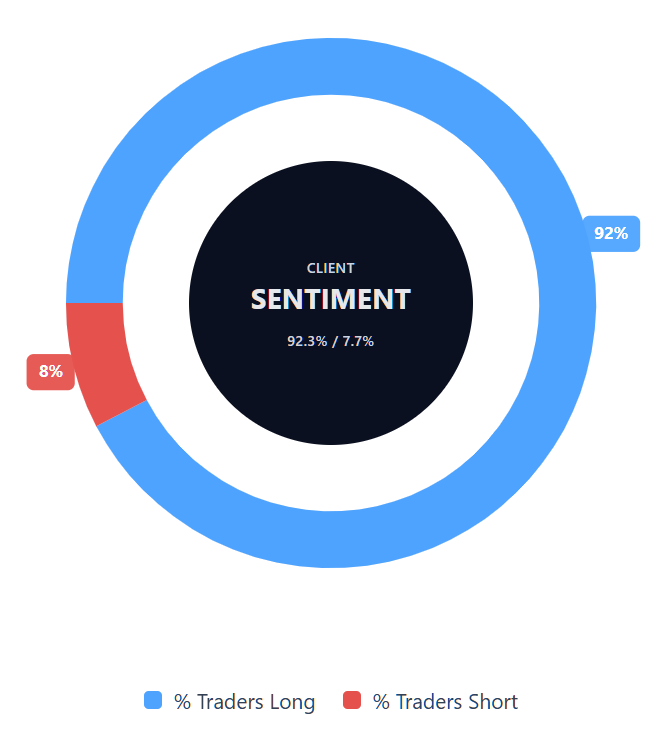
Capital.com’s client sentiment for Eni CFDs
As of 27 April 2026, Capital.com client positioning in Eni CFDs shows 92.3% buyers versus 7.7% sellers, leaving buyers ahead by 84.6 percentage points and placing sentiment firmly in one-sided territory. This snapshot reflects open positions on Capital.com at the time of capture and can change.
Summary – Eni 2026
- As of 2:19pm UTC on 27 April 2026, ENI trades at €23, within an intraday range of €22.92–€23.46 on Capital.com's quote feed.
- Key price drivers include elevated Brent crude prices amid Middle East supply uncertainty, Eni's expanded €2.8 billion buyback programme, and a 9% year-on-year rise in Q1 2026 hydrocarbon production.
- Recent news includes Eni's Q1 2026 results (24 April), a major offshore gas discovery in Indonesia (20 April), and Exane BNP Paribas upgrading ENI to Outperform on 17 April 2026.
Past performance is not a reliable indicator of future results.
FAQ
Who owns the most Eni S.p.A. stock?
What is the 5 year Eni S.p.A. share price forecast?
Is Eni S.p.A. a good stock to buy?
Could Eni S.p.A. stock go up or down?
Should I invest in Eni S.p.A. stock?
Can I trade Eni S.p.A. CFDs on Capital.com?
Yes, you can trade Eni CFDs on Capital.com. Trading share CFDs lets you speculate on price movements without owning the underlying asset and to take long or short positions. However, contracts for difference (CFDs) are traded on margin, and leverage amplifies both profits and losses. You should ensure you understand how CFD trading works, assess your risk tolerance, and recognise that losses can occur quickly.