Eni stock forecast: €4bn buyback approval
Eni’s May 2026 outlook reflects its €4bn buyback approval, 9% Q1 upstream production growth and exposure to Brent crude above $110. Explore third-party ENI price targets and technical analysis. Past performance is not a reliable indicator of future results.
Eni S.p.A. (ENI) is trading at €24 in early European trading as of 11:32am UTC on 18 May 2026, just above today's intraday range of €23.42–€23.98,
The share has been supported by a recovery in Brent crude oil, which was trading above $110 per barrel as of mid-May 2026, as disruption affected Strait of Hormuz shipping routes amid the US-Iran conflict (Fortune, 12 May 2026). At the company level, Eni's shareholders approved a share buyback programme of up to €4bn at the 6 May 2026 annual meeting (OilPrice.com, 6 May 2026). The first tranche is already under way, including the acquisition of 875,813 shares at a weighted average price of €22.84 on 8 May 2026 (Eni, 13 May 2026). Eni also posted Q1 2026 upstream production growth of 9% year on year, with the company citing stronger-than-expected cash generation despite wider energy market volatility (Reuters, 13 May 2026).
Eni stock: third-party analysts weigh buybacks and Brent crude
As of 18 May 2026, third-party Eni stock predictions show a more constructive view on the stock since late April 2026, following Eni's Q1 2026 earnings release, its raised capital return guidance, and the move in Brent crude.
Erste Group Bank (FY2026 EPS revision, Strong Buy)
Erste Group Bank analyst H. Engel trimmed the FY2026 EPS estimate for Eni to $5.94 from $6.06, while maintaining a Strong Buy rating in a note published. Engel also issued a FY2027 EPS estimate of $5.57. The revision reflected updated commodity price assumptions after Q1 2026 results fell marginally short of consensus expectations (MarketBeat, 11 May 2026).
DBS Bank (rating upgrade, Moderate Buy)
DBS Bank upgraded Eni's NYSE-listed shares (ticker: E) from Hold to Moderate Buy, citing improved confidence in the stock's risk/reward profile at current levels. The upgrade aligns with the broader shift in analyst sentiment following Eni's guidance upgrade and continued share buyback activity. MarketBeat's consensus target of $42.30 reflects coverage from 14 analysts (MarketBeat, 1 May 2026).
MarketBeat (Wall Street consensus, 16 May 2026)
MarketBeat's aggregated coverage of 14 Wall Street analysts assigns Eni (NYSE: E) an average 12-month price target of $42.30, within a range of $28–$64.30, alongside a Moderate Buy consensus rating. The six Buy and three Strong Buy ratings outweigh the five Hold ratings, while the wide target spread reflects differing assumptions on Brent crude, Eni's satellite structure, and energy transition execution (MarketBeat, 16 May 2026).
MarketScreener (multi-broker consensus, BIT: ENI)
MarketScreener's panel of 21 analysts covering Eni's Milan-listed shares assigns an average 12-month price target of €25.33, with a high estimate of €30. The mean consensus rating stands at Outperform, with the average target sitting approximately 7.7% above the then-prevailing close of €23.52. This comes amid broadly positive broker sentiment on Eni's raised 2026 cash flow guidance and expanded buyback programme (MarketScreener, 17 May 2026).
Investing.com (analyst consensus, BIT: ENI)
Investing.com's consensus screen, drawing on 22 analysts covering the Milan-listed shares, places the average 12-month price target at €25.33, with a high estimate of €30 and an overall Buy consensus comprising 11 Buy and 12 Hold ratings. The data reflects post-Q1 2026 revisions, with analysts weighing Eni's upgraded operating guidance and upstream production growth against its continued sensitivity to Brent crude price movements (Investing.com, 16 May 2026).
Predictions and third-party forecasts are inherently uncertain, as they cannot fully account for unexpected market developments. Past performance is not a reliable indicator of future results.
Eni earnings: Q1 2026 results and upcoming dates
Eni reported its Q1 2026 financial results on 23 April 2026, posting upstream production growth of 9% year on year, though adjusted net profit came in slightly below analyst expectations. Despite the earnings miss, Eni raised its 2026 operating cash flow guidance by 20%, citing stronger commodity prices and sustained operational performance across its exploration and production portfolio (Investing.com, 24 April 2026).
At the annual general meeting held on 6 May 2026, shareholders approved a share buyback programme of up to €4bn, with the first tranche already under way. The board also confirmed CEO Claudio Descalzi for a record fifth term, providing continuity as Eni advances its multi-energy transition plan through 2030 (Eni, 7 May 2026).
Erste Group Bank revised its FY2026 earnings per share estimate to $6.06 from $4.32 following the Q1 release, identifying the guidance upgrade and production momentum as the main drivers of its upward revision (MarketBeat, 30 April 2026). Eni's next scheduled results update is the Q2 2026 report, with the Board of Directors meeting set for 28 July 2026 and results due on 29 July 2026 (Eni, 18 May 2026).
ENI stock price: Technical overview
The ENI stock price trades at €24 as of 11:32am UTC on 18 May 2026, holding above its key moving-average cluster. The 20/50/100/200-day simple moving averages sit at approximately €21 / €19.30 / €19 / €18.60, with price trading above all four levels, according to TradingView data.
Momentum indicators also point to a positive near-term technical picture. The 14-day relative strength index reads 64.66, placing it below the commonly watched overbought threshold of 70. The average directional index at 31.15 signals an established trend, consistent with directional momentum rather than a ranging environment.
On the topside, the classic R1 pivot at €22.05 represents the nearest reference above the current price; a daily close above that level would put the R2 area near €24.14 in view. The Hull moving average (9-period) at €23.33 sits between those two levels and may act as an intervening reference.
On pullbacks, the classic pivot point at €19.59 marks initial support, followed by the 50-day simple moving average near €19.30. Losing that moving-average shelf could bring the 100-day simple moving average near €19 into focus and, if that gives way, the S1 classic pivot at €17.50 (TradingView, 18 May 2026).
This is technical analysis for informational purposes only and does not constitute financial advice or a recommendation to buy or sell any instrument.
Eni share price history (2024–2026)
ENI’s stock price closed at approximately €14.74 in late May 2024, trading in a relatively narrow band through the summer as oil prices remained rangebound and Italy's broader fiscal backdrop kept investor appetite cautious. The stock drifted lower into year-end, closing 2024 near €13.10, as Brent crude softened and energy sector sentiment weakened across European markets.
2025 opened at €13.50 and spent much of the first half oscillating between roughly €13 and €14.50, with the main move arriving in early April. A broad global equity sell-off tied to the announcement of sweeping US tariffs dragged ENI to a two-year low of €11.28 on 9 April 2025; shares had recovered to around €14.34 by 2 April, only to fall through that level in the subsequent rout. From there, the stock rebuilt steadily through the summer and autumn, reaching a 2025 high of €16.61 in November, before closing the year near €16.18 – a gain of roughly 23% from January's open.
2026 has brought larger price moves. Shares opened at €16.44 in January and climbed sharply, reaching a period high of €24.85 on 7 April 2026, before easing back towards the €22–€23 area in early May amid volatility in crude markets.
ENI closed at €23.94 on 18 May 2026, approximately 45.6% up year to date and approximately 82.5% up year on year.
Past performance is not a reliable indicator of future results. Share prices are indicative and may differ from live market prices.
Eni (ENI): Capital.com analyst view
Eni's price performance over the past year reflects the competing forces shaping a major integrated energy company in a volatile commodity environment. The near-doubling of the share price since May 2025 – from approximately €13.12 to €23.94 – coincides with a sharp rally in Brent crude, Eni's expanded buyback programme of up to €4bn, and the company's Q1 2026 upstream production growth of 9% year on year. These factors have supported a more constructive view on the stock. However, the same oil-price sensitivity that lifted ENI on the way up represents a meaningful two-sided risk. A reversal in crude, driven by weaker global demand, rising OPEC+ supply, or a broader risk-off move, could place pressure on revenues and earnings, as the Q1 2026 earnings miss illustrated.
Eni's ongoing energy transition strategy and diversified asset base, spanning LNG, renewables, and upstream exploration, may offer some insulation from pure oil-price swings. Its shareholder returns policy also adds a layer of fundamental support. That said, geopolitical exposure across key producing regions and structural uncertainty around long-term hydrocarbon demand remain risks that could weigh on sentiment, even when near-term financials appear constructive.
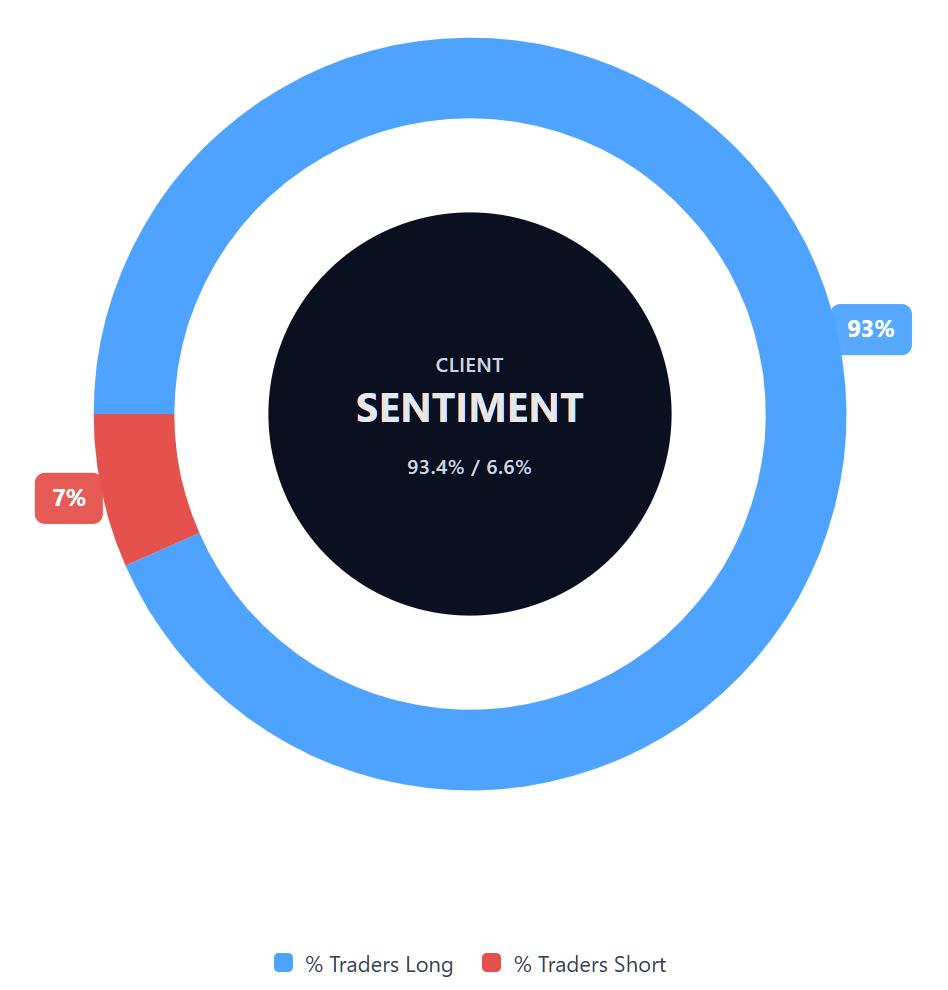
Capital.com’s client sentiment for Eni CFDs
As of 18 May 2026, Capital.com client positioning in Eni CFDs stands at 93.4% buyers versus 6.6% sellers, putting buyers ahead by 86.8 percentage points and indicating a strong long bias among open client positions. This snapshot reflects open positions on Capital.com at the time of writing and can change rapidly as market conditions evolve.
Summary – Eni 2026
- ENI trades at €24 as of 11:32am UTC on 18 May 2026, up approximately 45.6% year to date and around 82.5% year on year.
- Technical indicators lean constructive: the 14-day relative strength index reads 64.66, the average directional index at 31.15 signals an established trend, and price holds above all key moving averages.
- Key price drivers include Brent crude movements, Eni's €4bn share buyback programme, and a 9% year-on-year upstream production increase reported in Q1 2026.
- Eni shareholders re-elected CEO Claudio Descalzi for a record fifth term at the 6 May 2026 AGM, providing leadership continuity alongside the expanded buyback.
Past performance is not a reliable indicator of future results.
FAQ
Who owns the most Eni S.p.A. stock?
What is the five-year Eni S.p.A. share price forecast?
Is Eni S.p.A. a good stock to buy?
Could Eni S.p.A. stock go up or down?
Should I invest in Eni S.p.A. stock?
Can I trade Eni S.p.A. CFDs on Capital.com?
Yes, you can trade Eni CFDs on Capital.com. Trading share CFDs lets you speculate on price movements without owning the underlying asset and to take long or short positions. However, contracts for difference (CFDs) are traded on margin, and leverage amplifies both profits and losses. You should ensure you understand how CFD trading works, assess your risk tolerance, and recognise that losses can occur quickly.