What is the flag pattern and how does it work?

Learn how to recognise and trade the flag pattern – a short-term chart formation that can help you identify potential trend continuations in financial markets.
What is a flag pattern in trading?
 A flag pattern is a short-term chart formation in technical analysis that suggests a potential continuation of the prevailing trend – bullish or bearish – after a brief consolidation.
It begins with a sharp price move that forms a steep flagpole. This is followed by a short period of consolidation, where prices drift sideways or slightly against the trend, creating a compact, flag-like shape.
A breakout from this consolidation – often on increased volume – can signal a resumption of the original trend, offering traders potential entry opportunities aligned with market momentum.
How can you identify a flag pattern?
You can identify a flag pattern by observing its phases:
-
Flagpole – the initial sharp price movement.
-
Flag – a subsequent period of consolidation.
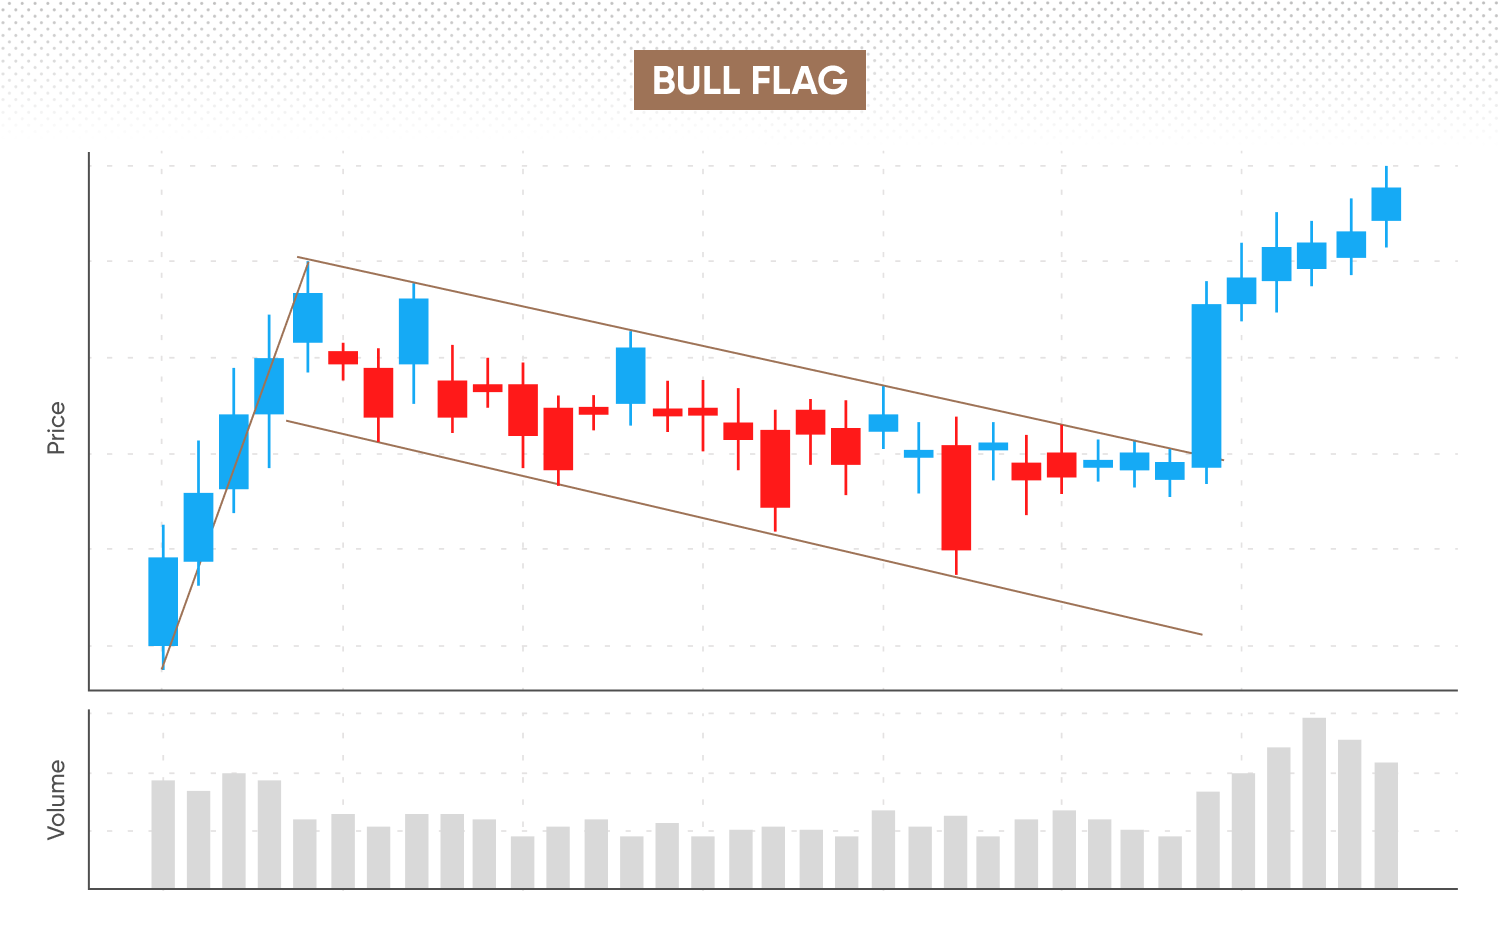
1. Flagpole
A sudden, significant price move – measured from the start to its peak – forms a steep, distinctive flagpole, supported by strong momentum and typically increasing volume. When you trade contracts for difference (CFDs), you might use the flagpole to help estimate bullish or bearish price targets after the potential breakout.
2. Flag
Prices briefly consolidate within a narrow channel, tilting against the direction of the previous trend. Drawing a line across the highs serves as a resistance level, while a line across the lows acts as support. The flag forms between these near-parallel trendlines.
Confirmation
To confirm the flag pattern, look for a decisive breakout from this channel in the direction of the original flagpole. Ideally, this breakout is accompanied by increased volume, indicating a resumption of the initial trend and suggesting a potential entry point.
What are the main types of flag trading patterns?
Flag trading patterns can be either bullish or bearish depending on the direction of the preceding trend and breakout. Here’s a comparison:
|
Direction |
Flag slope |
Breakout signal |
|
|
Bullish flag |
Uptrend (bullish move) |
Slightly downward or horizontal |
Breakout above upper flag boundary |
|
Bearish flag |
Downtrend (bearish move) |
Slightly upward or horizontal |
Breakout below lower flag boundary |
Bull flag
Bull flags can form in rising markets when:
-
The price makes a significant upward move (flagpole) – followed by a mild, downward-sloping or flat consolidation phase (flag).
-
A breakout could occur if the price moves above the upper trendline of the flag (resistance), indicating the potential for the original uptrend to resume.
Bear flag
Bear flags may emerge in falling markets:
-
The price makes a substantial downward move (flagpole) – followed by a mild, upward-leaning or flat consolidation phase (flag).
-
The pattern is confirmed when the price breaks below the lower trendline (support), suggesting the potential for a continuation of the downtrend.
What about horizontal flags?
While most classic flag patterns have a slight tilt against the trend, some flags appear more horizontal. Horizontal flags are traded much like their sloping counterparts, though traders may look for clearer volume signals or additional confirmation before taking action. They can indicate a period of market consolidation, and the general rules for confirmation – observing a breakout in the direction of the original trend – still apply.
What do flag patterns tell traders?
In technical analysis, a textbook flag pattern represents a brief consolidation period where price momentum briefly stalls, allowing traders to reassess their positions before the trend potentially resumes.
The consolidation phase reflects balanced market sentiment, as neither buyers nor sellers dominate trading. Volume declines during this period, indicating reduced activity and market hesitation, but increases sharply upon a valid breakout, providing traders with important confirmation signals. Traders look for decisive breakout from the flag’s channel to confirm the pattern.
Past performance is not a reliable indicator of future results.
How do traders use flag patterns in real trading?
When trading flag patterns, define clear entries and exits, support and resistance, and risk management parameters. Here’s a step-by-step:
1. Entry points
Most traders enter positions just after the breakout, when the price closes decisively outside either flag boundary in the trend’s original direction. These boundaries indicate potential support and resistance levels. For a bull flag, that means entering when price closes firmly above the upper boundary (resistance); for a bear flag, below the lower boundary (support).
2. Risk management
Effective risk management can limit potential losses, whilst locking-in potential gains. For instance, in a bullish setup, a stop-loss is commonly placed just below the lowest recent swing low within the consolidation. Another approach would be to set a take-profit order at a predetermined level, such as the estimated length of the flagpole projected upward from the breakout point, to lock in potential gains. Standard stop-loss and take-profit orders aren’t guaranteed. However, guaranteed stop-losses (GSLOs) ensure your trades are exited at the price you specify – although GSLOs incur a fee when activated.
3. Setting profit targets
Another common approach is to set a profit target using the height of the flagpole – the initial sharp move leading into the consolidation – as a guide. Traders measure this distance and project it from the breakout point to establish a realistic price objective. Some prefer alternative methods, such as fixed risk-to-reward ratios (e.g., 1:2).
Discover technical indicators and chart formations for CFD traders
Chart examples: Bull vs bear flags
Traditional investors might focus on bullish flag scenarios, which signal potential upward price movements. However, as CFDs let you speculate on rising and falling markets, CFD traders may take a position during both bullish and bearish flag scenarios.
Here’s a hypothetical example for each:
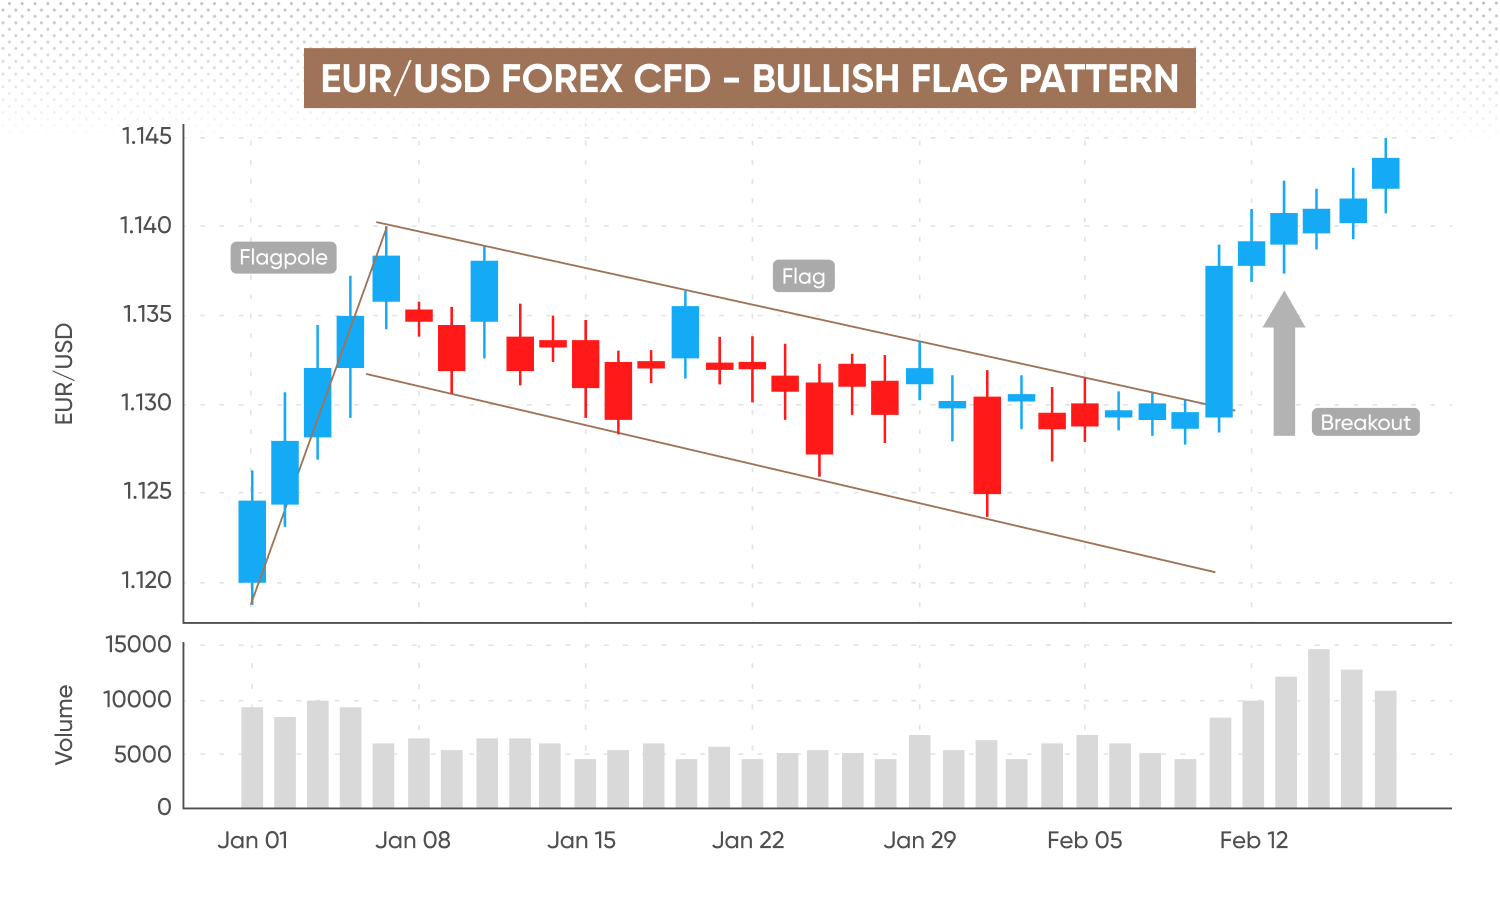
EUR/USD forex CFD – bullish flag pattern
Consider the following forex CFD scenario. This is an example, and doesn’t reflect actual price movements.
-
Formation – EUR/USD forms a clear flag pattern. After a four-day rally from 1.120 to 1.140 (flagpole), the price consolidates between highs and lows which decline at a similar angle over five weeks, resulting in two almost-parallel trendlines.
-
Volume confirmation – during the consolidation, trading volumes may decline, reflecting market uncertainty and reduced trading activity.
-
Breakout – EUR/USD breaks decisively above the flag’s upper trendline at 1.130, accompanied by rising volume. The pattern is confirmed when the price resumes the prior trend.
Conversely, if EUR/USD had broken below the lower trendline at 1.120, it would indicate the pattern had invalidated, potentially warning traders of weakening bullish sentiment.
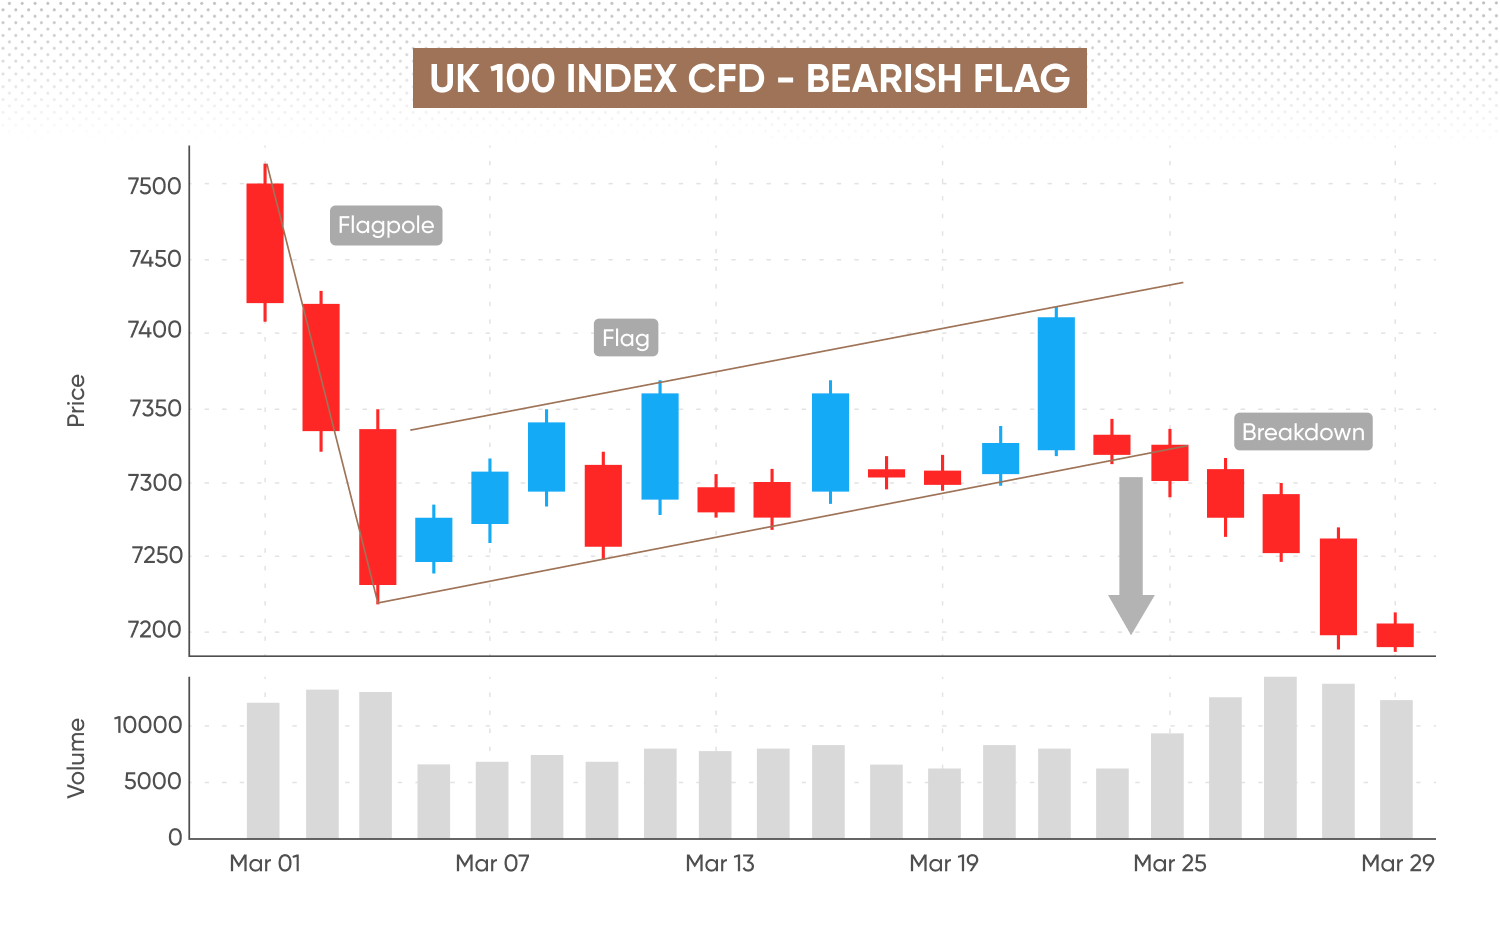
UK 100 index CFD – bearish flag pattern
Now, let’s examine a hypothetical indices CFD scenario:
-
Formation – the UK 100 index drops from 7,500 to 7,200 in three days, creating a distinct flagpole. The price then consolidates between rising highs and lows which form almost parallel, upward-sloping trendlines.
-
Volume confirmation – during this consolidation, volume may decrease, suggesting market indecision and a temporary easing in selling pressure.
-
Breakdown – the UK 100 subsequently breaks below the flag’s lower trendline at around 7,150, with increasing volume, indicating a possible continuation of the downtrend. The bear flag is confirmed when the price continues its downtrend.
When you trade on Capital.com, you’re speculating on financial markets using CFDs – without actually owning the underlying asset. CFDs are traded with margin, and leverage can amplify any potential losses/gains.
How reliable is the flag pattern?
While the flag pattern can be a useful indicator, no technical setup is completely reliable – and various factors can influence the effectiveness of flags:
-
Market context and strength of trend: patterns emerging within strong, clear trends are considered higher-probability setups. Flags forming in weak, choppy, or sideways markets are regarded as less dependable, potentially increasing the risk of false signals.
-
Flag duration and clarity: reliable flags can emerge on any timeframe, however they traditionally form over several days or weeks. Very short-term flags – lasting only a few candles – may produce less reliable signals due to increased market noise. Overly prolonged consolidation periods might indicate weakening momentum or indecision, possibly decreasing the likelihood of a strong breakout.
-
Additional confirmation: combining flag patterns with other technical indicators – such as moving averages, RSI, or Fibonacci retracements -- may support their effectiveness.
Boost your trading knowledge further with our market trading guides.
Common mistakes when trading flag patterns
Here are some frequent pitfalls to avoid:
Confusing flags with rectangles
Flag patterns could be mistaken for rectangles because both involve price consolidation within parallel trendlines. However, while rectangles can sometimes act as continuation or reversal patterns depending on the context, they generally lack a clear preceding surge.
-
Rectangles typically reflect longer periods of sideways consolidation without a preceding sharp price move, unlike flags.
-
Flags begin with a noticeable, rapid price movement – the flagpole – indicating strong market momentum.
Entering trades without volume confirmation
Another common error is to enter a trade based solely on price breakouts, without verifying volume support. Volume may decline during the flag’s consolidation phase, then increase significantly on breakout, confirming renewed momentum. Ignoring volume can lead traders into false breakouts – brief spikes that quickly reverse. Always consider whether there is increased volume at the breakout to help reduce the likelihood of false signals.
Misjudging the slope of the flag
Flags typically slope gently against the initial trend – downward in a bullish trend and upward in a bearish trend. Traders sometimes mistakenly trade steeply sloped channels or horizontal consolidation as classic flags, which can alter the pattern's reliability. While a gentle slope is most common, horizontal flags can also occur. Steeply sloped flags may suggest weakening momentum or a potential reversal rather than continuation. Recognising proper flag structure helps traders choose higher-quality setups.
FAQ
What is the flag pattern rule?
The flag pattern rule is a guideline used to identify potential continuation setups. After a strong price move – known as the flagpole – a brief consolidation phase forms the flag itself. The key rule is to wait for a breakout from this channel, ideally in the same direction as the flagpole. Traders often set a price target by measuring the length of the flagpole and projecting it from the breakout point, but this isn’t guaranteed. Volume confirmation and prudent risk management remain important.
How do I identify a flag pattern?
A flag pattern is defined by its structure: first, a sharp price movement creates the flagpole, followed by a tight, sloping channel running against the initial move. Bull flags slope gently down or sideways after an uptrend, while bear flags slope up or sideways after a downtrend. Traders often regard the pattern as valid when price breaks out in the direction of the original trend, sometimes accompanied by increased volume. Be wary of consolidations without a clear flagpole – these may not qualify as true flag patterns.
What do different flag patterns mean?
Different flag patterns indicate the likely continuation of the existing trend. A bull flag suggests a pause before potential further gains, while a bear flag points to a brief rebound before possible further declines. Both patterns may mark a market pausing before the trend resumes, but neither guarantees an outcome. Always look for confirmation and consider the broader market context before making decisions.
Is a flag pattern bullish or bearish?
Flag patterns can be either bullish or bearish, depending on the prevailing trend they form in. A bull flag forms during an uptrend and is generally seen as bullish, hinting that buyers may remain in control. A bear flag develops in a downtrend, which may suggest continued selling pressure. In both cases, confirmation is advisable, and combining the pattern with other tools can provide additional context.