差价合约 (CFD) 是一种复杂的金融工具,利用杠杆交易虽然可能放大收益,但同样也会加剧亏损风险,导致资金快速流失。
数据显示,
78.48% 的散户投资者在使用该提供商服务进行差价合约交易时出现账户亏损。
在进行交易之前,请确保您充分了解差价合约的运作机制,并仔细评估自己是否有能力承担资金亏损的高风险。
交易
交易
差价合约 (CFD)交易
模拟交易
专业账户
平台
网页版平台
手机 App
TradingView
MT4
MT5
学习
交易策略
技术分析
交易心理
学习
市场
我们的市场
市场
股票
外汇
指数
大宗商品
加密货币
债券
利率
市场洞察
市场分析
定价
关于我们
关于我们
公司简介
我们的办公室
Capital.com 安全吗?
我们的商业模式
与我们合作
合作伙伴计划
推荐好友
帮助
帮助
客户脆弱性
联系我们
法律信息
条款和政策
投诉
登录
开立账户
zh
登录
开立账户
开立账户
打开平台
打开平台
本地支持。
全球连通。
本平台由巴哈马证券委员会 (SCB) 授权并监管
洞察市场、
明智交易
全球范围
差价合约 (CFD) 交易平台
5500+ 交易品种
开立账户
Android
iOS
MT4
MT5
TradingView
网页终端
5500+ 交易品种
一个决策环境
探索 CFD 市场
大宗商品
Gold
Oil - Crude
Silver
Oil - Brent
Natural Gas
US Cocoa
GCQ2026
Copper
CLQ2026
Gasoil
Platinum
Coffee Arabica
LCOU2026
Palladium
65 +
市场
加密货币
BTC/USD
XRP/USD
ETH/USD
DOGE/USD
SOL/USD
PEPE/USD
ESPORTS/USD
XLM/USD
RIZE/USD
MYX/USD
ADA/USD
SHIB/USD
BABYDOGE/USD
DOT/USD
450 +
市场
股票
SPCX
MU
TSLA
MSTR
NVDA
SNDK
AMD
MSFT
PLTR
INTC
MRVL
SMCI
AAPL
NFLX
4,500 +
市场
债券
US
FOATU2026
TY
USU2026
TYU2026
FLGU6
FGBXU2026
FGBSU2026
FGBMU2026
FBTSU2026
TU
FV
SJBU2026
FBTPU2026
20 +
市场
ETF
SOXL
QQQ
SPY
IVV
VOO
SQQQ
TQQQ
SMH
SOXX
AGQ
UVIX
UVXY
GDXJ
XLK
650 +
市场
指数
US100
J225
US30
US500
DE40
HK50
RTY
NQU2026
UK100
JNMU2026
FR40
HSTECH
VIX
CN50
35 +
市场
利率
FEIU2026
FEIZ2026
FEIH2027
SON3H2027
SON3M2026
SON3U2026
SON3Z2026
FF
SRA
10 +
市场
Gold
Oil - Crude
Silver
Oil - Brent
Natural Gas
US Cocoa
GCQ2026
Copper
CLQ2026
Gasoil
Platinum
Coffee Arabica
LCOU2026
Palladium
65 +
市场
BTC/USD
XRP/USD
ETH/USD
DOGE/USD
SOL/USD
PEPE/USD
ESPORTS/USD
XLM/USD
RIZE/USD
MYX/USD
ADA/USD
SHIB/USD
BABYDOGE/USD
DOT/USD
450 +
市场
SPCX
MU
TSLA
MSTR
NVDA
SNDK
AMD
MSFT
PLTR
INTC
MRVL
SMCI
AAPL
NFLX
4,500 +
市场
US
FOATU2026
TY
USU2026
TYU2026
FLGU6
FGBXU2026
FGBSU2026
FGBMU2026
FBTSU2026
TU
FV
SJBU2026
FBTPU2026
20 +
市场
SOXL
QQQ
SPY
IVV
VOO
SQQQ
TQQQ
SMH
SOXX
AGQ
UVIX
UVXY
GDXJ
XLK
650 +
市场
US100
J225
US30
US500
DE40
HK50
RTY
NQU2026
UK100
JNMU2026
FR40
HSTECH
VIX
CN50
35 +
市场
FEIU2026
FEIZ2026
FEIH2027
SON3H2027
SON3M2026
SON3U2026
SON3Z2026
FF
SRA
10 +
市场
大宗商品
加密货币
股票
债券
ETF
指数
利率
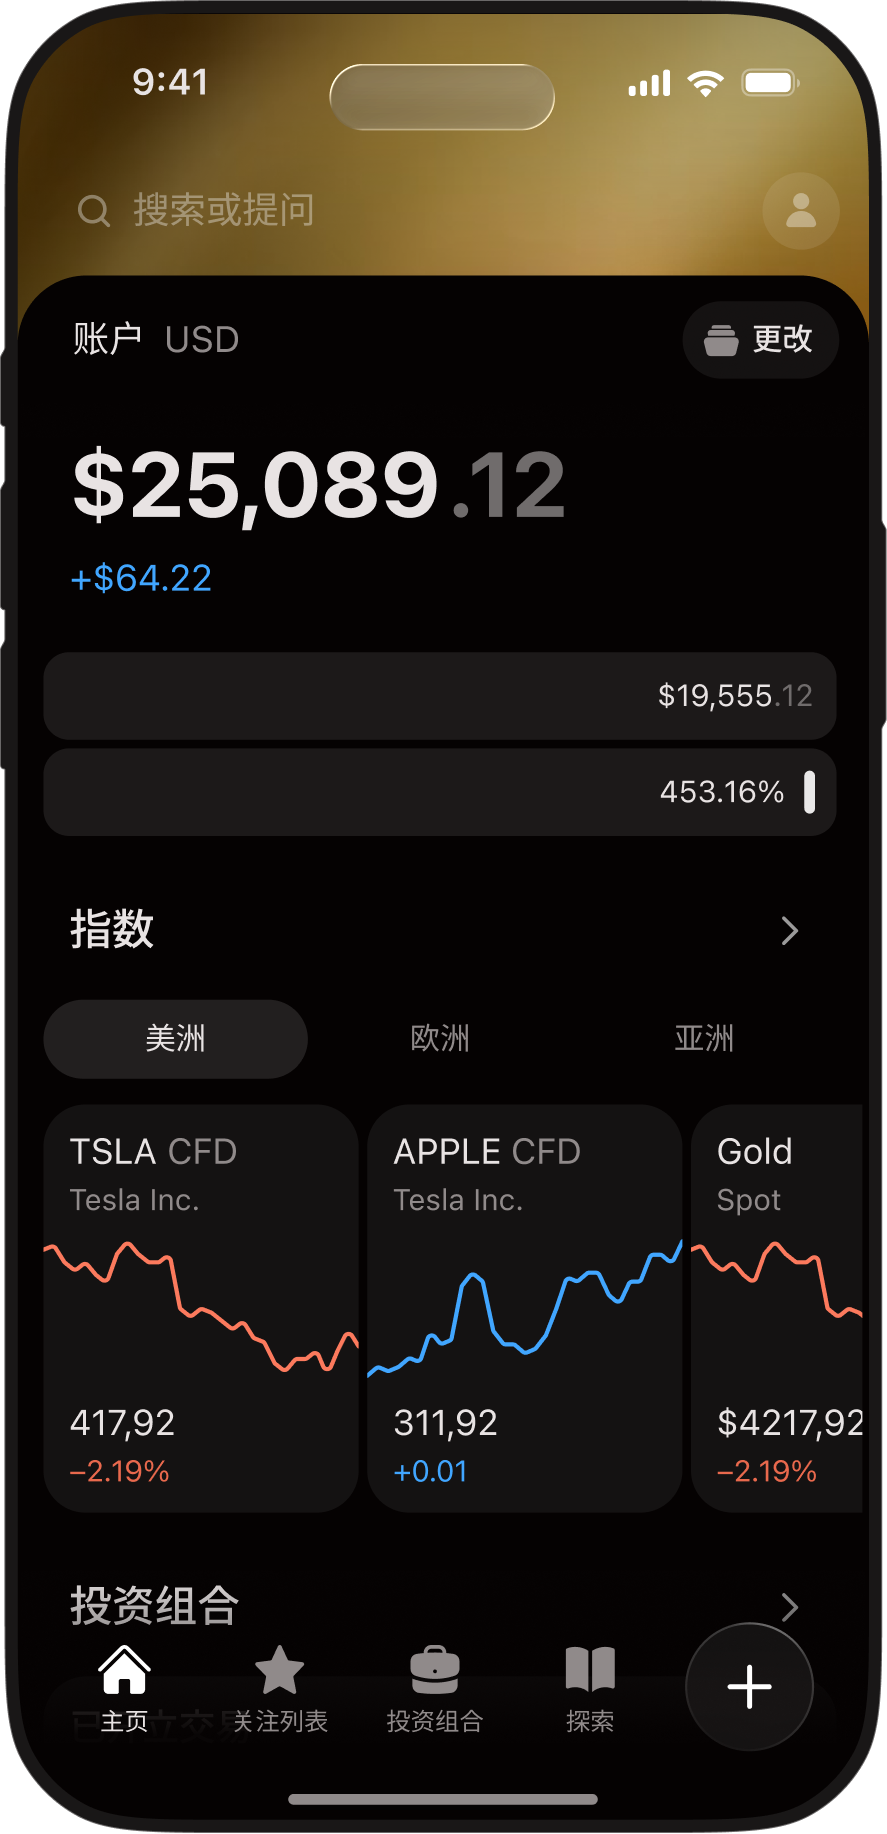
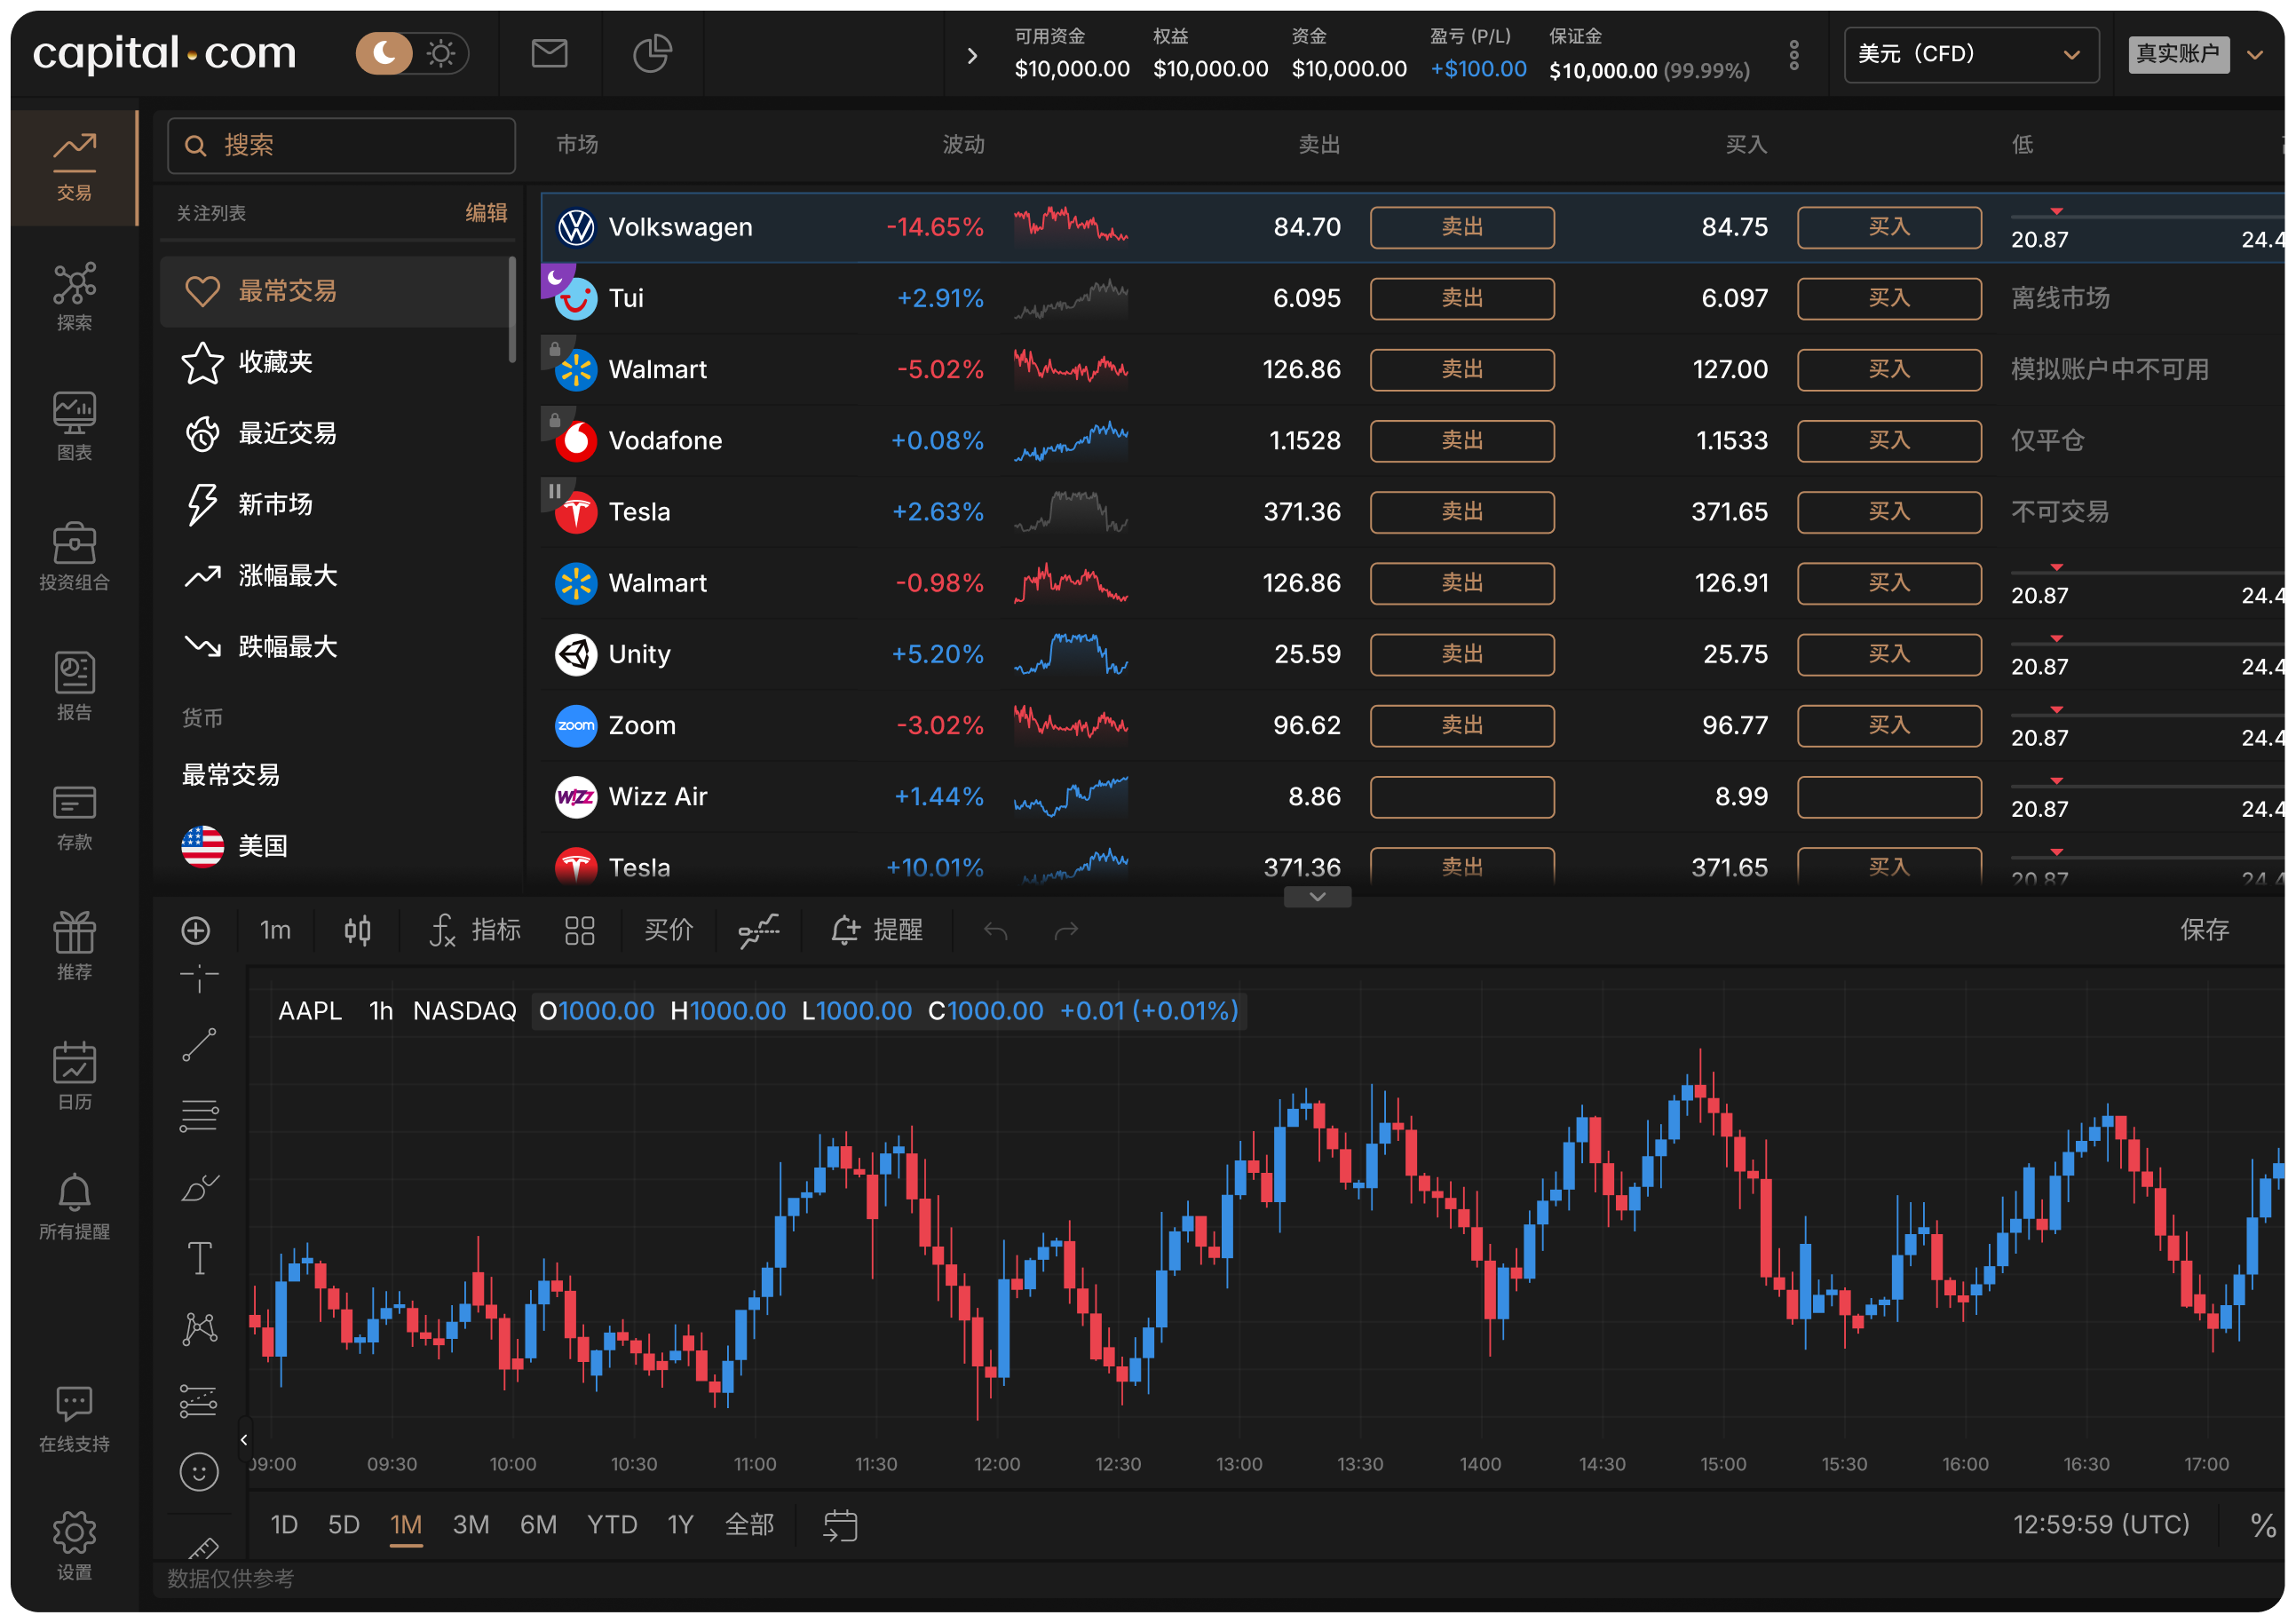
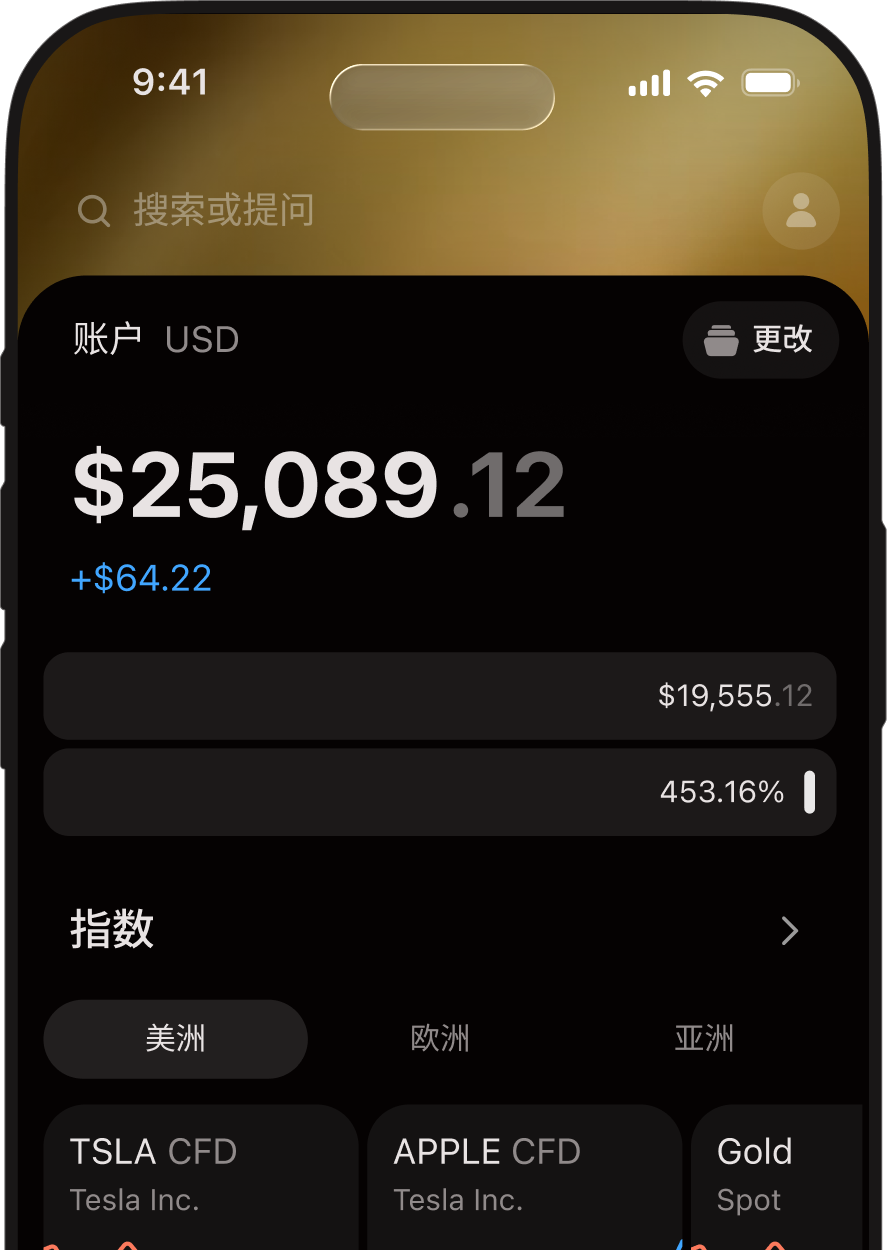
不同页面,
同一系统。
多平台、全市场、任意设备。为您打造方便智能的交易环境。
透明的费用结构,让您安心交易
我们的收益来自已执行交易中的点差
清晰透明、一目了然。
无手续费存款和提款
安全的支付方式。支持银行转账、银行卡和数字钱包。
我们的完整费用结构可在我们的
收费及费用页面查阅。
大多数交易者都会亏损
市场环境会影响投资结果
但真正拉开差距的,是每一次决策
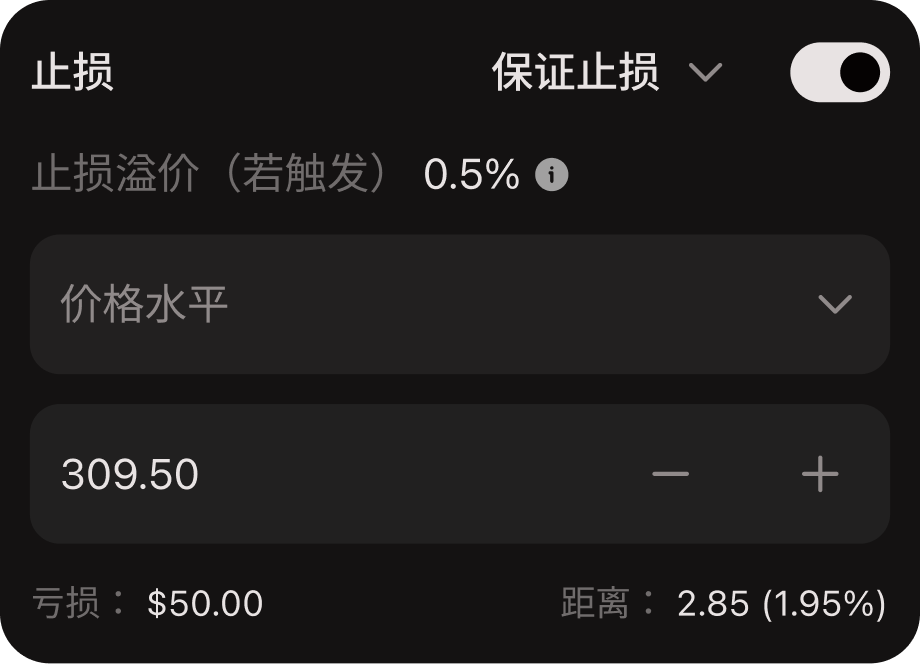
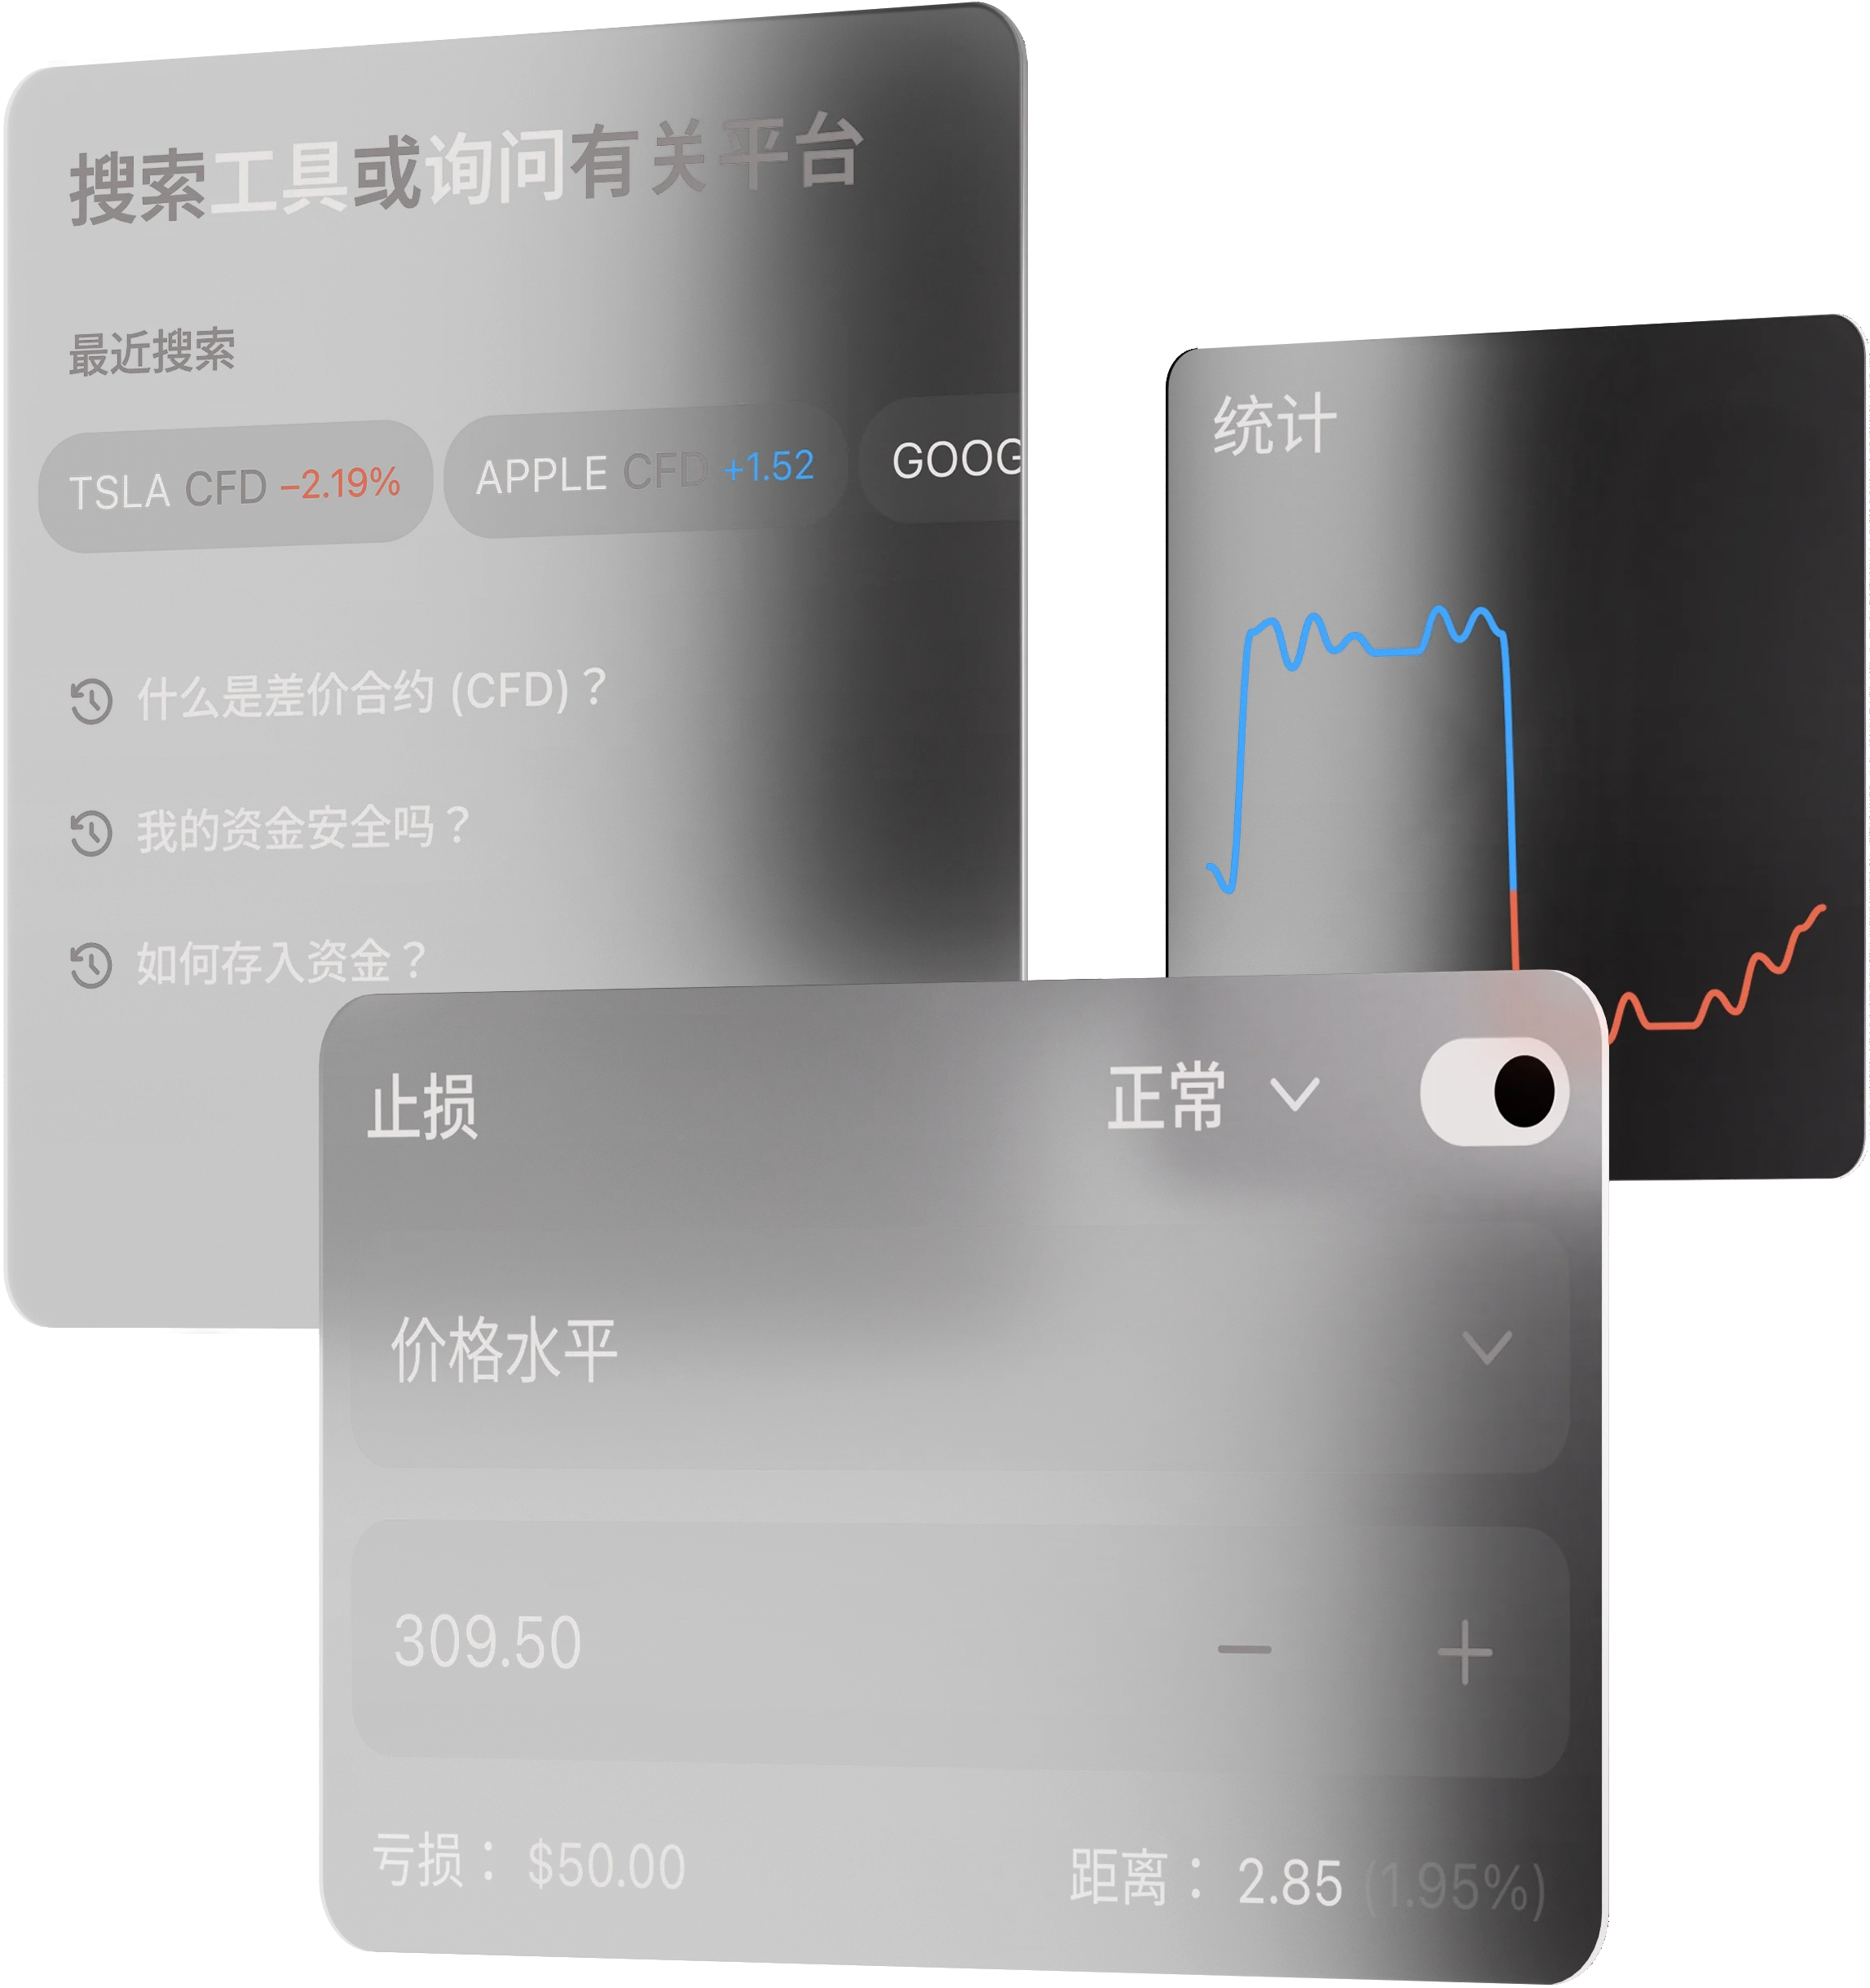
蓄势待发。
处变不惊。
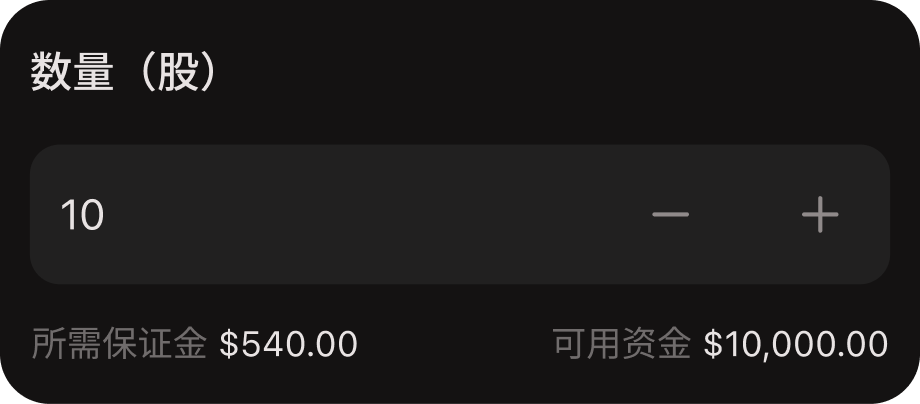
交易前设置止损
选择杠杆
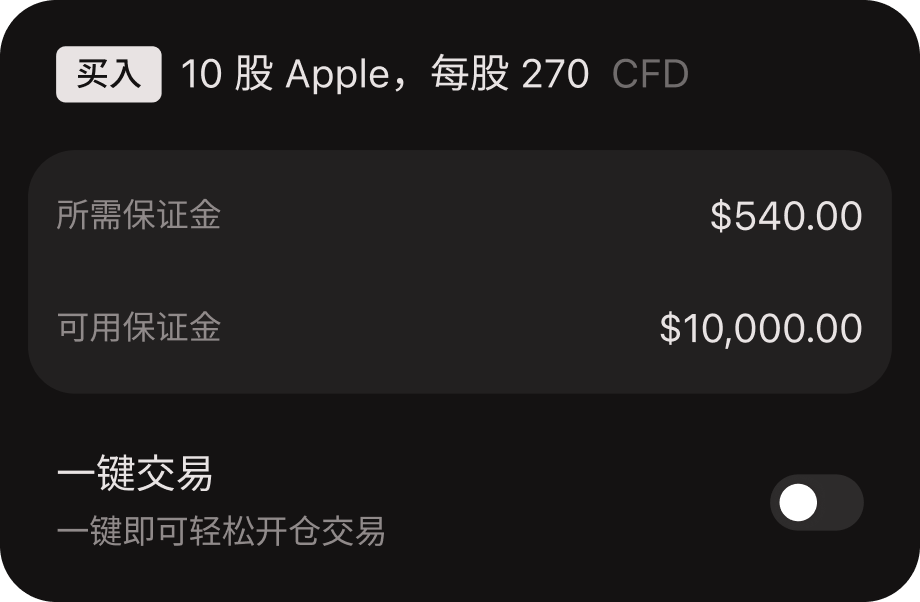
确认订单
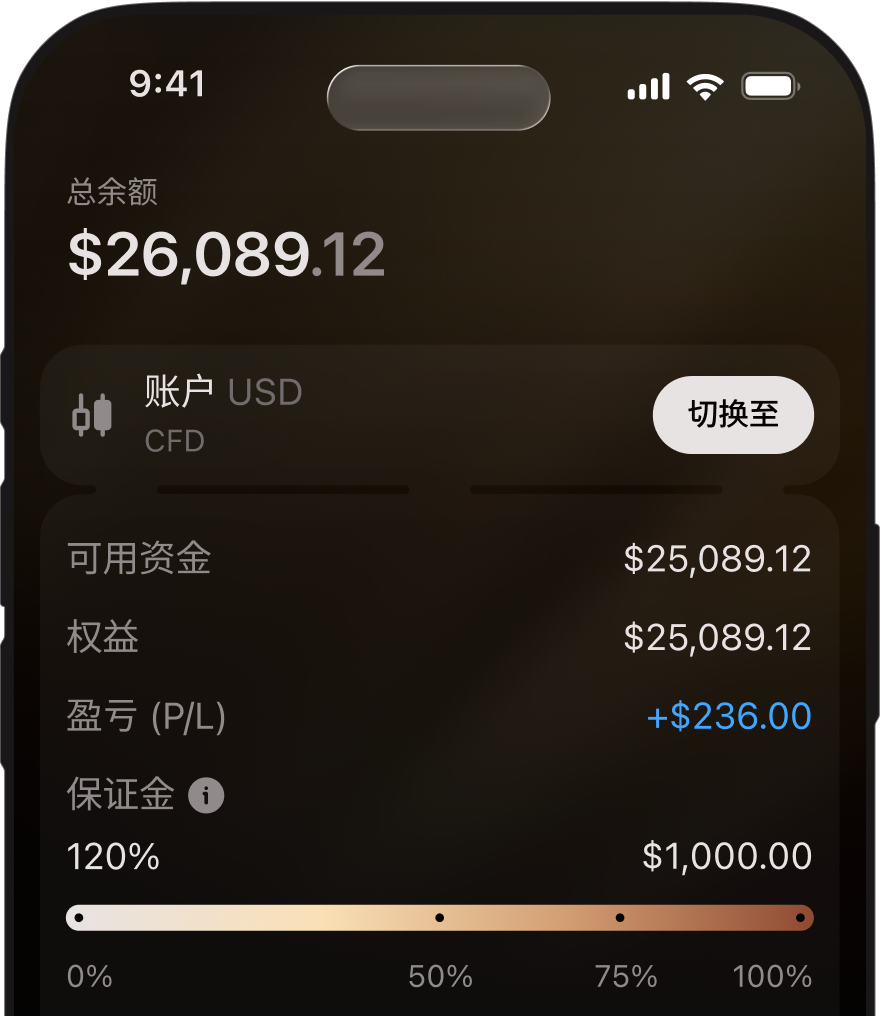
数据会说话。
信任,同样经得起验证。
4.7
评分与评价
4.7
评分与评价
4.6
TradingView
4.6
Trustpilot
4.7
评分与评价
4.7
评分与评价
4.6
TradingView
4.6
Trustpilot
4.7
评分与评价
4.7
评分与评价
4.6
TradingView
4.6
Trustpilot