

SpaceX share price: first public earnings report
SpaceX is due to report its first quarterly results as a public company on 4 August 2026, ahead of a lock-up expiry that could make 911.5m insider shares eligible for sale. Explore third-party SPCX price targets and technical analysis. Past performance is not a reliable indicator of future results.
Space Exploration Technologies Corp (SPCX) last traded at $119.34, within an intraday range of $105.92–$119.47, near the upper end of the session’s range in early-afternoon trading at 3.04pm UTC on 4 August 2026. Past performance is not a reliable indicator of future results.
Investors are positioning ahead of SpaceX's first quarterly earnings report as a public company, due after the market close on 4 August 2026, with a live audio-only webcast to follow at 4.30pm ET, available via the company's investor relations site (CNBC, 4 August 2026). Attention is also focused on the insider share lock-up expiration on 6 August 2026, which could make up to 20% of restricted shares – roughly 911.5 million – eligible for sale (Reuters, 16 July 2026). Trading has been volatile ahead of these events, while the company's valuation has remained under scrutiny following its record $85.7bn IPO in June (The Wall Street Journal, 28 July 2026).
Third-party SpaceX outlook: earnings and share unlock
As of 4 August 2026, third-party SpaceX share price predictions span a wide range of outcomes. Near-term projections focus largely on the potential effect of the lock-up expiration, while 12-month targets reflect differing views on SpaceX's longer-term growth prospects.
Morgan Stanley: scenario analysis
Morgan Stanley identifies a scenario in which SpaceX shares could fall towards $100 when the lock-up expires on 6 August 2026, as additional insider shares become eligible for trading. The bank notes that at that level, the market would effectively be assigning zero value to the company's AI segment, while it reiterates a bullish $300 price target overall (MarketBeat, 24 July 2026).
Finbold: AI-generated forecast
Finbold's AI Agent projected that SpaceX shares could close at around $118 by 1 August 2026, representing a decline from the prior week's close, as the model factored in continued price weakness ahead of the company's first earnings report and lock-up expiration (Finbold, 20 July 2026).
MarketScreener: analyst consensus
MarketScreener places the average 12-month price target at $236.71 across 10 analysts, with a mean rating of Outperform, assuming growth in Starlink and demand for AI infrastructure could offset near-term valuation concerns linked to the stock's post-IPO decline (MarketScreener, 27 July 2026).
StockAnalysis: consensus overview
StockAnalysis reports an average 12-month price target of $230.10 across 30 analysts, with estimates ranging from $115 to $800, a broad range that highlights the uncertainty surrounding SpaceX's valuation as analysts weigh its longer-term growth potential against execution and valuation risks (Zacks, 1 August 2026).
MarketBeat: consensus rating
MarketBeat's consensus points to a 12-month price target of $239.12 based on 35 Wall Street analysts, with a Moderate Buy rating comprising 27 buy-oriented ratings, seven holds and one sell, a target that remains well above recent trading levels despite differing assessments of SpaceX's longer-term prospects and near-term risks surrounding the lock-up expiration (MarketBeat, 1 August 2026).
Predictions and third-party forecasts are inherently uncertain, as they cannot fully account for unexpected market developments. Past performance is not a reliable indicator of future results.
SpaceX upcoming earnings: what to watch on 4 August 2026
SpaceX is scheduled to release its second-quarter 2026 financial and operational results after the market closes on 4 August 2026 (CNBC, 21 July 2026). The announcement will mark its first earnings report as a public company since its Nasdaq listing on 12 June 2026 (Reuters, 3 August 2026). Management will host a live, audio-only webcast at 4.30pm ET, with pre-registration and replays available through the company's investor relations site (SpaceX Investor Relations, 21 July 2026).
Wall Street estimates indicate quarterly revenue of approximately $6.82bn and a net loss of around $0.26 per share, according to consensus figures compiled by Zacks (Zacks, 31 July 2026). Research from S&P Global's Visible Alpha anticipates revenue of approximately $6.90bn, driven mainly by the company's Starlink broadband satellite network (Reuters, 3 August 2026). Starlink contributed around 69% of total revenue in the first quarter of 2026, up from 61% for the full year 2025, underscoring its growing weight within the group (Yahoo Finance, 2 June 2026).
The results also precede the first phase of SpaceX's staggered insider share unlock. On 6 August 2026, two trading days after the report, up to 20% of eligible insider holdings – roughly 911.5 million shares – will become eligible for sale. A further 10% tranche will depend on the stock trading at least 30% above its $135 IPO price for five to 10 sessions beforehand (CNBC, 21 July 2026).
SPCX share price: technical overview
The SPCX share price trades at $119.34 as of 3.04pm UTC on 4 August 2026. The price is above its 10-day simple moving average (SMA) of approximately $115, but below its 20-day and 30-day SMAs of around $125 and $136 respectively, based on TradingView data.
The 10-day exponential moving average (EMA) stands at approximately $117, while the 20-day and 30-day EMAs are near $126 and $138. These readings present a mixed short-term picture: the shortest averages sit below the market price, while the longer averages remain above it.
Momentum remains neutral to weak. The 14-day relative strength index (RSI) is near 42, below the midpoint of 50, and does not indicate strong directional momentum. The 14-day average directional index (ADX) is around 19, below the 25 threshold commonly associated with an established trend. Together, these indicators suggest that recent price action has yet to form a clear directional pattern.
The nearest classic pivot resistance level is R1 at approximately $151, according to TradingView data. A daily close above this level could bring the R2 marker near $194 into focus. On pullbacks, the classic pivot point near $129 provides an initial technical reference, followed by the 20-day SMA around $125. A sustained move below this area could shift attention towards the S1 pivot near $86 (TradingView, 4 August 2026).
This technical analysis is for informational purposes only and does not constitute financial advice or a recommendation to buy or sell any instrument.
SpaceX share price history (2024–2026)
SpaceX priced its IPO at $135 on 9 June 2026. Shares began trading on 12 June and closed their first session at $163.50.
SPCX’s share price continued higher during the following week, reaching an intraday high of $225.65 on 16 June before closing at $206.02. It then declined to $181.66 on 18 June and $152.85 by 25 June, as the initial post-listing rise began to reverse.
A brief recovery lifted the stock to $172.40 on 30 June, but the decline resumed in July. SPCX closed at $137.16 on 14 July and fell to $108.07 on 31 July, its lowest close of the period.
The stock recovered modestly in early August, reaching $119.42 on 4 August 2026. This left it approximately 27% below its 12 June debut close and 11.5% below its $135 IPO price.

Past performance is not a reliable indicator of future results. Share prices are indicative and may differ from live market prices.
SpaceX (SPCX): Capital.com analyst view
SpaceX’s share price has been volatile since its June 2026 Nasdaq debut. The stock initially rose almost 67% above its $135 IPO price before declining through July.
The movement reflects differing views on how investors should value SpaceX’s growth plans across Starlink, AI infrastructure and Starship. It also highlights uncertainty over whether the company’s initial valuation fully accounted for execution risk, capital spending and near-term losses.
Some analysts regard the decline as a post-listing valuation adjustment after the stock’s initial rise. Others suggest that continued weakness may reflect concerns about the sustainability of spending on ventures that have yet to generate consistent returns.
The approaching lock-up expiration and first earnings report add further uncertainty. Additional share supply could weigh on the price if selling exceeds demand, although the effect may be limited if demand remains sufficient. The earnings release could also influence sentiment in either direction, depending on how reported revenue, losses and guidance compare with expectations.
Capital.com’s client sentiment for SpaceX CFDs
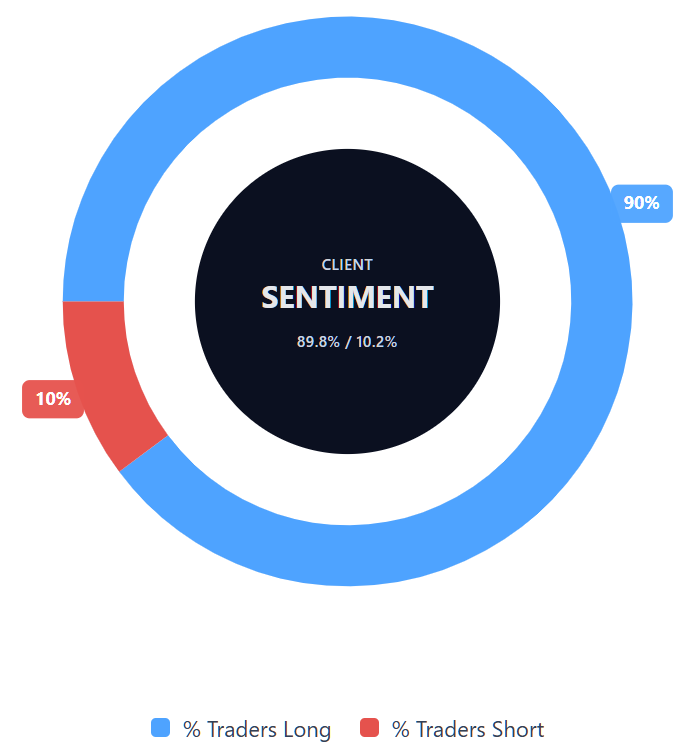
As of 4 August 2026, Capital.com client positioning in SpaceX CFDs shows that 89.8% of open positions are long and 10.2% are short, a difference of 79.6 percentage points.
This snapshot reflects open positions on Capital.com at the time of publication and may change. Client sentiment is not an indicator of future price performance.
Summary – SpaceX 2026
- As of 3.04pm UTC on 4 August 2026, SPCX was trading near $119.34, approximately 27% below its June debut close and 11.6% below its $135 IPO price.
- TradingView’s technical indicators show the RSI near 42, in neutral-to-weak territory, while an ADX reading below 25 suggests that a clear trend has not formed. Short-term moving averages also present a mixed picture around the current price.
- The main factors in focus are the approaching insider lock-up expiration, SpaceX’s first quarterly earnings report as a listed company, and the continuing debate over its valuation in relation to its Starlink, AI infrastructure and Starship plans.
Past performance is not a reliable indicator of future results.
FAQ
Who owns the most SpaceX shares?
The article doesn’t identify SpaceX’s largest shareholder or provide a breakdown of ownership. It does note that up to 911.5 million restricted insider shares could become eligible for sale after the lock-up expires on 6 August 2026. This suggests that insiders hold a substantial portion of the company, but it doesn’t establish which individual or institution owns the most shares. Investors should consult the latest regulatory filings for current ownership data.
What is the five-year SpaceX share price forecast?
The article doesn’t provide a five-year SPCX share price forecast. The available projections focus mainly on short-term scenarios and 12-month analyst targets, which range widely from $115 to $800. These estimates reflect differing assumptions about Starlink, AI infrastructure, Starship, valuation and execution risk. Forecasts become less reliable over longer periods because they depend on changing financial results, market conditions and company developments. They shouldn’t be treated as guarantees of future performance.
Could SpaceX shares go up or down?
Whether SpaceX is a suitable stock depends on an individual’s objectives, financial circumstances and tolerance for risk. The article highlights both potential growth drivers, including Starlink and the company’s wider infrastructure plans, and material risks, such as valuation uncertainty, near-term losses and additional share supply after the lock-up expiration. Analyst views also vary considerably. This information can support further research, but it doesn’t indicate whether buying SpaceX shares is appropriate for any particular person.
Should I invest in SpaceX shares?
The article can’t determine whether you should invest in SpaceX shares. That decision depends on your own financial position, objectives, time horizon and risk tolerance. SpaceX offers exposure to businesses such as Starlink and Starship, but its shares have also shown considerable volatility since listing. The company faces uncertainty around valuation, spending, losses and insider selling. Consider conducting independent research and, where appropriate, seeking advice from a suitably qualified financial professional before making an investment decision.
Can I trade SpaceX CFDs on Capital.com?
Yes, you can trade SpaceX CFDs on Capital.com. Trading share CFDs lets you speculate on price movements without owning the underlying asset and to take long or short positions. However, contracts for difference (CFDs) are traded on margin, and leverage amplifies both profits and losses. You should ensure you understand how CFD trading works, assess your risk tolerance, and recognise that losses can occur quickly.