

Alphabet share price: cloud growth and tech rally
Alphabet is the parent company of Google, with operations spanning search, advertising, cloud computing, YouTube and artificial intelligence. Explore third-party GOOG price targets and technical analysis. Past performance is not a reliable indicator of future results.
Alphabet Inc. (GOOG) last traded at $375.96 as of 2:18pm UTC on 4 August 2026, near the top of its intraday range of $358.18–$376.65. Past performance is not a reliable indicator of future results.
Shares extended their weekly gains alongside a broader rally in US equities. The Nasdaq Composite rose 1.7%, while the S&P 500 gained 1.1% on 3 August, supported by gains among large technology companies ahead of a busy earnings week (Yahoo Finance, 3 August 2026). Sentiment also improved after President Trump said planned strikes on Iran had been called off, easing some geopolitical tensions and putting pressure on oil prices (Barchart, 4 August 2026).
Alphabet's advance also followed its Q2 2026 results, reported on 22 July (Alphabet Investor Relations, 22 July 2026). Google Cloud revenue increased 82% year on year, although adjusted earnings per share (EPS) came in below Wall Street's consensus estimate as investors focused on rising capital expenditure (CNBC, 21 July 2026).
Third-party Alphabet outlook: cloud growth, AI spending
As of 4 August 2026, third-party Alphabet share price predictions present a wide range of possible outcomes for Alphabet shares over the following 12 months. The projections largely reflect the company's second-quarter results, expectations for cloud growth and rising capital expenditure on artificial intelligence (AI).
UBS Group (house view)
UBS projects a 12-month price target of $379, down from $400, while maintaining a Neutral rating as of 23 July 2026. The firm said higher capital expenditure in 2027 could weigh on free cash flow, even if cloud growth continues to accelerate (MarketBeat, 23 July 2026).
Citizens JMP (house view)
Citizens JMP set a Street-high price target of $515 in late July 2026. The firm maintained a positive outlook, citing Alphabet's quarterly earnings performance as support for its valuation (MarketBeat, 22 July 2026).
MarketBeat (consensus overview)
MarketBeat reports an average 12-month price target of $413.54 across 54 analysts as of 3 August 2026. Estimates range from $220 to $515, alongside a Moderate Buy consensus rating (MarketBeat, 3 August 2026).
TipRanks (consensus overview)
TipRanks reports an average 12-month price target of $390.80 across 40 analysts as of 31 July 2026. Estimates range from $190 to $515, with the average target above the prevailing market price at the time of publication (TipRanks, 31 July 2026).
Predictions and third-party forecasts are inherently uncertain, as they cannot fully account for unexpected market developments. Past performance is not a reliable indicator of future results.
Alphabet latest earnings: Q2 2026 results
Alphabet reported its second-quarter 2026 results on 22 July, the company's latest earnings release as of 4 August 2026. Consolidated revenue rose 24%, or 23% in constant currency, to $119.8bn, marking a 12th consecutive quarter of double-digit growth (Alphabet Investor Relations, 22 July 2026).
Google Services revenue increased 15% to $94.5bn, driven by 17% growth in Search and other advertising and 13% growth in YouTube advertising, while Google Cloud revenue rose 82% to $24.8bn with backlog reaching $514bn. Operating income increased 30% and operating margin expanded two percentage points to 34%, while EPS rose 294% to $9.11, though this included a $98bn gain from unrealised equity holdings (Alphabet Investor Relations, 22 July 2026).
CFO Anat Ashkenazi said Alphabet raised its full-year 2026 capex guidance to $195bn–$205bn, from $180bn–$190bn, reflecting continued AI infrastructure investment (Investing.com, 27 July 2026). Shares fell after-hours as investors weighed the higher spending against near-term margin pressure (Investing.com, 27 July 2026). Alphabet's next earnings date is unconfirmed, with Q3 results tentatively expected in late October 2026.
GOOG share price: technical overview
The GOOG share price trades at $375.96 as of 2:18pm UTC on 4 August 2026, above its 20-, 50-, 100- and 200-day simple moving averages (SMAs) of approximately $348, $356, $347 and $327, respectively, according to TradingView.
The 20-day SMA also remains above the 50-day SMA, indicating that the shorter-term average is higher than its medium-term counterpart. The 200-day exponential moving average (EMA) is lower, at approximately $320, creating a wider gap between the market price and this longer-term measure.
The 14-day relative strength index (RSI) is near 62, placing it in the upper part of the neutral range rather than at a commonly monitored overbought level. The 14-period average directional index (ADX) is approximately 16, suggesting that the recent price move has yet to develop strong directional momentum.
The nearest Classic pivot resistance level, R1, is approximately $382. A move above this level could bring the R2 level near $408 into focus. On the downside, the central pivot near $349 provides an initial reference point, followed by the 200-day SMA near $327. A move below the latter could shift attention towards the S1 pivot near $326 (TradingView, 4 August 2026).
This technical analysis is for informational purposes only and doesn’t constitute financial advice or a recommendation to buy or sell any instrument.
Alphabet share price history (2024–2026)
GOOG’s share price traded across a broad range over the two years to August 2026, moving from approximately $142 in April 2025, during a period of tariff-related market uncertainty, to around $409 in May 2026 amid increased interest in large-cap companies associated with AI investment.
The stock rose through much of late 2024 and early 2025, closing 2024 at $189.57. A sell-off in April 2025 then took the price to approximately $142 amid broader weakness in technology shares.
The stock recovered during the second half of 2025 and ended the year at $313.04, above its April low.
Volatility continued in 2026. A decline towards $273 in late March coincided with tariff-related and macroeconomic uncertainty, before a rally into May took the stock above $400 for the first time.
A pullback during June and July, partly associated with an EU antitrust fine and an order under the Digital Markets Act, brought the price to approximately $314 by late July. The shares then recovered following the release of Alphabet’s Q2 results.
GOOGL closed at $377.18 on 4 August 2026, up approximately 20.5% year to date and 93.8% year on year.

Past performance is not a reliable indicator of future results. Share prices are indicative and may differ from live market prices.
Alphabet (GOOG): Capital.com analyst view
Alphabet’s share price rose during the first part of 2026, moving from the mid-$300s to above $370 alongside growth in Google Cloud revenue and continued AI-related investment.
This performance coincided with accelerating cloud revenue, continued demand for search advertising and broader market interest in AI infrastructure. However, higher capital expenditure guidance and regulatory pressure from EU antitrust rulings and Digital Markets Act compliance orders also contributed to periods of volatility.
One view is that continued cloud growth and stronger-than-expected earnings could support Alphabet’s valuation. An alternative view is that higher AI-related spending could place pressure on near-term free cash flow and margins, particularly if revenue growth doesn’t meet market expectations.
Regulatory developments in Europe remain another source of uncertainty. Alphabet’s outlook therefore depends partly on how revenue growth, investment requirements and regulatory pressures develop relative to market expectations. Past performance isn’t a reliable indicator of future results.
Capital.com’s client sentiment for Alphabet CFDs
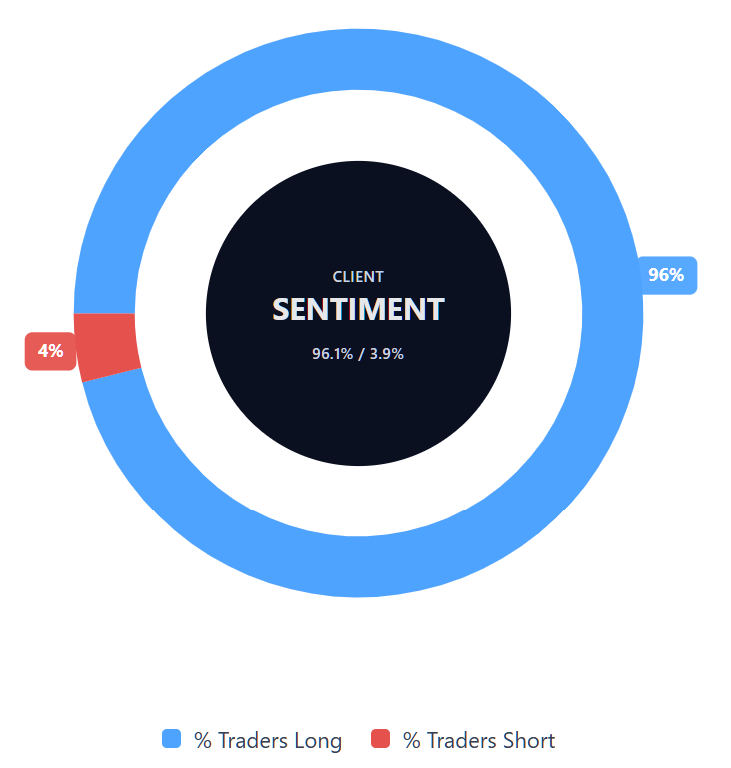
As of 4 August 2026, Capital.com client positioning in Alphabet CFDs was 96.1% long and 3.9% short at the time of measurement, a difference of 92.2 percentage points.
This snapshot reflects open positions held by Capital.com clients and can change. Client sentiment doesn’t necessarily indicate future price movements.
Summary – Alphabet 2026
- GOOG traded at $375.96 as of 2:18pm UTC on 4 August 2026, compared with an April 2025 low of approximately $142 and a 2024 closing price of $189.57.
- According to TradingView, the price remained above several widely followed moving averages. The RSI indicated positive but not commonly defined overbought momentum, while the ADX suggested limited directional strength.
- Factors influencing the stock included Google Cloud growth, higher AI-related capital expenditure, advertising revenue and regulatory developments in the EU.
- Recent developments included Alphabet’s Q2 2026 results, an increase in full-year capital expenditure guidance to $195bn–$205bn and a broad range of third-party analyst price targets.
Past performance is not a reliable indicator of future results.
FAQ
Who owns the most Alphabet shares?
Alphabet’s ownership includes institutional investors, company insiders and retail shareholders. The article doesn’t identify the single largest shareholder, so this would need to be checked against the latest regulatory filings and ownership disclosures. Alphabet also has more than one share class, including GOOG and GOOGL, which carry different voting rights. Ownership levels can change as investors buy or sell shares, so any ranking reflects a specific reporting date.
What is the five-year Alphabet share price forecast?
The article focuses on 12-month analyst price targets rather than a five-year forecast. Published targets cited in the article range from $379 to $515, with consensus averages between approximately $390 and $414. Longer-term projections involve greater uncertainty because they depend on factors such as cloud growth, advertising demand, AI investment, regulation and broader market conditions. Third-party forecasts can be inaccurate and shouldn’t be treated as reliable predictions.
Is Alphabet a good stock to buy?
Whether Alphabet is suitable depends on an individual’s objectives, risk tolerance and financial circumstances. The article highlights potential supporting factors, including Google Cloud growth, advertising revenue and continued investment in AI infrastructure. It also notes risks such as rising capital expenditure, possible pressure on free cash flow and margins, and regulatory uncertainty in Europe. This information is provided for general purposes and doesn’t constitute financial advice or a recommendation to buy Alphabet shares.
Could Alphabet shares go up or down?
Yes. Alphabet shares could rise or fall depending on how market expectations compare with the company’s actual performance. Factors that may influence the price include cloud and advertising growth, earnings results, AI-related capital expenditure, regulation and broader movements in US equity markets. Technical indicators can provide additional context, but they don’t predict outcomes with certainty. Analyst targets also vary widely, which reflects the different assumptions used in each forecast.
Should I invest in Alphabet shares?
The article can’t determine whether investing in Alphabet is appropriate for a particular reader. Any decision should consider personal objectives, time horizon, financial position and capacity for loss. Alphabet’s recent performance has reflected strong cloud growth and advertising demand, but higher AI spending and regulatory pressures may affect future results. Investors may also wish to compare Alphabet with other companies and review current filings, market conditions and independent research before making a decision.
Can I trade Alphabet CFDs on Capital.com?
Yes, you can trade Alphabet CFDs on Capital.com. Trading share CFDs lets you speculate on price movements without owning the underlying asset and to take long or short positions. However, contracts for difference (CFDs) are traded on margin, and leverage amplifies both profits and losses. You should ensure you understand how CFD trading works, assess your risk tolerance, and recognise that losses can occur quickly.