

Palantir stock forecast: Nebius AI infrastructure partnership
Palantir Technologies is a US software company. On 8 September 2026, it named Nebius Group its preferred sovereign AI infrastructure partner. Explore third-party PLTR price targets and technical analysis. Past performance is not a reliable indicator of future results.
Palantir Technologies Inc. (PLTR) traded at $169.25 as of 2:15 UTC on 9 September 2026, within an intraday range of $168.87–$174.18. Past performance is not a reliable indicator of future results.
The stock has given back part of its August gains amid continued valuation scrutiny (Ad- Hoc News, 8 September 2026). Attention also turned to Palantir naming Nebius Group as its preferred sovereign AI infrastructure partner on 8 September. The agreement integrates Nebius's compute and inference capabilities with Palantir's enterprise platform, although no contract value or revenue commitments were disclosed (Yahoo Finance, 8 September 2026). It followed an expanded alliance with PwC US covering enterprise AI, M&A transformation and ERP modernisation (Morningstar, 3 September 2026).
Third-party Palantir outlook: Nebius deal and valuation in focus
As of 9 September 2026, third-party Palantir stock predictions show a wide range of 12-month estimates, reflecting different assumptions around growth, AI demand, valuation and execution.
Baird
Baird maintains a $200 target and buy rating. The firm bases its view on expectations for continued execution across Palantir's commercial and government AI businesses (Price-Target.com, 31 August 2026).
Truist Securities
Truist Securities maintains a $223 target and buy rating, placing it among the higher individual estimates tracked. Its outlook reflects expectations for continued revenue growth across Palantir's Artificial Intelligence Platform (AIP) customer base (Investing.com, 25 August 2026).
MarketBeat
MarketBeat shows a consensus 12-month target of $192.19 from 36 Wall Street analysts, with a moderate-buy rating comprising two strong buy, 21 buy, 10 hold and three sell recommendations. Estimates range from $80–$255 (MarketBeat, 26 August 2026).
MarketWatch
MarketWatch cites an average 12-month target of $200.88 across 36 analysts, with a median of $205 and estimates ranging from $80–$255, alongside an overall overweight recommendation. The snapshot incorporates revisions following Palantir's second-quarter results (MarketWatch, 8 September 2026).
24/7 Wall St.
24/7 Wall St. projects a 12-month target of $214.93, above the $191.68 Wall Street consensus it cites. Its projection reflects assumptions around US commercial bookings and Palantir's raised full-year revenue guidance (Yahoo Finance, 28 August 2026).
Predictions and third-party forecasts are inherently uncertain, as they cannot fully account for unexpected market developments. Past performance is not a reliable indicator of future results.
Palantir (PLTR) latest and upcoming earnings
Palantir reported second-quarter 2026 results on 3 August for the period ended 30 June. Revenue rose 93% year on year to $1.935bn, while US revenue increased 115% to $1.573bn and US commercial revenue rose 149% to $764m. GAAP net income reached $1.062bn, or $0.41 per diluted share, while adjusted income from operations was $1.194bn, representing a 62% margin (Palantir IR, 3 August 2026).
Following the results, Palantir raised full-year revenue guidance to $8.15bn–$8.158bn from $7.65bn–$7.66bn and guided third-quarter revenue to $2.16bn–$2.164bn.
MarketBeat estimates that Palantir could report third-quarter results around 2 November, based on previous reporting patterns. The company has not formally confirmed the date (MarketBeat, 3 August 2026).
Past or simulated performance is not a reliable indicator of future results.
PLTR stock price: technical overview
As of 2:15pm UTC on 9 September 2026, the PLTR stock price trades near $169.25, below its 20-day simple moving average near $176 but above its 50-, 100- and 200-day averages at roughly $152, $144 and $151 respectively. This places the latest price between shorter- and longer-term moving-average references.
The 14-day relative strength index (RSI) sits near 50, within neutral territory, while the average directional index (ADX) around 28 indicates a more established trend without signalling its future direction, according to TradingView.
Higher classic pivot references include R1 around $209 and R2 near $231. Below the latest price, the classic pivot near $166 provides a nearby reference, followed by the 50- and 200-day moving averages around $152–$151 and the 100-day average near $144. The Hull moving average (9) sits close to the latest price at around $170.
TradingView's Camarilla methodology separately places S1 near $180, illustrating how different pivot calculations can produce different reference levels.
A rise could bring higher pivot levels into focus, while a move lower could shift attention towards the moving-average cluster (TradingView, 9 September 2026).
This is technical analysis for informational purposes only and does not constitute investment advice or a recommendation to buy or sell any instrument.
Palantir share price history (2024–2026)
PLTR’s stock price has moved substantially over the past two years. In September 2024, the stock traded around $34–$36 before rising through early 2025 during a period of growing enterprise AI demand. A broader tariff-related sell-off saw the shares fall to $73.89 intraday on 9 April 2025.
The stock subsequently recovered, reaching $222.05 intraday on 3 November 2025 during a period of higher earnings and expanding government and commercial AI contracts, before ending the year around $177.
Further volatility followed in 2026. Shares fell to $67.73 in early April amid broader technology-sector weakness before recovering after second-quarter results and reaching $188.42 on 28 August.
PLTR closed at $169.16 on 9 September 2026, broadly flat year to date but around 3.2% higher year on year.

Past performance is not a reliable indicator of future results. Share prices are indicative and may differ from live market prices.
Palantir (PLTR): Capital.com analyst view
Palantir shares have moved sharply in both directions while remaining above their September 2024 level. This period has coincided with rapid revenue growth and demand for Palantir's AI platforms across government and commercial customers, while valuation has remained a recurring focus.
Continued AI demand, revenue growth or further contract expansion could support sentiment if the company meets market expectations. Conversely, greater competition, weaker execution, valuation concerns or changes in government spending could weigh on the shares.
The Nebius and PwC agreements may broaden Palantir's commercial AI relationships, although their impact will depend on adoption and any revenue generated. These are potential price influences rather than a forecast of future direction.
Capital.com’s client sentiment for Palantir CFDs
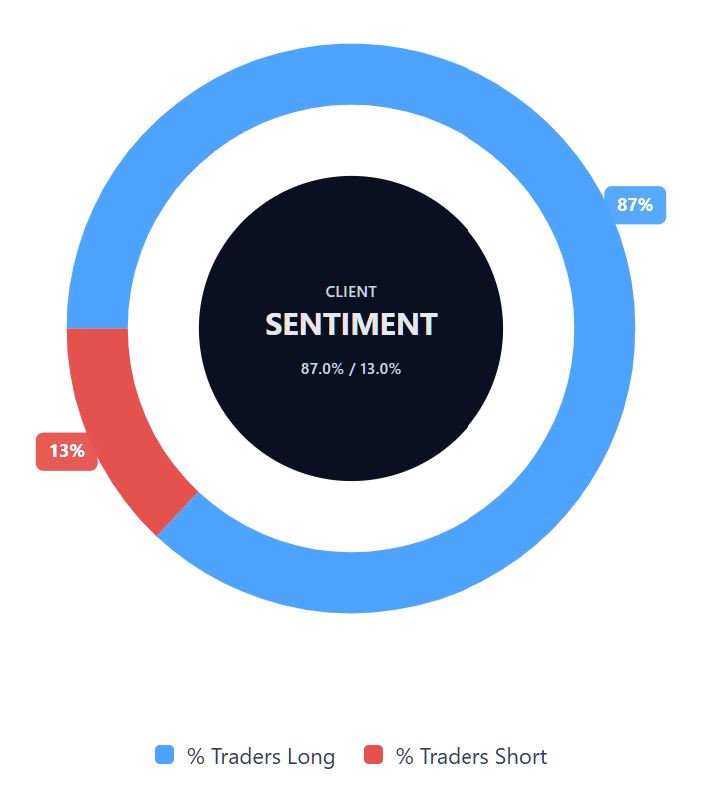
As of 9 September 2026, Capital.com client positioning in Palantir CFDs is weighted towards long positions, with 87% long and 13% short. This reflects open positions on Capital.com at the time of measurement rather than future price direction and can change.
Summary – Palantir 2026
- As of 2:15pm UTC on 9 September 2026, Palantir traded near $169.25, within an intraday range of $168.87–$174.18.
- According to TradingView data, the price was below its 20-day moving average but above its 50-, 100- and 200-day averages, with RSI near 50 and ADX near 28.
- Key factors include AI-related contract activity, revenue growth, valuation scrutiny and competition in enterprise AI.
- Higher AI demand, revenue or contract growth could support sentiment, while valuation pressure, execution risks or greater competition could weigh on the shares.
- Recent attention centres on the Nebius sovereign AI partnership, expanded PwC alliance and Palantir's valuation following its August gains.
Past performance is not a reliable indicator of future results.
FAQ
Who owns the most Palantir stock?
This article does not identify Palantir's largest shareholder or provide a breakdown of its ownership structure. Instead, it focuses on share-price performance, earnings, AI-related partnerships, valuation and third-party analyst forecasts. Ownership can change as institutional and other investors adjust their holdings, so current shareholder disclosures would need to be checked separately when assessing which investor holds the largest stake in Palantir.
What is the five-year Palantir share price forecast?
The article does not provide a five-year PLTR forecast. The third-party estimates covered here focus mainly on 12-month targets, with broader analyst estimates ranging from $80–$255 and consensus or house figures around $192–$215. Longer-term forecasts carry greater uncertainty because AI demand, competition, valuation, government spending and execution can change materially over several years. These estimates should therefore be treated as scenarios rather than reliable long-term predictions.
Is Palantir a good stock to buy?
This article does not classify Palantir as a good or bad stock to buy. Continued AI demand, revenue growth and further contract expansion could support sentiment, while valuation concerns, stronger competition, weaker execution or changes in government spending could weigh on the shares. Analyst targets also vary widely, reflecting different assumptions about future growth and valuation. These factors provide context for assessing Palantir but do not amount to an investment recommendation.
Could Palantir stock go up or down?
Yes. Palantir shares can move in either direction as company-specific and wider market conditions change. Stronger AI demand, higher revenue or further commercial and government contracts could support the price. Conversely, valuation pressure, weaker execution, greater competition or changes in government spending could weigh on it. Technical levels may also influence short-term trading activity, but they are reference points rather than reliable predictions of future price movements.
Should I invest in Palantir stock?
Whether Palantir shares are suitable for you depends on your circumstances, objectives and tolerance for risk, and this article does not provide investment advice or a personal recommendation. Factors to consider include revenue growth, AI demand, valuation, contract activity, competition and exposure to government spending. Each could influence the share price positively or negatively, while unexpected company, regulatory or market developments may change the outlook.
Can I trade Palantir CFDs on Capital.com?
Yes, you can trade Palantir CFDs on Capital.com. Trading share CFDs lets you speculate on price movements without owning the underlying asset and to take long or short positions. However, contracts for difference (CFDs) are traded on margin, and leverage amplifies both profits and losses. You should ensure you understand how CFD trading works, assess your risk tolerance, and recognise that losses can occur quickly.