

Netflix share price: Q3 guidance misses expectations
Netflix reported Q2 revenue of $12.56bn and guided for Q3 revenue of $12.86bn, while its shares traded about 44% below their June 2025 all-time high. Explore third-party NFLX price targets and technical analysis. Past performance is not a reliable indicator of future results.
Netflix, Inc. (NFLX) is trading around $72.51, within an intraday range of $71.76–$73.53 on 1.14pm UTC on 4 August 2026. Past performance is not a reliable indicator of future results.
Downward pressure has persisted since Netflix reported Q2 revenue of $12.56bn, slightly below the Bloomberg consensus estimate of $12.58bn (Zacks, 17 July 2026). The company also guided for Q3 revenue of $12.86bn, compared with Wall Street's expectation of about $13bn, and said it would publish engagement metrics less frequently (Reuters, 17 July 2026). Shares fell to a 52-week low of $68.64 on 17 July following the results, extending the stock's decline from its June 2025 all-time high (Yahoo Finance, 17 July 2026).
Third-party Netflix outlook: softer Q3 guidance, mixed targets
As of 4 August 2026, third-party Netflix share price predictions span a range of 12-month projections published between 17 July and 4 August 2026, following the company's second-quarter results. Together, they show differing views on engagement, revenue growth and the expansion of Netflix's advertising-supported tier.
Pivotal Research Group
Pivotal Research Group set a 12-month price target of $70 for Netflix while maintaining an Outperform rating. The firm reduced its subscriber estimates and increased its cost forecasts, based on an assumption that Netflix would continue investing to support engagement, including through potential sports spending (Hollywood Reporter, 17 July 2026).
Morgan Stanley
Morgan Stanley maintained a Buy rating and a price target of $83, which was 13.43% above the share price recorded on 17 July 2026. Its projection balanced uncertainty around near-term engagement with the continued expansion of Netflix's advertising-supported tier (TipRanks, 17 July 2026).
Phillip Securities
Phillip Securities upgraded Netflix and issued a 12-month price target of $110, which was 50.33% above the prevailing share price on 20 July 2026. The firm cited the company's expanding advertising business and pricing power as factors that could support its longer-term performance (Investing.com, 20 July 2026).
Baird
Baird maintained a Buy rating with a price target of $90, down from $120, as of 22 July 2026. The revised target was 23% above the share price at the time and reflected a more conservative view of near-term revenue growth following the second-quarter update (MarketScreener, 22 July 2026).
Investing.com consensus
Investing.com's poll of 45 analysts showed an average 12-month price target of $94.33, with estimates ranging from $70 to $135. The poll also reported an overall consensus rating of Buy, with the average target 28.91% above the prevailing share price on 4 August 2026 (Investing.com, 4 August 2026).
Predictions and third-party forecasts are inherently uncertain, as they cannot fully account for unexpected market developments. Past performance is not a reliable indicator of future results.
Netflix earnings: latest results and upcoming report
Netflix reported second-quarter 2026 revenue of $12.56bn on 16 July, up 13% year on year but marginally below the Bloomberg consensus estimate of $12.58bn. Diluted earnings per share were $0.80, ahead of the $0.79 analyst forecast (Reuters, 17 July 2026).
For the third quarter, Netflix guided for revenue of $12.86bn and diluted earnings per share of $0.82. Both figures were below Wall Street's expectations of about $13bn in revenue and $0.84 in earnings per share, according to LSEG data cited by Reuters (Reuters, 17 July 2026).
Netflix reiterated its full-year 2026 revenue outlook of $51bn–$51.4bn and its target for an operating margin of 31.5% (Reuters, 17 July 2026).
The company's next scheduled earnings release is expected to cover third-quarter 2026 results and take place after the market closes on 20 October 2026, according to its investor relations calendar (Netflix Investor Relations, 15 June 2026). The report may provide further detail on engagement, revenue growth and the performance of the advertising-supported tier.
NFLX share price: technical overview
As of 1.14pm UTC on 4 August 2026, the NFLX share price trades near $72.51, below its 20-, 50-, 100- and 200-day simple moving averages (SMAs) on TradingView, at approximately $72, $77, $85 and $91 respectively.
According to TradingView, this structure shows that shorter-term average prices remain below longer-term averages on the daily chart. The 20-day exponential moving average is close to the corresponding SMA, indicating little difference between the two measures.
The 14-day relative strength index stands at 49.82, placing it in neutral territory rather than clearly indicating overbought or oversold conditions. The average directional index is 26.73, which may indicate the presence of an established trend, while the broader moving-average sequence remains in descending order.
The nearest classic pivot resistance level is R1 at about $78.41, followed by R2 near $85.10. A daily close above R1 would bring R2 into consideration as the next technical reference level. The 50-day SMA near $77 provides another reference point below R1.
On the downside, the classic pivot point near $71.74 marks the first support reference, with the 20-day SMA near $72 positioned nearby. A daily close below the pivot would bring S1 near $65.05 into consideration as a further technical level (TradingView, 4 August 2026).
These are conditional technical scenarios rather than price forecasts. Technical analysis is for informational purposes only and does not constitute financial advice or a recommendation to buy or sell any instrument.
Netflix share price history (2024–2026)
NFLX’s share price began August 2024 trading at around $60.61 and moved higher through late 2024 and into 2025, during a period of subscriber growth and expansion in the company’s advertising-supported tier.
The stock reached an all-time high of $134.86 on 1 July 2025. A 10-for-1 stock split then took effect in November, increasing the number of shares outstanding while reducing the price of each share proportionately.
Price momentum weakened through the first half of 2026. NFLX opened the year near $91.10 and recorded an intraday range of $83.29–$93.89 on 26 February amid increased volatility.
On 16 July, the stock fell from $74.22 to close at $67.85 following the second-quarter earnings release and third-quarter guidance.
NFLX closed at $72.55 on 4 August 2026, about 20.4% lower year to date and around 38.2% lower year on year. This performance reflects the decline from its 2025 peak but does not indicate how the shares may perform in future.

Past performance is not a reliable indicator of future results. Share prices are indicative and may differ from live market prices.
Netflix (NFLX): Capital.com analyst view
Netflix’s 2026 share price performance has included a substantial decline from its 2025 peak, with the stock falling from a post-split high above $110 to trade at around $72.55.
The move coincided with weaker-than-expected engagement data and a cautious third-quarter revenue outlook, which affected market sentiment despite the company’s year-on-year revenue growth. Some third-party analysts have also cited continued advertising-tier expansion and a record quarterly share buyback when assessing whether the scale of the decline reflects Netflix’s underlying financial performance.
Past performance is not a reliable indicator of future results, and forward-looking projections are uncertain and may not materialise.
Capital.com’s client sentiment for Netflix CFDs
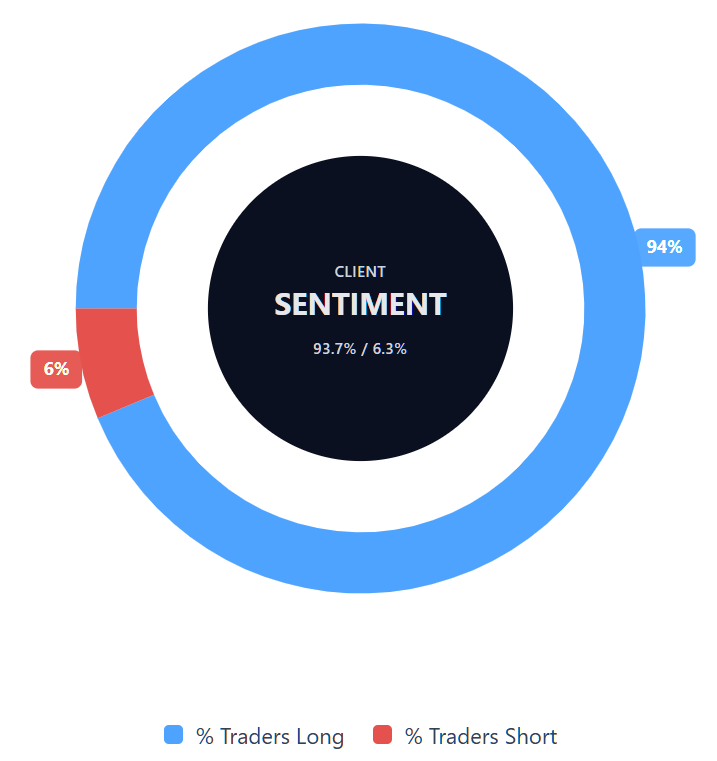
As of 4 August 2026, Capital.com client positioning in Netflix CFDs shows that 93.7% of open positions are long, compared with 6.3% that are short. The difference between long and short positions is 87.4 percentage points.
This reading reflects open positions held by Capital.com clients at the time of measurement. It may change and does not indicate future price movements.
Summary – Netflix 2026
- As of 1.14pm UTC on 4 August 2026, Netflix was trading near $72.51, below its 2025 peak of $134.86 but above the levels recorded in August 2024.
- According to TradingView, the price remained below key moving averages, while the RSI was neutral and the ADX indicated the presence of an established trend.
- Key factors identified by third-party analysts include engagement trends, third-quarter guidance, expansion of the advertising-supported tier and the company’s share buyback programme.
- The next scheduled event is Netflix’s third-quarter earnings report on 20 October 2026. Analyst forecasts, technical indicators and client sentiment should be considered alongside other information and are not reliable indicators of future performance.
Past performance is not a reliable indicator of future results.
FAQ
Who owns the most Netflix shares?
The article does not identify Netflix’s largest shareholders. Ownership data can change as institutional investors, company insiders and other shareholders buy or sell shares. For the latest position, investors typically refer to Netflix’s regulatory filings and major shareholder disclosures. These records provide a more reliable view of current ownership than historical summaries, particularly because institutional holdings may shift between reporting periods.
What is the five-year Netflix share price forecast?
The article does not provide a five-year NFLX share price forecast. The analyst estimates discussed cover a 12-month period and range from $70 to $110 at the individual broker level, with a broader consensus average of $94.33. Longer-term forecasts carry greater uncertainty because they depend on factors such as revenue growth, engagement, advertising performance, competition, costs and broader market conditions.
Is Netflix a good stock to buy?
Whether Netflix is suitable depends on an individual’s objectives, risk tolerance and wider financial circumstances. The article highlights both potential supports, including revenue growth, advertising-tier expansion and share buybacks, and risks such as weaker engagement, cautious guidance and pressure on the share price. Analyst ratings and price targets reflect third-party views and may not materialise, so they should not be treated as recommendations.
Could Netflix shares go up or down?
Yes. Netflix shares could move in either direction as markets respond to earnings, guidance, engagement trends, advertising growth, costs and wider economic conditions. The article also notes several technical reference levels, but these do not predict future price movements. A stronger-than-expected update could support the share price, while weaker results or guidance could place it under further pressure. Volatility may increase around earnings announcements.
Should I invest in Netflix shares?
The article cannot determine whether investing in Netflix shares is appropriate for you. It presents historical performance, analyst forecasts, earnings data, technical indicators and client sentiment for informational purposes. These factors can help readers understand the market context, but none provides certainty about future returns. Before making any decision, consider your own objectives, financial position and tolerance for loss, and seek independent professional advice where appropriate.
Can I trade Netflix CFDs on Capital.com?
Yes, you can trade Netflix CFDs on Capital.com. Trading share CFDs lets you speculate on price movements without owning the underlying asset and to take long or short positions. However, contracts for difference (CFDs) are traded on margin, and leverage amplifies both profits and losses. You should ensure you understand how CFD trading works, assess your risk tolerance, and recognise that losses can occur quickly.