

AMD share price: Q2 earnings due after close
AMD is due to report second-quarter earnings after the market close on 4 August 2026, with options pricing implying a potential move of up to 10% by the end of the week. Explore third-party AMD price targets and technical analysis. Past performance is not a reliable indicator of future results.
Advanced Micro Devices Inc (AMD) is trading at $507.46, having moved within an intraday range of $461.75–$509.50 as of 12:23pm UTC on 4 August 2026. Past performance is not a reliable indicator of future results.
Sentiment is supported by anticipation of AMD's fiscal second-quarter results, due after the US market close on 4 August 2026, with consensus estimates pointing to revenue near $11.3bn and earnings per share around $1.62, as investors positioned ahead of the print (Yahoo Finance, 4 August 2026); broader semiconductor shares have been volatile in recent sessions amid renewed scrutiny of AI-related capital spending and reports of progress in Chinese chipmaking capacity (Reuters, 28 July 2026).
Third-party AMD outlook: Q2 earnings near
As of 4 August 2026, third-party AMD share price predictions cover a range of potential future values, reflecting expectations for AI accelerator demand, data-centre growth and the company's second-quarter results. The forecasts below summarise broker and consensus estimates published between 20 July and 4 August 2026.
Benchmark (house view)
Benchmark forecasts that AMD shares could reach $685 over a 12-month horizon and maintains a Buy rating. Analyst Cody Acree also forecasts second-quarter revenue of $11.28bn and non-GAAP earnings per share of $1.63 ahead of the company's results (Investing.com, 3 August 2026).
Investing.com (analyst consensus)
Analysts tracked by Investing.com project an average 12-month price target of $579.11 for AMD. Individual forecasts range from $320 to $1,250 across 47 contributors, while the aggregate rating is Strong Buy (Investing.com, 3 August 2026).
MarketBeat (consensus overview)
MarketBeat's compiled data indicates a 12-month average price target of $508.31 for AMD, based on 48 analyst estimates. Forecasts range from $320 to $700, and the overall consensus rating is Moderate Buy (MarketBeat, 29 July 2026).
MarketScreener (consensus overview)
MarketScreener reports an average 12-month target price of $500.40 for AMD, based on 51 analyst estimates, and a consensus Buy rating. The projected target is below the last recorded close of $519.74 (MarketScreener, 23 July 2026).
The Globe and Mail (analyst roundup)
The Globe and Mail reports an average 12-month price target of $512.27 for AMD, based on Wall Street coverage. It also notes that Stifel analyst Ruben Roy set an above-consensus target of $635, citing expectations of continued revenue growth in AMD's Data Center segment (The Globe and Mail, 9 July 2026).
Predictions and third-party forecasts are inherently uncertain, as they cannot fully account for unexpected market developments. Past performance is not a reliable indicator of future results.
AMD upcoming earnings: second-quarter 2026 report
AMD (NASDAQ: AMD) is scheduled to report its fiscal second-quarter 2026 results on Tuesday, 4 August 2026, after the US market closes. A conference call for the financial community will follow at 5pm ET/2pm PT and will be available via webcast on the company's investor relations website (AMD, 8 July 2026).
For the quarter, AMD previously guided for revenue of approximately $11.2bn, plus or minus $300m. This would represent year-on-year growth of about 46%, based on the company's first-quarter 2026 results release (AMD, 5 May 2026). Wall Street consensus estimates sit slightly above this guidance, with projected revenue of around $11.3bn and earnings per share estimated at approximately $1.61–$1.62 (Yahoo Finance, 2 August 2026).
In the previous quarter, AMD reported first-quarter 2026 revenue of $10.3bn, up 38% year on year, and non-GAAP diluted earnings per share of $1.37, above the $1.27 consensus estimate. Data Center segment revenue reached $5.8bn, up 57% year on year, supported by demand for EPYC processors and continued shipments of Instinct GPU accelerators (AMD, 5 May 2026).
Beyond the earnings release, AMD has confirmed that it will participate in KeyBanc's Technology Leadership Forum on 11 August 2026, followed by industry conferences hosted by Citi and Goldman Sachs in September 2026 (AMD, 8 July 2026).
Past or simulated performance is not a reliable indicator of future results.
Advanced Micro Devices share price: technical overview
As of 12:23pm UTC on 4 August 2026, the AMD share price trades near $507.46, below its 20-, 50-, 100- and 200-day simple moving averages (SMAs) on TradingView, at approximately $512, $513, $403 and $313, respectively. This presents a mixed moving-average picture rather than a consistently upward alignment. The 200-day exponential moving average (EMA) is lower, near $346, highlighting the gap between shorter- and longer-term trend measures in TradingView data.
Momentum indicators also present a mixed picture. The 14-day relative strength index (RSI) is 46.69, below its midpoint, while the 14-day average directional index (ADX) is 14.29. Together, these readings suggest limited directional momentum according to TradingView data.
Above the current price, the classic R1 pivot near $559 provides the closest technical reference. A daily close above this level could bring the R2 pivot near $642 into focus under TradingView’s pivot framework. Further out, the classic R3 level near $792 remains a distant reference if upward momentum continues.
Below the current price, the classic pivot point near $491 acts as the first support reference, while the 100-day SMA near $403 provides a longer-term reference point on TradingView’s chart. A move below the pivot near $491 could shift attention towards the classic S1 level near $409, although technical levels alone cannot determine future price movements (TradingView, 4 August 2026).
This technical analysis is for informational purposes only and does not constitute financial advice or a recommendation to buy or sell any instrument.
AMD share price history (2024–2026)
AMD’s share price spent much of 2024 rising from lows near $26 in early August, moving higher through the autumn and winter as demand for AI-related computing increased.
By November 2025, the pace of the rise had accelerated, with the stock reaching an intraday high of $222.05 on 3 November 2025. It then declined during the winter amid profit-taking and broader concerns across the technology sector. AMD fell as low as $65.76 on 15 January 2025 amid a wider reassessment of AI-related valuations, before recovering through the spring and summer of 2025 and into 2026 as demand for data-centre and AI chips increased again.
Price volatility continued in 2026. The stock opened the year around $169, moved towards $222 following its late-2025 rise, then traded between approximately $108–$187 during the first half of 2026 as sentiment changed around successive earnings releases.
AMD closed at $144.55 on 4 August 2026, down approximately 14.6% year to date and around 14% year on year.

Past performance is not a reliable indicator of future results. Share prices are indicative and may differ from live market prices.
AMD (Advanced Micro Devices): Capital.com analyst view
AMD’s price performance during 2025 and into 2026 has shown substantial volatility, with shares trading between approximately $26 and more than $580 as sentiment changed in response to artificial intelligence infrastructure spending.
Demand from data-centre customers, partnership announcements and better-than-expected earnings have coincided with periods of price appreciation. By contrast, concerns about AI-related valuations, profit-taking across the sector and competition have contributed to periods of decline. This reflects how market participants have weighed expectations for future growth against uncertainty over the longer-term demand outlook.
Some market participants consider continued investment in AI infrastructure a potential source of demand for AMD’s data-centre products. Others note that higher valuations may increase the stock’s sensitivity to changes in growth expectations or a slowdown in sector capital expenditure. These competing factors have contributed to the observed price swings and underline the range of risks shaping the outlook. Past performance is not a reliable indicator of future results.
Capital.com’s client sentiment for AMD CFDs
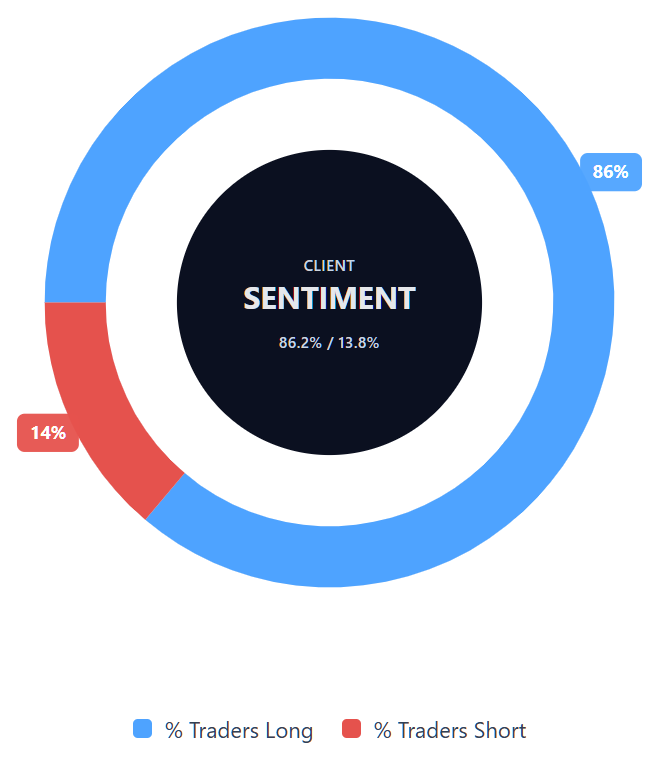
As of 4 August 2026, Capital.com client positioning in AMD CFDs shows 86.2% of clients holding buy positions and 13.8% holding sell positions. This represents a difference of 72.4 percentage points between buyers and sellers.
At the time of measurement, long positions therefore accounted for most open AMD positions held by Capital.com clients. This snapshot reflects open positions on Capital.com and can change.
Summary – AMD 2026
- As of 12:23pm UTC on 4 August 2026, AMD was trading near $507.46, within an intraday range of $461.75–$509.50 and below its reported 2025 peaks.
- Over the previous two years, AMD traded between approximately $26 and more than $580, reflecting periods of AI-related price appreciation as well as valuation-related declines.
- Technical indicators on TradingView provide mixed readings. The price is below its 20- and 50-day averages, the RSI is below its midpoint, and the ADX indicates limited trend strength.
- Factors that may affect AMD’s price include demand for AI infrastructure, data-centre growth and broader semiconductor-sector sentiment towards capital expenditure. Competitive pressures, valuation changes and shifts in customer spending also present risks.
Past performance is not a reliable indicator of future results.
FAQ
Who owns the most Advanced Micro Devices shares?
The article does not identify AMD’s largest shareholders or provide an ownership breakdown. Major shareholders in listed companies often include institutional investors, fund managers and company insiders, but their holdings can change over time. Anyone assessing AMD’s ownership structure should consult the company’s latest regulatory filings and shareholder disclosures. Ownership concentration alone does not determine future share-price performance and should be considered alongside financial results, valuation, competition and broader market conditions.
What is the five-year Advanced Micro Devices share price forecast?
The article does not provide a five-year AMD share price forecast. The cited analyst estimates cover a 12-month period, with targets ranging from about $500 to $685 and consensus figures clustering around $510–$580. Forecasting over five years involves greater uncertainty because demand, competition, capital expenditure, regulation and market valuations may change materially. Long-term projections should therefore be treated as scenarios rather than reliable indications of future performance.
Is Advanced Micro Devices a good stock to buy?
Whether AMD is a suitable stock to buy depends on an individual’s objectives, risk tolerance and financial circumstances. The article presents a mixed outlook: AI infrastructure and data-centre demand may support future growth, while valuation, competition and shifts in customer spending create risks. Analyst ratings are generally positive, but forecasts can be inaccurate. This information is not financial advice, and no single price target or technical indicator can determine whether AMD is suitable for a particular investor.
Could Advanced Micro Devices shares go up or down?
AMD shares could move in either direction. Potential drivers of gains include stronger demand for AI accelerators, data-centre growth, higher capital expenditure and results that exceed market expectations. However, the price could fall if growth slows, valuations are reassessed, competition increases or the semiconductor sector weakens. The article’s technical indicators also give mixed signals, with limited trend strength. Options prices ahead of the earnings release implied the possibility of a sizeable move in either direction.
Should I invest in Advanced Micro Devices shares?
The article cannot determine whether someone should invest in AMD shares. That decision depends on personal objectives, available capital, investment horizon and ability to absorb losses. AMD offers exposure to themes such as AI infrastructure and data-centre growth, but its share price has also shown substantial volatility. Competitive pressures, valuation changes and weaker spending could affect future performance. Investors should conduct their own research and consider seeking independent financial advice before making an investment decision.
Can I trade Advanced Micro Devices CFDs on Capital.com?
Yes, you can trade AMD CFDs on Capital.com. Trading share CFDs lets you speculate on price movements without owning the underlying asset and to take long or short positions. However, contracts for difference (CFDs) are traded on margin, and leverage amplifies both profits and losses. You should ensure you understand how CFD trading works, assess your risk tolerance, and recognise that losses can occur quickly.