

Microsoft share price: Azure revenue tops $100bn
Microsoft reported fiscal fourth-quarter revenue of $90bn, up 18% year on year, as annual Azure revenue exceeded $100bn for the first time. Explore third-party MSFT price targets and technical analysis. Past performance is not a reliable indicator of future results.
Microsoft Corp. (MSFT) is trading at $478.33 as of 12:52pm UTC on 4 August 2026, within its intraday range of $467.92–$490.67. Past performance is not a reliable indicator of future results.
The share price remains supported by Microsoft's fiscal fourth-quarter results, released on 29 July 2026. Revenue rose 18% year on year to $90bn, while diluted earnings per share reached $4.81 (Microsoft Investor Relations, 29 July 2026). Azure cloud revenue also exceeded $100bn for the full fiscal year for the first time, rising 41% over the prior year (Fortune, 27 July 2026).
Shares jumped more than 16% on 30 July following the report, briefly lifting Microsoft's market capitalisation above $3.35tn (Quartz, 31 July 2026).
Third-party Microsoft outlook: earnings rally and analyst targets
As of 4 August 2026, third-party Microsoft share price predictions place Microsoft's 12-month price targets across a relatively broad range. Most reflect expectations surrounding Azure growth, AI-related demand, capital expenditure and the company's latest quarterly results.
Morgan Stanley (broker price target)
Morgan Stanley maintained a $600 price target on Microsoft ahead of the company's fiscal fourth-quarter 2026 results, implying around 54% upside from the share price used in its analysis. The bank described the risk-to-reward profile as 'highly attractive', citing anticipated strength in Azure and Copilot adoption as key factors supporting its forward view (Investing.com, 23 July 2026).
Guggenheim (broker price target)
Guggenheim projects that Microsoft shares could reach $586 over the next 12 months, having reiterated a Buy rating after the company's fiscal fourth-quarter 2026 report. The firm's forecast reflects its expectation that Azure growth and cloud demand could continue to exceed previous projections (Investing.com, 30 July 2026).
Citi (broker price target)
Citi projects that Microsoft shares could reach $570 over the next 12 months, after reducing its previous estimate from $620 ahead of the 29 July earnings release. The bank attributed the lower target to expectations that continued capital expenditure could restrict near-term margin expansion (TheStreet, 16 July 2026).
MarketBeat (consensus overview)
MarketBeat reported an average 12-month price target of $560.98 for Microsoft, compiled from 47 Wall Street analysts as of 1 August 2026. Individual forecasts ranged from $400 to $870. The platform gave Microsoft a 'Moderate Buy' consensus rating, based on 40 Buy and seven Hold recommendations (MarketBeat, 1 August 2026).
MarketScreener (consensus overview)
MarketScreener reported an average 12-month target price of $559.93, based on estimates from 55 analysts as of 30 July 2026. Forecasts ranged from $400 to $870. The consensus figure implied potential upside of approximately 45.9% from the reference price used in the survey and reflected analysts' expectations for continued Azure growth (MarketScreener, 30 July 2026).
Predictions and third-party forecasts are inherently uncertain, as they cannot fully account for unexpected market developments. Past performance is not a reliable indicator of future results.
MSFT share price: technical overview
As of 12:52pm UTC on 4 August 2026, the MSFT share price trades at $478.33, above its 20-, 50-, 100- and 200-day simple moving averages of approximately $402, $401, $400 and $433, respectively, based on TradingView data.
The stock also sits above its 20-day exponential moving average, near $410. Together, these readings show that the cited short- and longer-term moving averages remain below the current price.
Momentum indicators show elevated readings. The 14-day relative strength index (RSI) stands at 78.27, above the 70 level commonly described as overbought, while the stochastic %K reads 94.93.
Both indicators point to strong recent upward momentum, according to TradingView data. However, an overbought reading doesn’t necessarily mean that a reversal will follow.
The 14-day average directional index (ADX) stands at 18.25, below the 25 level often used to identify a stronger established trend. On this measure, the current directional trend remains comparatively weak despite the elevated momentum readings.
On the upside, the nearest classic pivot resistance level, R1, stands at $496.59. A daily close above this level could bring the R2 reference near $528.46 into focus, according to TradingView pivot data. The Fibonacci R2 level near $492.75 provides another reference in the same general area.
On pullbacks, the classic pivot point at $434.97 marks an initial reference area. The 200-day simple moving average near $433 sits close to this level, while the 100-day simple moving average near $400 provides a lower reference.
If the price falls below the $434.97 pivot and the nearby 200-day moving average, TradingView data places the S1 reference near $403.10. These levels don’t predict how the price will move, and traders may interpret them differently (TradingView, 4 August 2026).
This technical analysis is for informational purposes only and doesn’t constitute financial advice or a recommendation to buy or sell any instrument.
Microsoft earnings
Microsoft released its fiscal 2026 fourth-quarter results, covering the period ended 30 June 2026, after the market closed on 29 July 2026. The company reported revenue of $90bn, up 18% year on year, and diluted earnings per share of $4.81, an increase of 32% on a generally accepted accounting principles (GAAP) basis. Operating income rose 18% to $40.60bn (Microsoft Investor Relations, 29 July 2026).
Revenue from Azure and other cloud services increased by 43%, while Microsoft Cloud revenue reached $59.30bn, up 27%. Full-year revenue totalled $331.80bn, an increase of 18%, and Azure cloud revenue exceeded $100bn for the first time in a single fiscal year (Fortune, 27 July 2026).
For the first quarter of fiscal 2027, Microsoft provided revenue guidance with a midpoint of $90.40bn, above the average analyst estimate of $89.66bn compiled by LSEG. It also forecast Azure growth of 45% on a constant-currency basis (Reuters, 29 July 2026).
Microsoft said its capital expenditure plans remained broadly unchanged, projecting approximately $50bn for the first quarter of fiscal 2027 and around $175bn for the 2026 calendar year, with CFO Amy Hood attributing the revised figure primarily to an accounting change extending the useful life of data centres rather than a reduction in underlying spending (Yahoo Finance, 30 July 2026).
Microsoft's next earnings release, covering the first quarter of fiscal 2027, is inferred for 28 October 2026, based on the company's historical reporting schedule, though the date remains unconfirmed (Wall Street Horizon, 4 August 2026). Before then, its next confirmed investor event is the Deutsche Bank Technology Conference on 27 August 2026 (Microsoft Investor Relations, 28 July 2026).
Microsoft share price history (2024–2026)
MSFT’s share price has fluctuated considerably over the past two years, with tariff announcements, AI spending expectations and company earnings among the factors influencing performance.
In August 2024, the stock traded at around $402. It climbed through the remainder of the year before falling in April 2025, when President Trump’s ‘Liberation Day’ tariff announcement contributed to a broader market sell-off.
MSFT reached a low of $348.34 on 8 April 2025. The shares subsequently recovered and reached a two-year high of $562.58 on 30 July 2025.
The stock experienced further volatility in 2026. Concerns about the sustainability of AI-related spending coincided with a decline to $349.26 by late June, close to the previous year’s tariff-related low.
Microsoft’s fiscal fourth-quarter earnings, released on 29 July 2026, were followed by a sharp one-day increase in its share price and market capitalisation.
MSFT was trading near $478.33 at 12:52pm UTC on 4 August 2026. Based on the historical prices cited above, this represented an increase of approximately 18.8% over two years and a decline of around 11.1% year on year.

Past performance is not a reliable indicator of future results. Share prices are indicative and may differ from live market prices.
Microsoft (MSFT): Capital.com analyst view
Microsoft’s share price has shown wide fluctuations in 2026, moving from a low near $349 in late June to above $490 after its fiscal fourth-quarter results in late July.
Market participants have linked the rebound to Microsoft’s reported Azure growth and expectations surrounding revenue from AI-related infrastructure. However, its capital expenditure plans, projected at around $175bn for the 2026 calendar year, may place pressure on margins if revenue associated with AI services doesn’t grow at a comparable rate.
The outlook therefore remains two-sided. A more positive interpretation points to faster Azure revenue growth and enterprise demand for Copilot as potential sources of future earnings growth.
A more cautious view focuses on Microsoft’s valuation, the possibility of slower cloud growth and uncertainty over the returns generated by large-scale AI investment.
Both scenarios depend on assumptions about future business and market conditions. Neither provides a reliable indication of the direction Microsoft’s share price will take.
Capital.com’s client sentiment for Microsoft CFDs
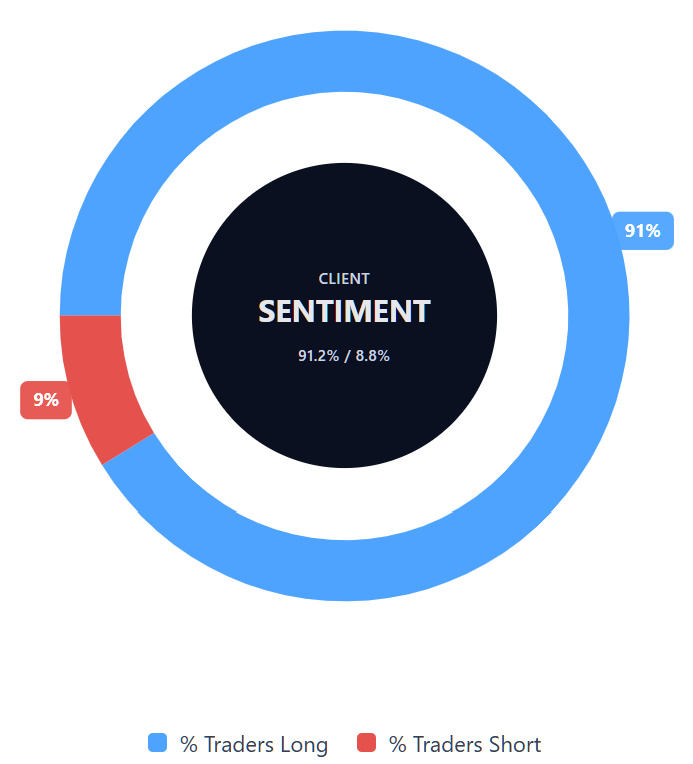
As of 4 August 2026, Capital.com client positioning in Microsoft CFDs shows 91.2% of clients holding buy positions and 8.8% holding sell positions. This represents a difference of 82.4 percentage points.
The figures provide a snapshot of open positions held by Capital.com clients and may change over time. Client sentiment doesn’t predict future market movements and shouldn’t be treated as a trading signal.
Summary – Microsoft 2026
- As of 12:52pm UTC on 4 August 2026, Microsoft was trading near $478.33, within an intraday range of $467.92–$490.67.
- Over the previous two years, the shares traded between a low of approximately $348.34 in April 2025 and a high of $562.58 in July 2025. Based on the cited prices, they had risen around 18.8% over that period.
- According to TradingView, the RSI stood near 78.27 and the stochastic indicator also showed an elevated reading. The price remained above the cited moving averages, while the ADX didn’t confirm a strong established trend.
- The main factors shaping the outlook include Azure growth, Microsoft’s AI-related capital expenditure plans and wider conditions across US equity markets. Geopolitical developments may also influence sentiment, although their effect can vary over time.
- Recent attention has focused on Microsoft’s fiscal fourth-quarter results, released on 29 July 2026, and the analyst price target revisions that followed. These targets represent third-party forecasts rather than guaranteed outcomes.
Past performance is not a reliable indicator of future results.
FAQ
Who owns the most Microsoft shares?
The article doesn’t cover Microsoft’s shareholder ownership structure or identify its largest individual or institutional investors. Ownership levels can also change as funds rebalance portfolios and investors buy or sell shares. Readers looking for this information should refer to Microsoft’s latest regulatory filings or institutional ownership disclosures. These sources provide a more current view of major shareholders than a price forecast or technical analysis article.
What is the five-year Microsoft share price forecast?
The article doesn’t provide a five-year Microsoft share price forecast. The third-party estimates covered here focus mainly on 12-month targets, with consensus figures clustering around $560–$570 and some individual forecasts extending higher. Longer-term projections involve greater uncertainty because Microsoft’s earnings, Azure growth, AI spending, valuation and wider market conditions may change substantially over five years. Any long-range estimate should therefore be treated as speculative rather than predictive.
Is Microsoft a good stock to buy?
Whether Microsoft is a suitable stock depends on an individual’s objectives, risk tolerance, time horizon and wider financial circumstances. The article highlights potential drivers such as Azure growth and demand for AI-related services, alongside risks including high capital expenditure, valuation sensitivity and possible slower cloud growth. Analyst targets and technical indicators can provide context, but they don’t determine whether the shares are appropriate for a particular investor.
Could Microsoft shares go up or down?
Yes. Microsoft shares could rise or fall depending on company performance, market expectations and broader conditions. Potential upward drivers include stronger Azure growth, higher Copilot adoption and improved returns from AI investment. Downside risks include weaker cloud growth, margin pressure from capital expenditure, valuation concerns and changes in wider equity-market sentiment. Technical levels may help traders identify reference areas, but they can’t predict the direction or scale of future price moves.
Should I invest in Microsoft shares?
The article can’t determine whether you should invest in Microsoft shares. It presents third-party forecasts, recent earnings data, technical indicators and potential risks to help explain the factors influencing the price. Any decision should reflect your own objectives, financial circumstances and tolerance for loss. Analyst forecasts may change, and past performance isn’t a reliable indicator of future results. Consider conducting independent research before making any investment decision.
Can I trade Microsoft CFDs on Capital.com?
Yes, you can trade Microsoft CFDs on Capital.com. Trading share CFDs lets you speculate on price movements without owning the underlying asset and to take long or short positions. However, contracts for difference (CFDs) are traded on margin, and leverage amplifies both profits and losses. You should ensure you understand how CFD trading works, assess your risk tolerance, and recognise that losses can occur quickly.