

Amazon stock forecast: Nasdaq volatility and pre-earnings positioning
Amazon is due to report its Q2 2026 results on 30 July, after Q1 revenue rose 16.6% year on year to $181.52bn. Explore third-party AMZN price targets and technical analysis. Past performance is not a reliable indicator of future results.
Amazon.com, Inc. (AMZN) is trading at $237.85, and the session's intraday range was $237.60–$248.04 as of 1:11pm UTC on 23 July 2026. Past performance is not a reliable indicator of future results.
The pullback comes amid broader Nasdaq volatility, with chip and technology shares recording mixed performances in July after a strong first-half rally that included multiple Dow records above 53,000 (Investopedia, 6 July 2026). Investor attention is now turning to Amazon's Q2 2026 earnings release, scheduled for after market close on 30 July 2026, followed by a conference call (Business Wire, 16 July 2026). Trading activity may also reflect positioning ahead of the report (MarketBeat, 21 July 2026). In Q1 2026, Amazon's revenue rose 16.6% year on year to $181.52bn (Barchart, 29 April 2026).
Third-party Amazon outlook: Q2 earnings, AWS growth, and AI spending
As of 23 July 2026, third-party Amazon stock predictions show a range of 12-month projections based partly on differing expectations for AWS growth and AI-related capital spending. The following summaries cover specific, dated forecasts from independent sources ahead of Amazon's 30 July earnings release.
Wells Fargo (broker price target)
Wells Fargo raised its 12-month price target for Amazon to $313 and maintained a positive stance on the shares The bank identified expected AWS growth as the main driver of its projection (Investing.com, 2 July 2026).
TD Cowen (broker price target)
TD Cowen set a 12-month price target of $340 for Amazon, down from $350, and maintained a Buy rating. Its outlook reflects an assessment of momentum in Amazon's cloud segment ahead of the next earnings report (Yahoo Finance, 9 July 2026).
MarketBeat (broker consensus)
MarketBeat's aggregated broker data projects an average 12-month price target of $312.79 for Amazon, with a Moderate Buy consensus based on forecasts from 60 brokerages. The data includes 57 Buy ratings and three Hold ratings, with no Sell ratings recorded (MarketBeat, 11 July 2026).
Public.com (consensus overview)
Public.com reports a 12-month price target of $307.48 for Amazon, based on estimates from 40 analysts covering the stock. Collectively, they assigned it a consensus Buy rating. The projection reflects differing assumptions about demand for cloud services and investment in AI infrastructure (Public.com, 21 July 2026).
MarketScreener (analyst consensus)
MarketScreener reports an average 12-month price target of $313.13 for Amazon, based on estimates from 66 analysts. Individual forecasts range from $207 to $370. This reflects differing views on the durability of AWS growth and the pace of AI-related capital expenditure (MarketScreener, 22 July 2026).
Predictions and third-party forecasts are inherently uncertain, as they cannot fully account for unexpected market developments. Past performance is not a reliable indicator of future results.
Amazon Q2 2026 earnings: what to expect
Amazon is scheduled to report its Q2 2026 financial results on 30 July 2026. The company has confirmed a conference call at 2pm PT/5pm ET on the same day (Amazon.com IR, 15 July 2026). Amazon will webcast the call and accompanying slides live, with a recording available on its investor relations site for at least three months (Business Wire, 16 July 2026).
Amazon previously guided for second-quarter net sales of $194bn–$199bn, according to guidance issued with its first-quarter results (Amazon.com IR, 29 April 2026). Consensus estimates compiled by Zacks Investment Research, based on forecasts from 14 analysts, put expected earnings per share (EPS) at $1.82. This compares with reported EPS of $1.68 in the same quarter a year earlier (Nasdaq, 21 July 2026).
In Q1 2026, Amazon reported EPS of $2.78, compared with a consensus estimate of $1.63. Revenue rose 16.6% year on year to $181.52bn, above the analyst estimate of $177.28bn (Yahoo Finance, 29 April 2026), while AWS revenue increased 28% year on year, its highest growth rate in 15 quarters (GeekWire, 29 April 2026). Amazon also reported capital expenditure of $43.20bn as it continued to invest in AI infrastructure (Amazon.com IR, 29 April 2026).
Past or simulated performance is not a reliable indicator of future results. Forecast figures may also change before Amazon publishes its confirmed results on 30 July 2026.
AMZN stock price: technical overview
As of 1:11pm on 23 July 2026, the AMZN stock price trades near $237.85, below its 20-, 50- and 100-day simple moving averages (SMAs) of approximately $244, $251 and $241 respectively, but above its 200-day SMA near $234, according to TradingView data. With the price below the shorter-term averages, the indicators do not show a consistent upward alignment (TradingView, 23 July 2026).
Momentum readings are mixed to neutral. The 14-day relative strength index (RSI) stands at 48.40, within its neutral range, while the 14-day average directional index (ADX) is 20.39. This is below the level of 25 that technical analysts commonly associate with an established trend (TradingView, 23 July 2026).
Above the current price, the classic R1 pivot near $261 is the nearest technical reference. A daily close above that level could bring the R2 pivot near $285 into focus, according to TradingView's pivot data (TradingView, 23 July 2026).
Below the current price, the classic pivot near $244 is the closest reference, while the 200-day SMA near $234 provides a longer-term technical level. A move below the 200-day SMA could bring the classic S1 pivot near $220 into focus (TradingView, 23 July 2026) (TradingView, 23 July 2026).
This technical analysis is for informational purposes only and does not constitute financial advice or a recommendation to buy or sell any instrument.
Amazon share price history (2024–2026)
AMZN’s stock price has traded within a wide range over the past two years, moving from a low near $151.70 in early August 2024 to an all-time closing high of $274.99 on 6 May 2026. The stock began the summer of 2024 in the $180s before falling to its low for that year during a broader technology-sector pullback. It then recovered through late 2024 and early 2025.
The share price fell more sharply in April 2025, reaching approximately $161.51 on 7 April. The decline coincided with new US tariff announcements and wider uncertainty about global trade. From there, the stock recovered and moved above $270 by late May 2026 as market participants assessed AWS growth and Amazon's investment in AI infrastructure.
More recently, AMZN has declined from those highs, trading near $237.50 on 23 July 2026 as investors assessed their positions ahead of the company's 30 July earnings release. Over the preceding year, the share price was broadly unchanged to slightly higher, while remaining below its 52-week high of $278.56.

Past performance is not a reliable indicator of future results. Share prices are indicative and may differ from live market prices.
Amazon (AMZN): Capital.com analyst view
Amazon's share price has been volatile in 2026, moving from a low near $161.51 in early April to an all-time closing high of $274.99 in early May before falling towards $237 by late July. Several factors may have contributed to these moves, including changing US trade policy signals, Amazon's planned AI-related capital expenditure and shifting sentiment towards AWS growth.
Strong first-quarter results, including faster cloud revenue growth, coincided with the spring rise in the share price. However, Amazon's AI infrastructure spending has also led some market observers to consider its possible effect on near-term margins and capital efficiency.
The late-July pullback coincides with positioning ahead of Amazon's second-quarter earnings release. It also shows how expectations around company-specific events can affect a share price independently of broader market movements. Some market participants may interpret current levels as cautious positioning, while others may view the decline as consolidation after the preceding rise.
Past performance is not a reliable indicator of future results. Nothing in this analysis should be interpreted as a recommendation to buy or sell any instrument.
Capital.com’s client sentiment for Amazon CFDs
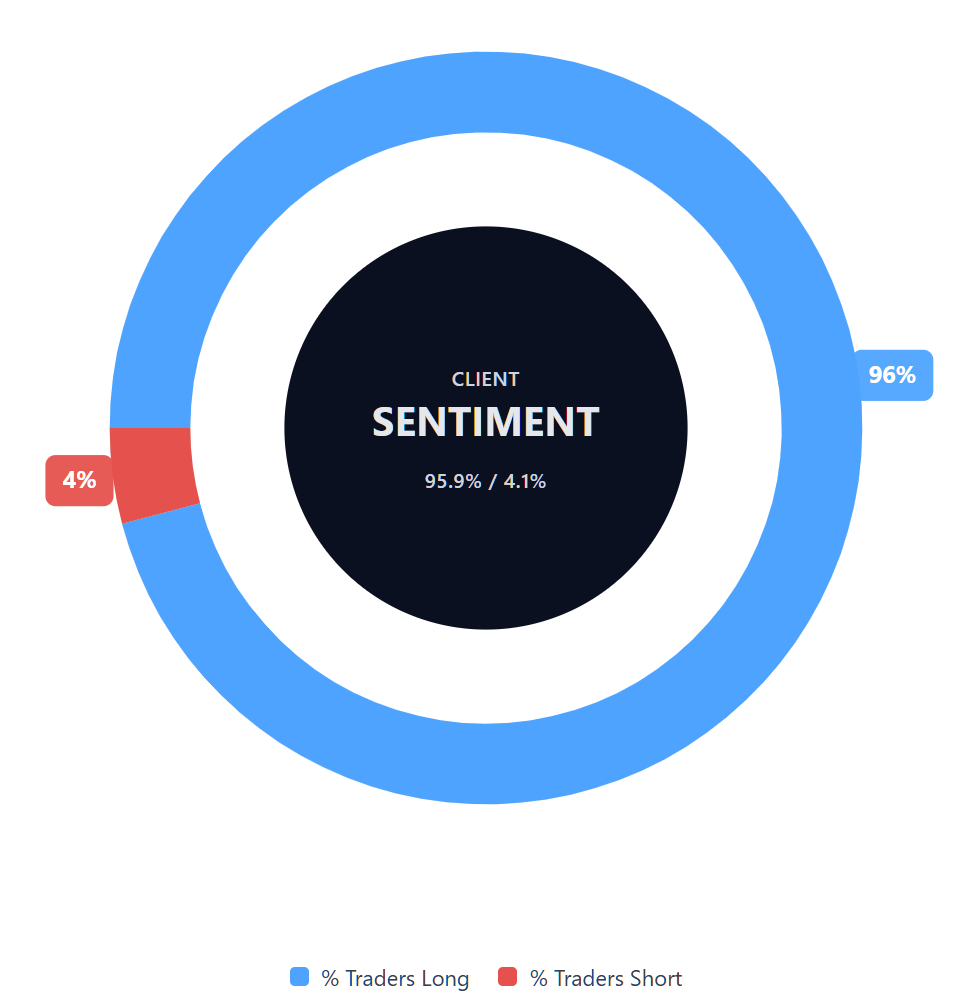
As of 23 July 2026, Capital.com client positioning in Amazon CFDs shows buyers at 95.9% and sellers at 4.1%, a difference of 91.8 percentage points. Open positions are therefore heavily weighted towards buyers, with relatively limited positioning on the sell side. This snapshot reflects open positions on Capital.com and can change.
Summary – Amazon 2026
- As of 1:11pm UTC on 23 July 2026, Amazon (AMZN) traded near $237.85, below its May 2026 high of $274.99 but above its April 2025 low near $161.51.
- On TradingView, technical indicators showed an RSI of 48.40 and an ADX below 25, indicating neutral momentum and no clearly established trend at that time.
- Key factors include AWS growth, AI-related capital expenditure, US trade policy signals and positioning ahead of upcoming earnings.
- Attention has focused on Amazon's scheduled Q2 2026 earnings release on 30 July, alongside analyst price targets spanning $207–$370.
Past performance is not a reliable indicator of future results.
FAQ
Who owns the most Amazon stock?
Amazon founder and executive chair Jeff Bezos is the company’s largest individual shareholder. Large asset managers, including Vanguard and BlackRock, also hold substantial positions on behalf of their funds and clients. Ownership levels can change as shareholders buy or sell shares, so the latest regulatory filings provide the most current figures. Amazon publishes its annual proxy statements and other ownership disclosures through its investor relations website.
What is the five-year Amazon share price forecast?
The forecasts covered in this article focus on 12-month analyst price targets rather than a five-year AMZN stock forecast. July 2026 estimates ranged from $207–$370, highlighting the uncertainty even over a shorter period. A five-year forecast would depend on factors including AWS growth, AI-related spending, competition, margins and wider economic conditions. Long-term projections can change significantly and shouldn’t be treated as reliable indicators of future performance.
Is Amazon a good stock to buy?
Whether Amazon is suitable depends on an individual’s objectives, financial circumstances, risk tolerance and assessment of the company. The article identifies potential drivers such as AWS growth and AI infrastructure investment, alongside risks including high capital expenditure, possible margin pressure and changes in market sentiment. Analyst ratings and price targets represent third-party opinions, not guarantees. This information is for general purposes and doesn’t constitute a recommendation to buy Amazon shares.
Could Amazon stock go up or down?
Yes. Amazon’s share price could move in either direction as traders respond to earnings, AWS performance, AI-related expenditure, trade policy and broader technology-sector conditions. The technical indicators cited in the article showed neutral momentum and no clearly established trend on 23 July 2026. Analyst targets also varied widely, reflecting different assumptions about the company’s prospects. Forecasts can be inaccurate, and past price movements don’t reliably predict future results.
Should I invest in Amazon stock?
This article can’t determine whether investing in Amazon is appropriate for you. That decision requires consideration of your objectives, finances, investment horizon and ability to accept losses. Amazon offers exposure to businesses including ecommerce, cloud computing and digital services, but its shares remain sensitive to earnings expectations, competition, capital expenditure and wider market conditions. Consider conducting independent research and seeking professional financial advice where appropriate before making an investment decision.
Can I trade Amazon CFDs on Capital.com?
Yes, you can trade Amazon CFDs on Capital.com. Trading share CFDs lets you speculate on price movements without owning the underlying asset and to take long or short positions. However, contracts for difference (CFDs) are traded on margin, and leverage amplifies both profits and losses. You should ensure you understand how CFD trading works, assess your risk tolerance, and recognise that losses can occur quickly.