

NVIDIA Share Price: Hopper GPU Access in China
NVIDIA designs graphics processors and AI computing systems, with recent attention focused on reported Hopper GPU access in China and its results due on 26 August 2026. Explore third-party NVDA price targets and technical analysis. Past performance is not a reliable indicator of future results.
NVIDIA Corporation (NVDA) is trading around $208.23 at 9.19am UTC on 4 August 2026, after moving within an intraday range of $197.44–$208.54. Past performance is not a reliable indicator of future results.
Sentiment has been shaped by continued scrutiny of AI chip export policy. Bloomberg reported that China's Moonshot AI had accessed roughly 20,000 Nvidia Hopper-generation GPUs through Alibaba's cloud infrastructure (Bloomberg, 31 July 2026). At the same time, attention across the semiconductor sector is turning to Nvidia's fiscal second-quarter results, scheduled for 26 August 2026 (NVIDIA, 6 July 2026).
Broader market conditions have also influenced sentiment. The Nasdaq Composite fell 1.74% on 22 July 2026 after the Federal Reserve held interest rates steady (Reuters, 29 July 2026). Markets subsequently stabilised, with the broader US 500 index at 7,617 points on 4 August 2026 (Trading Economics, 29 July 2026).
Third-party NVIDIA outlook: China chip access and earnings ahead
As of 4 August 2026, third-party NVIDIA share price predictions reflect differing expectations for AI data-centre demand, chip export policy and upcoming quarterly results. The following summaries outline the latest published views, ordered from the lowest to the highest target.
S&P Global consensus
A poll of 62 analysts published by S&P Global placed NVIDIA's average 12-month price target at $298.93 as of 17 July 2026, with estimates ranging from $180–$500. The consensus rating was Strong Buy, reflecting broad analyst optimism but also substantial variation between individual forecasts (Nasdaq, 17 July 2026).
MarketBeat consensus
MarketBeat reported an average 12-month price target of $303.84 for NVIDIA as of 29 July 2026. The figure was based on estimates from Wall Street analysts, with forecasts ranging up to $500 per share. The spread reflects differing expectations for data-centre capital expenditure and China-related export restrictions ahead of the company's fiscal second-quarter results (MarketBeat, 29 July 2026).
24/7 Wall St.
24/7 Wall St. set a price target of $251.55 for NVIDIA as of 25 June 2026, assigning a 90% buy conviction based on the firm's fair-value model. The forecast balanced expectations of continued AI chip demand against concerns about NVIDIA's valuation relative to historical semiconductor multiples (24/7 Wall St., 25 June 2026).
Predictions and third-party forecasts are inherently uncertain, as they cannot fully account for unexpected market developments. Past performance is not a reliable indicator of future results.
NVIDIA upcoming earnings
NVIDIA is scheduled to report its fiscal 2027 second-quarter results on 26 August 2026 after the market closes. According to the company's investor relations calendar, its conference call is scheduled for 2pm Pacific time, or 5pm Eastern time (NVIDIA, 6 July 2026).
The results will cover the quarter that ended in late July 2026 (NVIDIA, 6 July 2026).
The report follows NVIDIA's fiscal 2027 first-quarter results, published on 20 May 2026. The company reported earnings per share of $1.87, compared with a consensus estimate of $1.77, while revenue reached $81.62bn against a projected $79.19bn (CNBC, 20 May 2026).
The reporting date is based on the company's investor relations announcement and may change. Actual results may also differ from analyst estimates.
NVDA share price: technical overview
As of 9.19am UTC on 4 August 2026, the NVDA share price is trading above most of its main moving averages. According to TradingView data, the 20-, 50-, 100- and 200-day simple moving averages (SMAs) stand at $203.85, $205.84, $200.67 and $193.25, respectively.
The corresponding exponential moving averages (EMAs) are $202.43, $203.57, $200.70 and $191.68. With NVDA trading near $208.23, the share price is above each of these reference levels. However, moving averages lag current price action and do not predict future direction.
The 14-day relative strength index (RSI) stands at 53.07, placing it close to the midpoint of its typical 0–100 range. This indicates broadly neutral momentum rather than an overbought or oversold reading.
Other momentum indicators present a mixed picture. The stochastic %K stands at 44.30, while the Ultimate Oscillator is at 49.48, both close to neutral territory. The MACD level is −1.34 and the Awesome Oscillator is −5.36, while 10-day momentum remains positive at 3.36.
The 14-day average directional index (ADX) stands at 14.29. This is generally associated with a relatively weak or less established trend, although ADX measures trend strength rather than direction.
Using TradingView’s classic pivot framework, the central pivot stands at $201.72. The first resistance level, R1, is near $213.42, followed by R2 at $226.10 and R3 at $250.48. A sustained move above these levels could bring the next resistance reference into focus, but pivot levels alone cannot determine whether such a move will occur.
On the downside, the first classic support level, S1, stands near $189.04, followed by S2 at $177.34 and S3 at $152.96. The 200-day SMA at $193.25 provides another nearby technical reference above S1. Price action would need to confirm any move towards or beyond these levels (TradingView, 4 August 2026).
This technical analysis is for informational purposes only. It does not constitute financial advice or a recommendation to buy or sell any instrument.
NVIDIA share price history (2024–2026)
NVDA’s share price has recorded substantial fluctuations over the past two years, amid changing expectations for AI-related demand and developments in US–China chip export policy.
NVDA closed at $97.65 on 7 August 2024. It subsequently rose as spending on AI infrastructure increased, reaching $238.01 on 14 May 2026 after the release of results showing further growth in data-centre revenue.
The stock also experienced periods of decline. It traded as low as $90.78 in early August 2024 and fell to around $170.40 on 5 February 2026, when concerns about export licensing for sales to China affected market sentiment.
More recently, NVDA moved within a relatively wide range during mid-2026, falling to $191.44 on 29 July before recovering. It closed at $208.28 on 4 August 2026, approximately 11.6% higher year to date and 15.3% higher year on year.
Past performance is not a reliable indicator of future results.

Past performance is not a reliable indicator of future results. Share prices are indicative and may differ from live market prices.
NVIDIA (NVDA): Capital.com analyst view
NVIDIA’s share price performance in 2026 has included periods of volatility alongside an overall upward movement. The stock has traded between roughly $170 and $238 during the year.
This price action has coincided with a mix of potentially supportive and challenging factors. Continued demand for AI data-centre infrastructure has supported expectations for the company’s revenue, while uncertainty around US–China chip export policy has created potential constraints.
Market participants have cited data-centre demand as one factor affecting sentiment. However, NVIDIA’s exposure to this high-growth segment may also represent a concentration risk if customer spending patterns change.
Developments in chip export regulation have sometimes acted as a headwind and, at other times, reduced uncertainty around permitted sales. This shows how the scope and implementation of policy changes can affect the stock in different ways.
NVIDIA’s valuation relative to historical semiconductor-sector averages has also attracted attention. Some market participants may see higher multiples as reflecting future growth expectations, while others may regard them as a factor that could make the share price more sensitive to results that fall below forecasts.
Market conditions remain dynamic, and recent price action does not indicate any particular future direction.
Capital.com’s client sentiment for NVIDIA CFDs
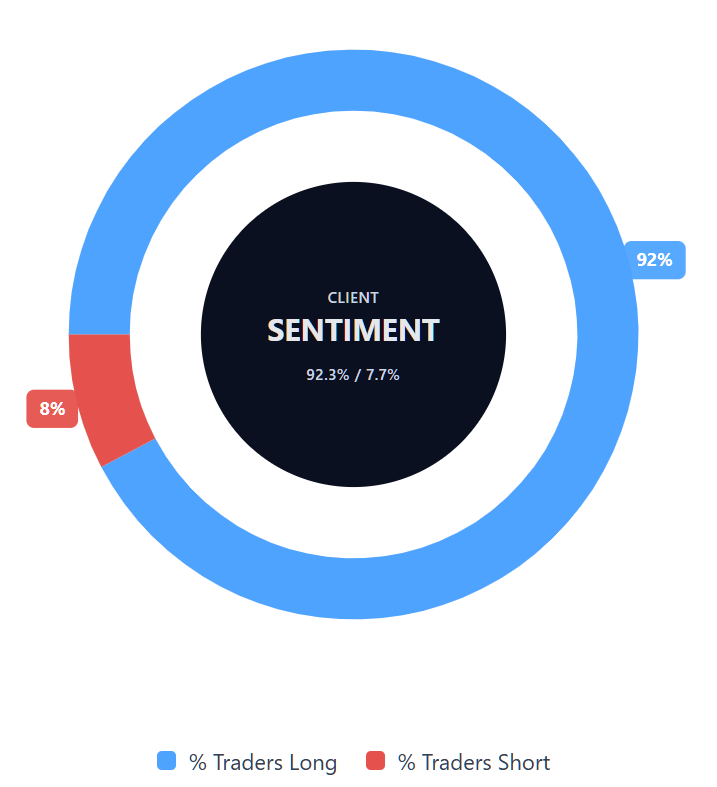
As of 4 August 2026, Capital.com client positioning in NVIDIA CFDs shows a higher proportion of long positions, with 92.3% buyers and 7.7% sellers. This represents a difference of 84.6 percentage points.
The figures indicate a pronounced long-position skew among Capital.com clients included in the data. However, client sentiment does not predict future price movements and should not be considered in isolation.
This snapshot reflects open positions on Capital.com and can change.
Summary – NVIDIA 2026
- As of 9.19am UTC on 4 August 2026, NVIDIA (NVDA) was trading near $208.23. The share price was higher than two years earlier and had recorded both gains and declines during 2026.
- According to TradingView, NVDA was trading above its 20-, 50-, 100- and 200-day SMAs of $203.85, $205.84, $200.67 and $193.25, respectively. The 14-day RSI stood at 53.07, indicating broadly neutral momentum, while the 14-day ADX reading of 14.29 suggested a relatively weak or less established trend.
- Factors that may affect NVDA include demand for AI data-centre infrastructure, developments in US–China chip export policy and changes in broader US equity market conditions.
- Attention is also focused on NVIDIA’s scheduled fiscal 2027 second-quarter results on 26 August 2026, alongside reports that Chinese companies have accessed Hopper-generation GPUs through cloud service providers.
Past performance is not a reliable indicator of future results.
FAQ
Who owns the most NVIDIA shares?
The article does not cover NVIDIA’s current shareholder structure or identify its largest shareholder. Ownership levels can change as investors buy or sell shares, so the latest regulatory filings and institutional ownership disclosures provide the most reliable information. These records may distinguish between company insiders, institutional investors and individual shareholders. Ownership concentration can influence voting power, but it does not by itself indicate how NVIDIA’s share price may perform.
What is the five-year NVIDIA share price forecast?
The article does not provide a five-year NVIDIA share price forecast. The third-party estimates discussed cover a 12-month period and range from $180–$500, reflecting different assumptions about AI demand, export policy and future earnings. Forecasting several years ahead involves greater uncertainty because business performance, regulation, competition and market conditions can change. Long-term price targets should therefore be treated as scenarios rather than reliable predictions.
Is NVIDIA a good stock to buy?
Whether NVIDIA is a suitable stock to buy depends on an individual’s objectives, financial circumstances and tolerance for risk. The article highlights potential supporting factors, including demand for AI data-centre infrastructure, alongside risks such as export restrictions, valuation concerns and reliance on a high-growth segment. Analyst targets also vary widely. These factors do not establish whether the stock is suitable for any particular investor, and the article does not provide investment advice.
Could NVIDIA shares go up or down?
Yes. NVIDIA shares could move in either direction as traders respond to earnings, AI infrastructure demand, export policy, valuation and wider market conditions. The article notes that recent technical indicators point to an established trend and relatively strong momentum, but these readings do not predict what happens next. Upcoming results and regulatory developments may also affect volatility. Past performance, analyst forecasts and client sentiment are not reliable indicators of future price movements.
Should I invest in NVIDIA shares?
The article cannot determine whether you should invest in NVIDIA shares. That decision depends on factors such as your financial goals, time horizon, portfolio exposure and willingness to accept losses. NVIDIA may benefit from continued demand for AI infrastructure, but it also faces risks linked to export controls, valuation and changes in customer spending. Consider these factors alongside independent research and, where appropriate, guidance from a qualified financial adviser.
Can I trade NVIDIA CFDs on Capital.com?
Yes, you can trade NVIDIA CFDs on Capital.com. Trading share CFDs lets you speculate on price movements without owning the underlying asset and to take long or short positions. However, contracts for difference (CFDs) are traded on margin, and leverage amplifies both profits and losses. You should ensure you understand how CFD trading works, assess your risk tolerance, and recognise that losses can occur quickly.