

Tesla share price: NHTSA review, record revenue
Tesla shares rose for a third consecutive session while the NHTSA reviewed a reported safety issue, though the stock remained down around 31% year to date in early August. Explore third-party TSLA price targets and technical analysis. Past performance is not a reliable indicator of future results.
Tesla, Inc. (TSLA) was trading near $323.99 early at 10.30am UTC on 4 August 2026, within an intraday range of $310.77–$325.60. Past performance is not a reliable indicator of future results.
Recent price movements came while the National Highway Traffic Safety Administration probed nearly 1.2 million Tesla vehicles over a reported suspension issue involving front lower lateral link detachment (Reuters, 31 July 2026).
Third-party Tesla outlook: NHTSA review and post-earnings
As of 4 August 2026, third-party Tesla share price predictions reflected differing views on Full Self-Driving development, robotaxi expansion and margins following the company’s second-quarter results.
Piper Sandler (house view)
Piper Sandler lowered its Tesla price target to $450 from $500 while maintaining an overweight rating. The target suggested that the shares could reach this level within the following 12 months, with the firm citing margin pressure after the second-quarter earnings miss as the reason for the reduction (MarketBeat, 27 July 2026).
MarketBeat (consensus overview)
MarketBeat's tally of 45 Wall Street analysts placed Tesla's average 12-month price target at $401.74, with estimates ranging from $25.28 to $600, representing potential upside of about 24.7% from the prevailing price at the time of publication, with a consensus rating of Hold based on one strong-buy, 21 buy, 19 hold and four sell ratings (MarketBeat, 3 August 2026).
Stock Analysis (consensus overview)
Stock Analysis reported an average 12-month Tesla price target of $397.87, based on projections from 47 analysts, representing potential upside of about 23.77% from the latest recorded price, with a consensus rating of Buy (Stock Analysis, 4 August 2026).
Stifel (house view)
Stifel estimated that Tesla could reach $491 over the following 12 months, having reduced its target from $508 while maintaining a Buy rating, with analyst Stephen Gengaro identifying Full Self-Driving adoption and robotaxi execution as the main variables behind the revised projection (Investing.com, 3 August 2026).
MarketBeat (house view roundup)
MarketBeat reported a Mizuho price target of $450 for Tesla shares over a 12-month horizon, with the bank maintaining an Outperform rating after balancing expectations for higher delivery volumes against concerns about near-term margins (MarketBeat, 27 July 2026).
Predictions and third-party forecasts are inherently uncertain, as they cannot fully account for unexpected market developments. Past performance is not a reliable indicator of future results.
Tesla: latest and upcoming earnings
Tesla's most recent financial disclosure covered its second-quarter 2026 results, released after market close on 22 July 2026 through a Form 8-K filing and an update on its Investor Relations website (Tesla Investor Relations, 22 July 2026).
The company reported record quarterly revenue of $28.24bn, up 26% year on year and ahead of previous guidance references, along with GAAP operating income of $0.4bn and non-GAAP net income of $1.2bn.
Tesla's shareholder update reported an automotive gross margin, excluding regulatory credits, of 16.3%, down from 19.2% in the first quarter of 2026, along with second-quarter deliveries of 480,126 vehicles and energy storage deployments of 13.5 GWh (Tesla Investor Relations, 22 July 2026).
Management hosted a live webcast at 4.30pm Central Time on the same day to discuss the results and outlook with investors.
At the time of writing, Tesla's next quarterly earnings report, covering the third quarter of 2026, was expected on 21 October 2026 after market close, based on the company's historical reporting pattern, with the date not formally confirmed by Tesla (Nasdaq, 21 July 2026).
TSLA share price: technical overview
As of 10.30am UTC on 4 August 2026, the TSLA share price was trading below its key moving-average cluster. According to TradingView data, the 20-, 50-, 100- and 200-day simple moving averages (SMAs) stood at approximately $359, $389, $388 and $411, respectively.
The 20-day SMA remained below the 50-day SMA, meaning the indicators did not show a bullish alignment. The price also remained below the 200-day exponential moving average (EMA), which stood near $390. Together, these readings were consistent with the broader downward structure displayed on the platform.
Momentum readings were subdued. The 14-day relative strength index (RSI) stood near 36.8, within the lower part of neutral territory, while the 14-day average directional index (ADX) was 30.8. The ADX reading indicated a defined trend, although the indicator does not show its direction.
The classic central pivot above the latest price stood at approximately $347, followed by the first resistance level, R1, near $397. A daily close above R1 would bring the second resistance level, R2, near $483, into view, according to TradingView’s pivot data.
On the downside, the first support level, S1, stood near $261. The 100-day SMA near $388 remained above the latest price and therefore represented a potential resistance reference rather than support.
The nine-period Hull moving average stood notably lower, near $307, reflecting its greater sensitivity to recent price changes than longer-term averages (TradingView, 4 August 2026).
This technical analysis is for informational purposes only and does not constitute financial advice or a recommendation to buy or sell any financial instrument.
Tesla share price history (2024–2026)
TSLA’s share price recorded wide fluctuations over the past two years. The shares reached a low of approximately $182.06 on 5 August 2024 before rising during late 2024. They reached an all-time closing high of $479.86 on 17 December 2024 as market expectations surrounding autonomous driving and the company’s political connections increased.
The rally reversed during early 2025, with the stock falling to $215.30 by 10 March 2025 amid concerns about brand perception and lower delivery figures.
The shares later recovered, reaching $448.35 on 13 May 2026 as attention turned towards progress on Tesla’s robotaxi plans. The price subsequently declined again.
By late July 2026, TSLA had fallen to around $296.95 on 29 July 2026 after the company’s second-quarter results highlighted pressure on margins. The shares closed at $324.02 on 4 August 2026, leaving the stock down by roughly 10% over the two-year period compared with its level in early August 2024.

Past performance is not a reliable indicator of future results. Share prices are indicative and may differ from live market prices.
Tesla (TSLA): Capital.com analyst view
Tesla’s share price showed pronounced volatility during 2026, moving between roughly $296–$448 over recent months. Market participants weighed delivery and revenue growth against pressure on margins.
Record second-quarter deliveries and revenue growth provided support at some points, while lower-than-expected profitability and rising capital expenditure contributed to downward pressure at others. This shows how investors may interpret the same operational results differently depending on the metrics they prioritise.
Autonomous driving and robotaxi expansion remained recurring themes in market analysis. Some analysts viewed these areas as potential sources of long-term growth. Others noted that large-scale deployment continued to depend on unreleased software updates and regulatory approval, creating uncertainty around the timing.
Tesla’s pricing measures also presented competing considerations. Although they supported delivery volumes, they raised questions about their effect on automotive margins. Investors could therefore view the strategy as either supporting demand or limiting profitability, depending on their assumptions.
Tesla’s price action continued to reflect differing assessments of its longer-term growth prospects and near-term financial performance. Past performance is not a reliable indicator of future results.
Capital.com’s client sentiment for Tesla CFDs
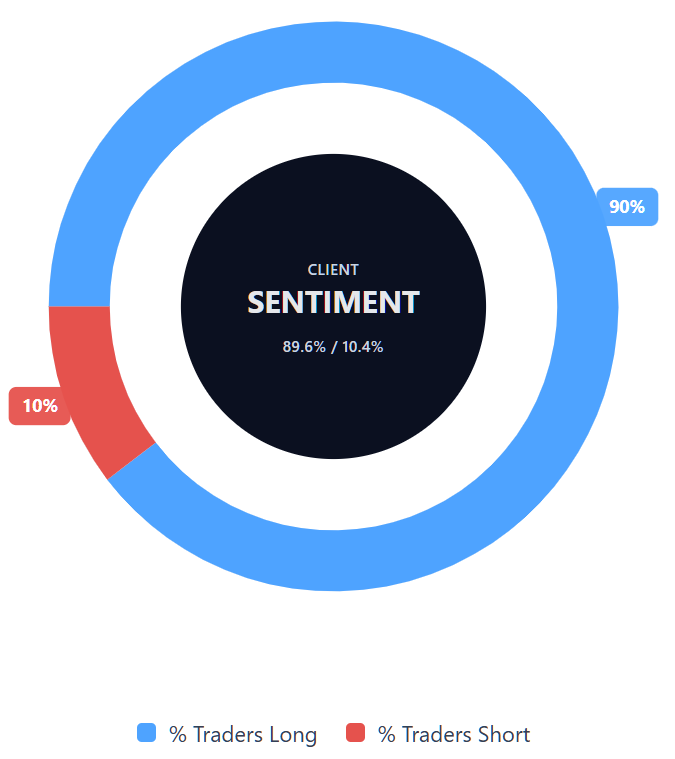
As of 4 August 2026, Capital.com client positioning in Tesla CFDs was weighted towards long positions, with 89.6% of open positions held by buyers and 10.4% by sellers. This placed buyers ahead by 79.2 percentage points.
This snapshot reflects open positions held by Capital.com clients at a specific point in time and can change. Client sentiment does not predict future price movements and should not form the sole basis of a trading decision.
Summary – Tesla 2026
- As of 10.30am UTC on 4 August 2026, Tesla (TSLA) was trading near $323.99, within an approximate two-year range of $182.06–$479.86.
- According to TradingView, the price was below several key moving averages. The RSI was in the lower part of neutral territory, while the shorter-term moving averages did not show a bullish alignment.
- Factors that could influence Tesla’s price included delivery growth, robotaxi and Full Self-Driving progress, automotive margin pressure and planned capital expenditure during 2026.
- Recent developments included second-quarter results showing record revenue alongside lower-than-expected profitability, an NHTSA safety inquiry and continued work on the Cybercab programme.
Past performance is not a reliable indicator of future results.
FAQ
Who owns the most Tesla shares?
The article doesn’t identify Tesla’s largest shareholder. Ownership can also change as investors buy or sell shares and companies update their regulatory filings. To check the latest position, review Tesla’s most recent filings and recognised institutional ownership data. These sources can show holdings reported by major shareholders, although publication delays mean the figures may not reflect transactions completed after the reporting date.
What is the five-year Tesla share price forecast?
The article focuses on 12-month analyst targets rather than a five-year TSLA share price forecast. Longer-term estimates carry greater uncertainty because they depend on variables such as delivery growth, margins, capital expenditure, Full Self-Driving development, robotaxi deployment and regulation. Forecasts may also change as new financial results and market information become available. For this reason, five-year projections should be treated as scenarios rather than reliable estimates.
Is Tesla a good stock to buy?
The article doesn’t determine whether Tesla is a good stock to buy. It outlines both potential drivers and risks, including delivery and revenue growth, margin pressure, rising capital expenditure, regulatory uncertainty and the execution of Tesla’s autonomous-driving plans. Whether the shares are suitable depends on an individual’s objectives, financial circumstances and risk tolerance. Past performance, analyst targets and technical indicators don’t guarantee future results.
Could Tesla shares go up or down?
Yes. Tesla shares could rise or fall in response to company results, delivery figures, margins, capital expenditure, autonomous-driving developments, regulation and broader market conditions. The article also shows that analysts hold differing views, with price targets spread across a wide range. Technical indicators may provide context on recent price behaviour, but they can’t predict future movements. Unexpected events can also cause the market to move quickly in either direction.
Should I invest in Tesla shares?
The article doesn’t provide a recommendation on whether to invest in Tesla shares. Any decision should consider the potential benefits and risks, including Tesla’s growth plans, profitability, valuation, competitive position and exposure to regulatory or execution challenges. Investors should also assess how the shares fit their wider portfolio, time horizon and capacity for loss. Independent financial advice may be appropriate where personal guidance is needed.
Can I trade Tesla CFDs on Capital.com?
Yes, you can trade Tesla CFDs on Capital.com. Trading share CFDs lets you speculate on price movements without owning the underlying asset and to take long or short positions. However, contracts for difference (CFDs) are traded on margin, and leverage amplifies both profits and losses. You should ensure you understand how CFD trading works, assess your risk tolerance, and recognise that losses can occur quickly.