Fear and Greed Index: a complete guide
Learn about the Fear and Greed Index, the key indicators on which it’s based, and how to manage your emotions in trading effectively with Capital.com.
What is the Fear and Greed Index?
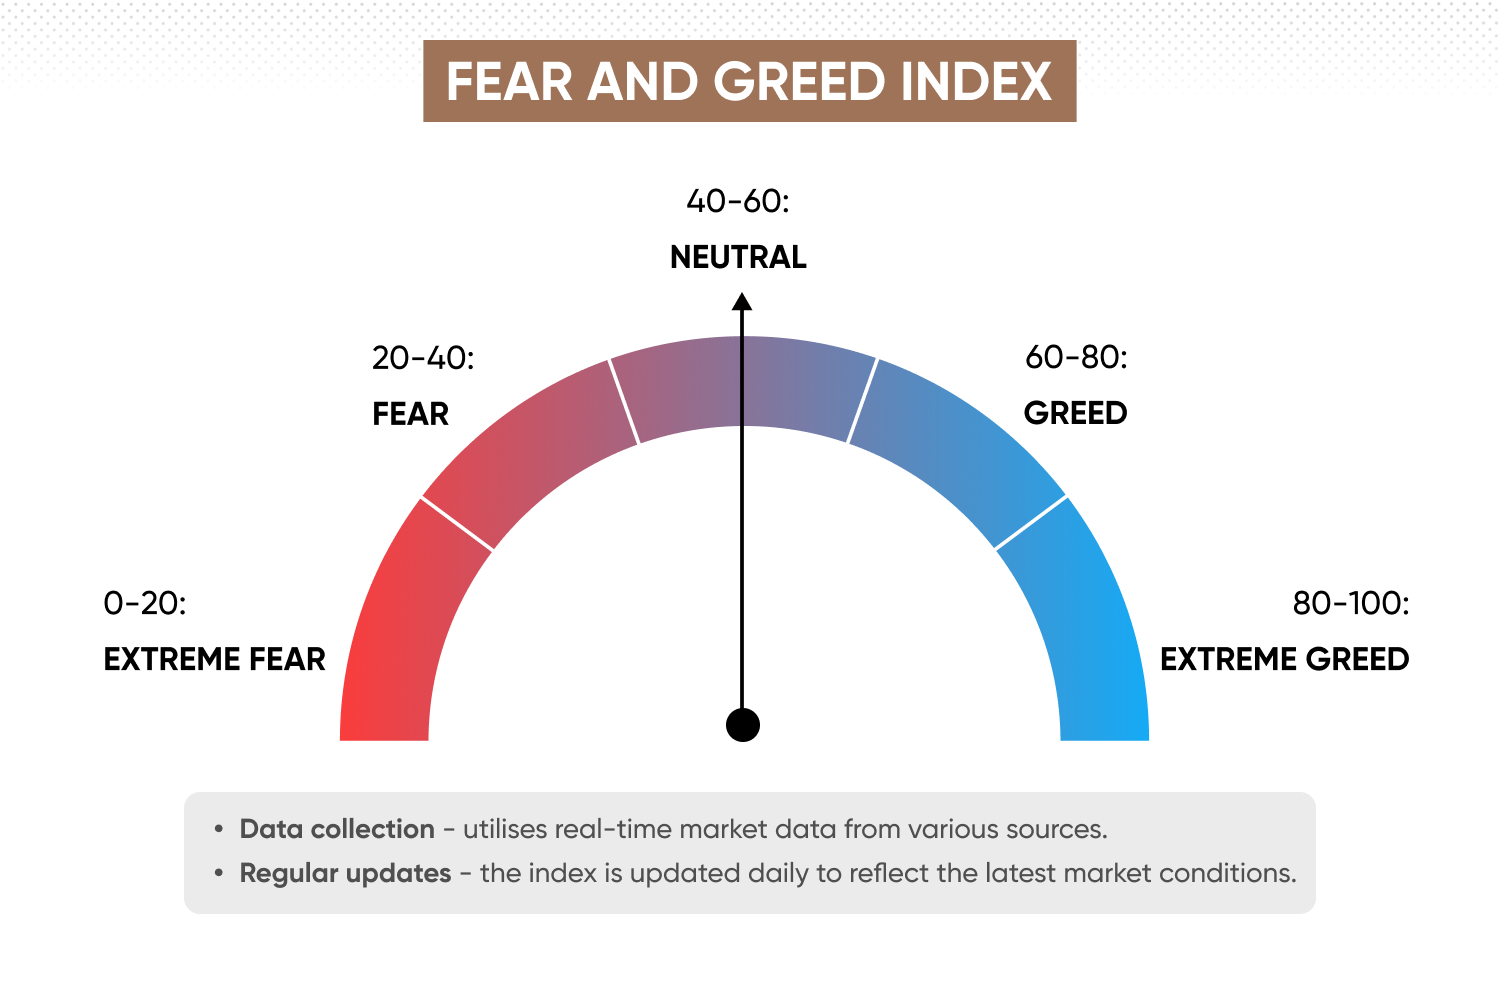
The Fear and Greed Index measures the overall sentiment of the US stock market, reflecting how emotions in trading can drive market behaviour. Introduced by CNN Money (now CNN Business) in 2012, the index operates on a scale from 0 (extreme fear) to 100 (extreme greed), with a score near 50 representing neutral sentiment.
This index helps traders assess whether the market is potentially overvalued or undervalued based on emotional reactions rather than fundamentals. It also provides insights into crowd psychology, showing how collective emotions can fuel market volatility and impact trading behaviour.
While the Fear and Greed Index can offer insights into market sentiment and serve as a reference alongside other benchmarks, trading decisions should ultimately reflect your personal risk tolerance and financial objectives. Remember, past sentiment indicators are not guarantees of future performance, and all trading carries risk.
How does the Fear and Greed Index work?
The Fear and Greed Index works by analysing seven key market indicators that reflect trader behaviour in the US stock market. These indicators measure factors like market volatility, stock price strength, and demand for safe-haven assets, each representing a unique element of market sentiment. The indicators are equally weighted to produce a score between 0 and 100, where 0 reflects extreme fear and 100 reflects extreme greed. A score between 40 and 60 indicates mostly neutral sentiment.
The index acts like a barometer, with the needle swinging left toward fear when traders are risk-averse and right toward greed when risk appetite increases. Traders often use this information to gauge whether the market is overvalued or undervalued and make strategic decisions accordingly.
Fear and Greed Index indicators
The seven indicators that make up the Fear and Greed Index are stock price momentum, stock price strength, stock price breadth, put and call options, market volatility, safe haven demand, and junk bond demand. Each of these indicators is scored individually, and the average of these scores constitutes the overall Fear and Greed Index reading.
Here are the seven indicators in more depth:
- Stock price momentum compares the US 500 index to its 125-day moving average (MA) to assess market trends. If the index is above its 125-day MA, it suggests positive momentum, indicating greed. Conversely, if it is below, it suggests negative momentum, indicating fear.
- Stock price strength evaluates the number of stocks hitting 52-week highs versus those hitting 52-week lows on the New York Stock Exchange (NYSE) and Nasdaq Stock Market. A higher number of stocks reaching new highs indicates greed, while more stocks hitting new lows indicates fear.
- Stock price breadth analyses the volume of shares traded in rising stocks compared with those in falling stocks on the NYSE. A higher trading volume in rising stocks indicates greed, while a higher trading volume in declining stocks indicates fear.
- Put and call options examine the ratio of put options (used to sell assets) versus call options (used to buy assets) on the Chicago Board Options Exchange (CBOE) to gauge market expectations. A higher ratio of put options indicates fear, as traders are hedging against potential price declines. Conversely, more call options signals greed, as traders are betting on price increases.
- The Volatility Index (VIX) often referred to as the ‘fear index’, measures market volatility and risk, particularly focusing on a 50-day moving average. A higher VIX reflects greater market fear and uncertainty, while a lower VIX suggests greed and market complacency.
- The safe haven demand indicator measures the demand for safer assets, such as US Treasury bonds, compared to stocks in the US 500 index. When demand for treasury bonds increases, it signals fear as traders seek safety. Conversely, when traders favour stocks over bonds, it may indicate greed, as they are more willing to take risks.
- Junk bond demand looks at the yield spread between lower-rated, higher-yield junk bonds and investment-grade bonds, based on the ICE BofA US High Yield Index and ICE BofA US Corporate Index. A narrowing spread suggests that traders are willing to take on more risk for higher returns (greed), while a widening spread indicates risk aversion (fear).
Historical Fear and Greed Index readings
The Fear and Greed Index is often considered a reliable market indicator for US stocks, and analysing its historical readings can provide traders with valuable insights into how market sentiment might influence potential future market movements.*
The index reached levels of extreme greed in early 2018, when readings above 80 coincided with a strong bull market where stock prices rose rapidly. The high readings reflected investor optimism and aggressive risk-taking behaviour. Shortly after, in February 2018, the market experienced a significant correction, with the US 500 falling by over 10%. The extreme greed reading preceded the market downtown, and gave a signal of overvalued conditions and potential reversals.
In March 2020, during the onset of the COVID-19 pandemic, the Fear and Greed index plummeted to extreme fear levels, with readings below 10, reflecting widespread panic and uncertainty. Shortly after these lows, aggressive fiscal and monetary stimulus measures were introduced, leading to a strong market recovery. Traders who recognised the extreme fear reading as a potential buy signal could have capitalised on the subsequent rally.
However, there are instances where the Fear and Greed Index has provided false signals. For example, in late 2019, the index indicated levels of greed, suggesting that the market might be overvalued. Despite this, the market continued to climb into early 2020 before the pandemic-induced crash.
The Fear and Greed Index is a sentiment indicator and doesn't account for fundamental market factors. Traders should use it alongside technical analysis and additional indicators for a more comprehensive view.
*Remember that past performance does not guarantee future results, and the Fear and Greed Index works best when combined with additional tools – such as chart patterns and technical indicators – to help confirm its readings.
How does the Fear and Greed Index affect traders?
Using the Fear and Greed Index can help traders avoid making emotionally driven decisions. For example, it can prevent you from succumbing to the herd mentality of buying high during periods of greed or selling low during periods of fear. Instead, you can adopt a contrarian approach, capitalising on the emotional extremes of the market.
Moreover, the index can be used as part of a risk management strategy. By recognising periods of high volatility and uncertainty, you can adjust your position sizes, set appropriate stop-loss levels, and manage exposure to higher-risk positions.
However, the Fear and Greed Index should not be the sole basis for trading decisions. It’s a tool to complement other forms of analysis, such as fundamental and technical analysis.
FAQs
How is the Fear and Greed Index calculated?
The Fear and Greed Index is calculated by equally weighting seven different market indicators that reflect various aspects of investor sentiment. Each indicator measures a specific factor like market momentum, volatility, or demand for safe haven assets.
Each indicator is scored on a scale from 0 to 100, with higher scores indicating greed and lower scores indicating fear. A score of 40-60 indicates a mostly neutral market sentiment. The average of these seven scores produces the composite Fear and Greed Index reading, which also ranges from 0 to 100.
Can the Fear and Greed Index predict market movements?
While the Fear and Greed index provides valuable insights into market sentiment, it should not be used as a standalone predictor of market movements. It reflects the emotions driving the market at a given time, which may sometimes precede significant market shifts.
Like any indicator, the index provides false signals sometimes. Market movements are influenced by a variety of factors – such as economic data and geopolitical events – and this index is best used alongside technical analysis and additional indicators.
Is the Fear and Greed Index applicable to all financial markets?
The index is primarily designed for the US stock market, but the concept of measuring fear and greed can be applied to other markets. Use sentiment indicators relevant to the specific market or asset class you are trading.
How often is the Fear and Greed Index updated?
The Fear and Greed Index is typically updated daily to reflect the most recent market data, allowing traders to monitor changes in market sentiment and adjust their strategies accordingly. Some components of the index may also be tracked intraday for more granular analysis.