Heikin-Ashi trading strategy: how to trade with Heikin-Ashi candles
In this guide, we'll explore what Heikin-Ashi candlesticks are and how they can be incorporated into a trading strategy.
What are Heikin-Ashi candlesticks?
Candlesticks are one of the oldest forms of technical chart indicators that traders can use in their analysis of asset prices. A candlestick chart is a type of chart used to visualise price movements and identify patterns, with each candle representing a single trading session.
A specific form of candlestick chart is Heikin-Ashi, meaning average (“heikin” or “heiken”) and bar (“ashi”) in Japanese. The candles on these charts differ from traditional Japanese candlestick charts as they incorporate some data from the previous session to show how average values change over time.
 *Past performance is not a reliable indicator of future results
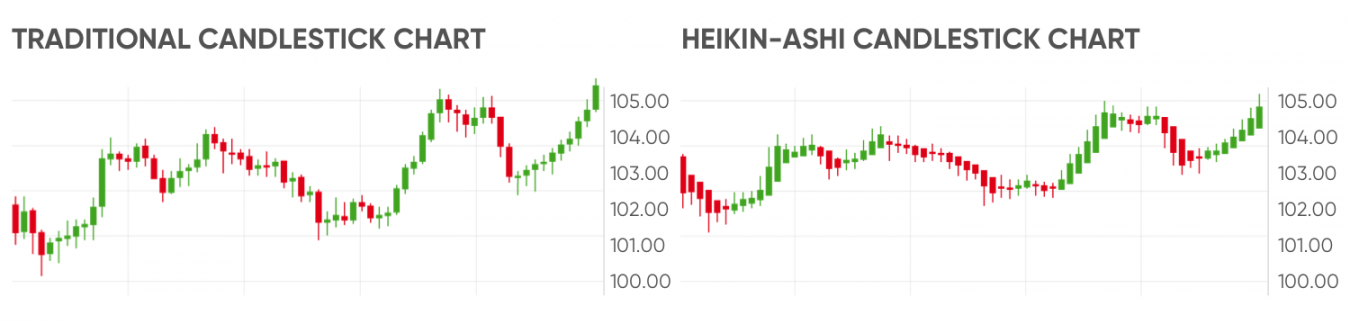
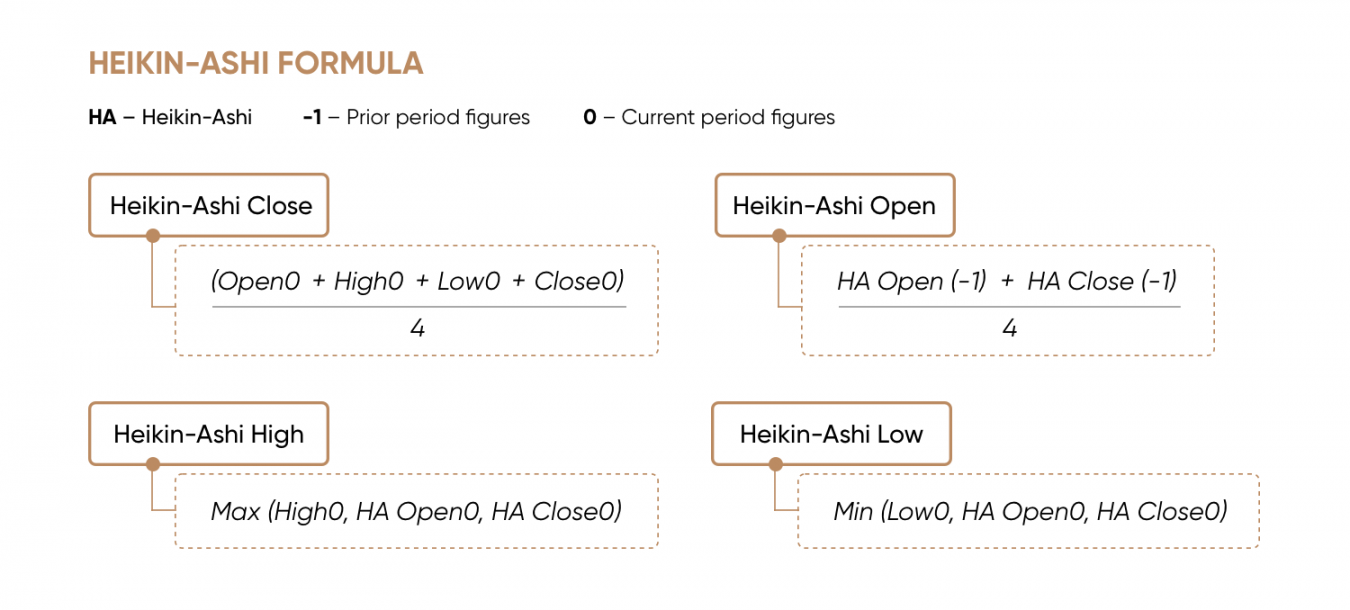
The Heikin-Ashi formula uses a combination of four price averages – open, high, low and close values – from the current and previous trading sessions. This is unlike traditional candlesticks, which use outright open and close prices to form the body of the candle and high and low prices as the shadows, or wicks. As a result, each Heikin-Ashi candle is lined up with the middle of the preceding bar, not with the level of the previous candle’s close.
 *Past performance is not a reliable indicator of future results
The open price used in a Heikin-Ashi candle is based on the average of the open and close from the previous candlestick. The close is an average of the open, high, low and close of the current period, rather than just the closing price. The high on the candle wick is the highest number out of the session open, intraday high, or close. Similarly, the low on the wick is the lowest number of the session low, open or close.
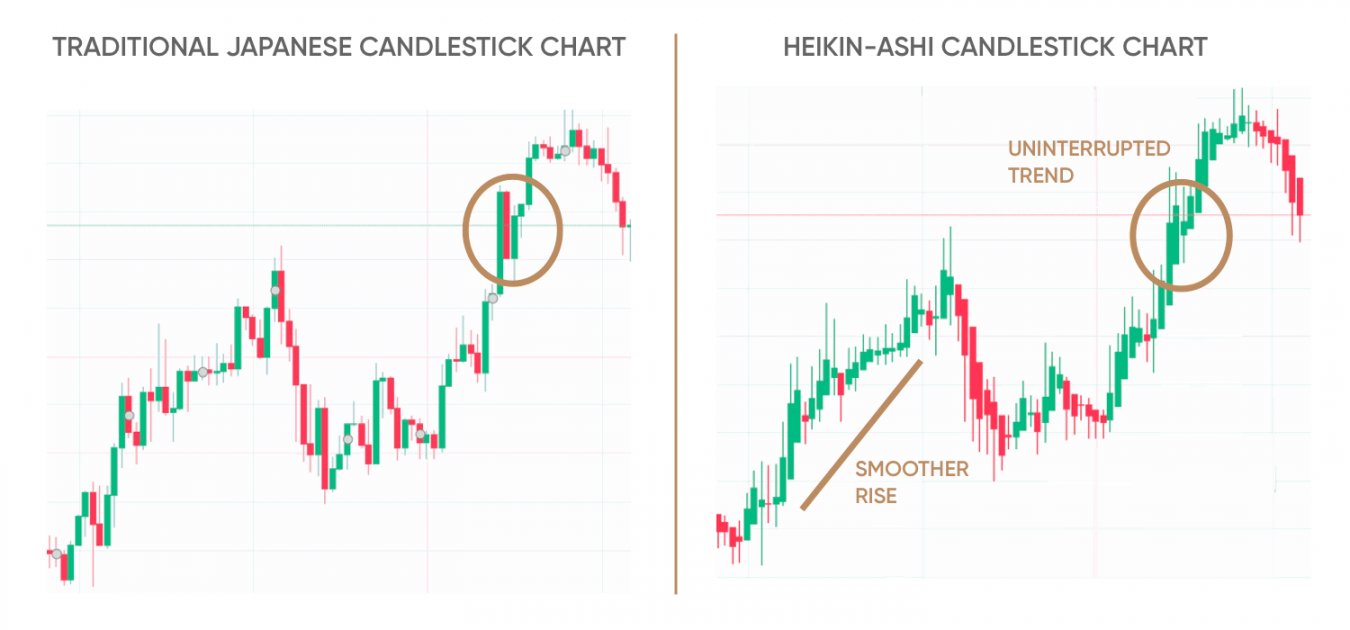
In this way, the Heikin-Ashi calculation creates a smoother-looking candlestick chart that makes it easier to identify and follow price trends.
 *Past performance is not a reliable indicator of future results
A smoother chart is especially useful for analysing choppy or volatile asset prices.
Who invented Heikin-Ashi candlesticks?
Now that we have Heikin-Ashi candles explained, let’s delve deeper into the history.
Heikin-Ashi candles, also sometimes spelled Heiken-Ashi, were developed by Japanese rice trader Munehisa Homma back in the 1700s. Homma is considered by many to be the father of technical analysis for his work in identifying price trends.
The rice market in Osaka at the time operated what could be considered an early version of a futures market using coupons, which were then traded for profit before the rice was physically delivered. Homma observed the influence traders’ emotions had on their trading decisions and identified the impact of sentiment on markets driven by fear and greed. He introduced the concept of price action trading based on expectations of bullish or bearish reversals.
Homma created the first candlestick charts and used them to identify definite trading patterns that formed ahead of changes in the direction of rice prices. Understanding the psychology driving price trends put him at an advantage to other traders, as he outlined in his 1755 book, “The Fountain Of Gold: The Three Monkey Record Of Money”.
Why are Heikin-Ashi candlesticks useful for traders?
Analysis of Heikin-Ashi candles provides a way for traders to identify the start of major price trends and trend reversals by filtering out the day-to-day noise in the stock markets. This is especially useful during periods of high volatility, when it can be easy to lose sight of longer-term movements. Traders can use the charts to identify when to open or hold a trading position and when to exit ahead of a reversal, heavy losses on their investments and avoiding heavy losses.
The Heikin-Ashi indicators can be applied to any time frame – whether hourly, daily, monthly, etc – although charts showing longer time frames are typically more reliable. Combined with other technical indicators they form a fuller picture of the direction of an asset price. Traders can use Heikin-Ashi charts to analyse forex and commodities as well as stocks and indices.
How to interpret Heikin-Ashi candlesticks
Reading Heiken-Ashi candles is relatively straightforward, but it is important for investors to understand how they work and what they represent to be able to use them to make informed trading decisions.
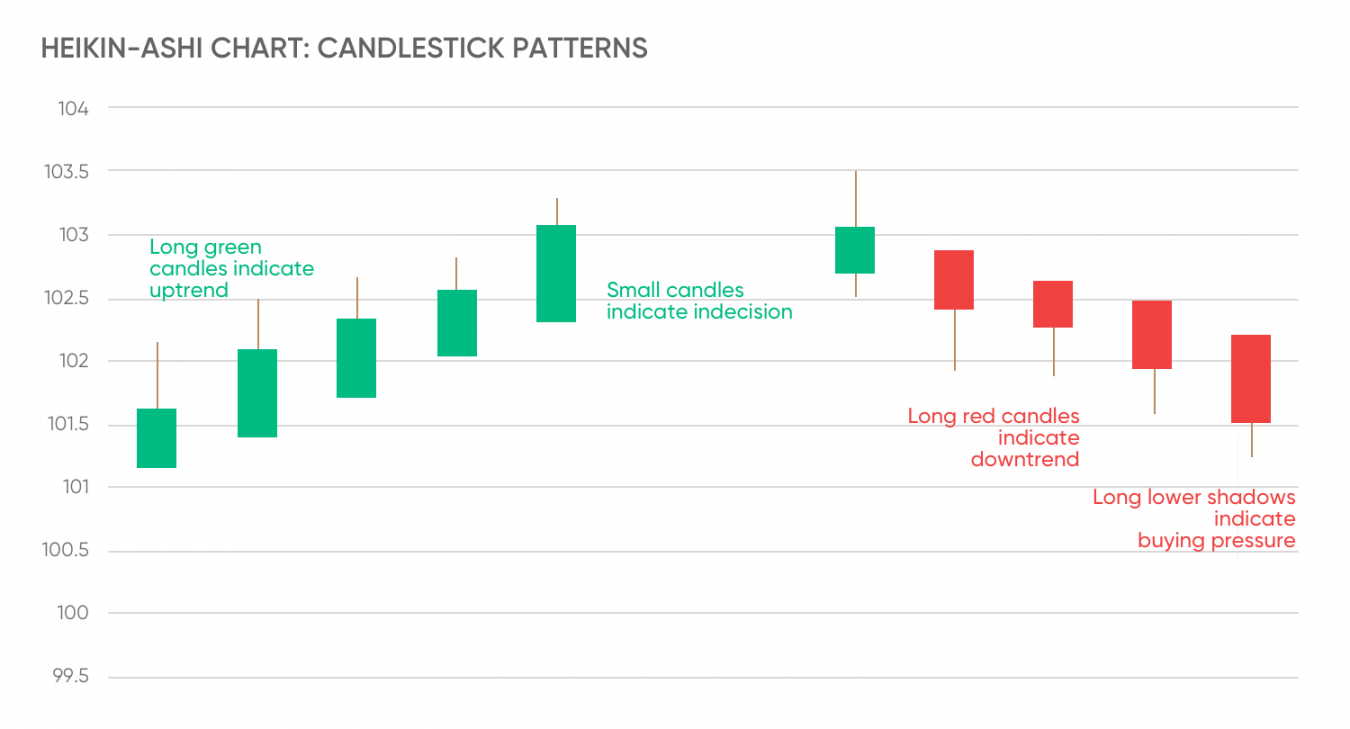
In an upward trending market, a Heikin-Ashi chart will show a progression of green (or other coloured) candlesticks with no lower shadow or wick. Conversely, in a downward trend, there is no upper wick on (typically) red candlesticks.
 *Past performance is not a reliable indicator of future results
When markets are changing direction and sentiment shifting, there is more volatility and candles resemble the dojis on traditional candlestick charts, with smaller bodies and longer wicks. As trends reverse, the candlestick colours switch.
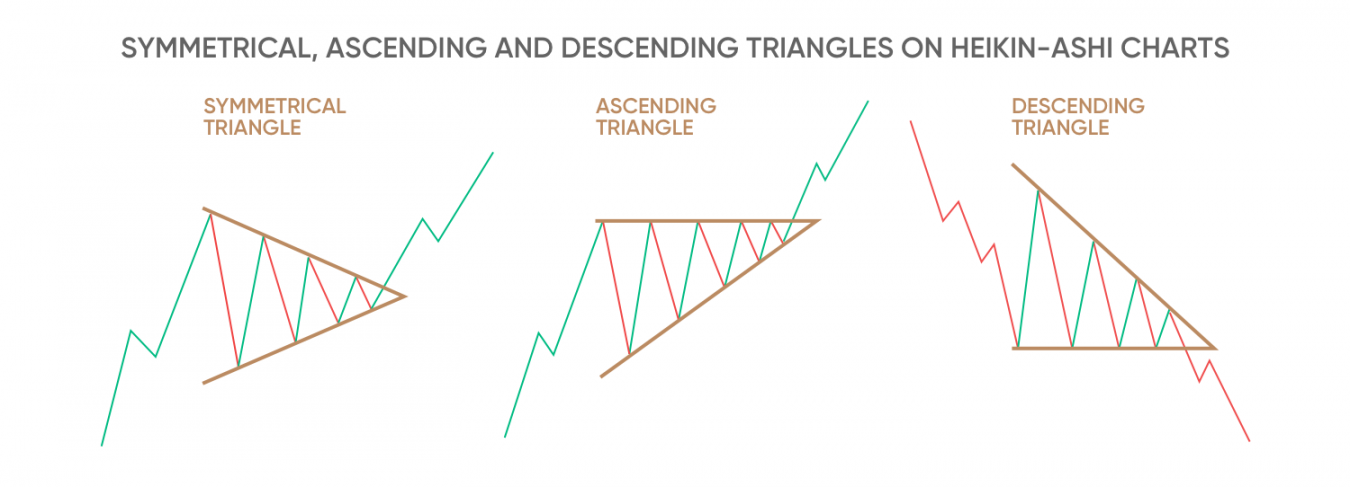
In addition to the candles, there are three kinds of triangles drawn on Heikin-Ashi charts: descending, ascending and symmetrical. If candles break above the upper boundary of an ascending or symmetrical triangle, the upward trend is likely to continue, whereas if there are candles falling below the bottom of a descending triangle, the chart indicates a bearish trend.
 *Past performance is not a reliable indicator of future results
How to trade using Heikin-Ashi candlesticks
Using a Heiken-Ashi candle strategy can help traders to identify the beginning of strong trends and adjust their portfolios accordingly, opening or increasing long positions when bullish trends emerge and closing positions when trends turn bearish.
When charts show candlesticks without wicks, or shadows, on the lower end, they provide a strong signal for the beginning of a bullish trend, which traders can follow to maximise gains rather than selling stocks early and leaving profits on the table. When candlesticks have no wicks on the higher end, they indicate the start of a bearish trend and prompt traders to sell stocks to avoid losses. The longer the sequence of candles without wicks, the stronger the trend it signifies.
Candles with shorter bodies and longer wicks indicate that traders should be aware of a pause in the trend. The trend could then reverse direction, or it could resume its movement in the same direction. This requires some skill and experience to interpret which of those is more likely to happen.
Once traders have identified a trend in either direction, they can use contracts for difference (CFDs) to take a position on the price direction of the underlying asset.
A CFD is a financial contract, typically between a broker and a trader, where one party agrees to pay the other the difference in the value of a security, between the opening and closing of the trade. You can either hold a long position, speculating that the price will rise, or a short position, speculating that the price will fall.
CFDs are leveraged instruments that allow you to open a larger position with a small initial investment. However, they also multiply losses if the share price moves against your position.
Limitations of the Heikin-Ashi candlestick technique
The Heikin-Ashi technique is recognised as a highly reliable analytical tool, but it does have its limitations. By averaging values, the candles do not show exact opening and closing prices for an asset, and by incorporating historical prices, they introduce a time lag into the trend line. While the smoother distribution of candlesticks can make it easier to identify trends, it fills in price gaps that traders often use to identify price momentum, entry points and stop-loss* levels for buying and selling.
These factors can put day traders or scalpers at a disadvantage, particularly in fast-moving markets like forex, by giving signals that have already become obsolete. That shows the importance of analysing Heikin-Ashi charts in combination with other technical indicators to identify accurate entry and exit points.
Having used Heikin-Ashi candlesticks to identify the direction of the market, traders can also employ trend indicators in their trading strategies, such as moving averages and the relative strength index (RSI), to gauge the strength of the momentum behind the price movement.
*Stop-losses may not be guaranteed.
FAQs
How do you use Heikin-Ashi candles?
Heikin-Ashi candlestick patterns are a type of charting technique used to identify trends in financial markets. They are similar to standard candlesticks, but the calculation of the open, high, low, and close are different.
To use Heikin-Ashi candles, first set up the chart with the desired time frame and instrument. Then, look for patterns in the candles to identify trends. A Heikin-Ashi trading strategy can be used to identify trends in any type of financial market, including stocks, forex, commodities, and more. It can also be used to identify entry and exit points in a trade.
How are Heikin-Ashi candles calculated?
Heikin-Ashi candles are calculated by taking the average of the open, high, low, and close of the previous period.
The open of the Heikin-Ashi candle is the average of the open and close of the previous period. The close is the average of the open, high, low, and close of the current period.
The high of the candle is the maximum of the high, open, or close of the current period. The low is the minimum of the low, open, or close of the current period.
Are candlestick charts trading profitable?
Candlestick charts provide traders with potentially valuable information about price movements and the underlying psychology of the market. This information could potentially help traders make more informed trading decisions.