

Oil and natural gas diverge as geopolitical risks ease and winter demand increases
Oil and natural gas diverge as softening risk premium and demand for winter-heating dominate the narrative.
Energy markets are experiencing a significant divergence, with Brent crude extending its sharp decline below $90 per barrel while natural gas pushes towards $3.50. Although both commodities are influenced by geopolitical developments and global supply conditions, their recent performance highlights the different forces driving prices. Oil is losing much of the geopolitical risk premium accumulated during the Middle East conflict, while natural gas is finding support from seasonal demand expectations and the prospect of tighter winter supply conditions. The contrasting moves also have important implications for inflation, particularly as central banks assess whether energy-related price pressures are beginning to ease.
Brent crude: Geopolitical optimism triggers a sharp repricing
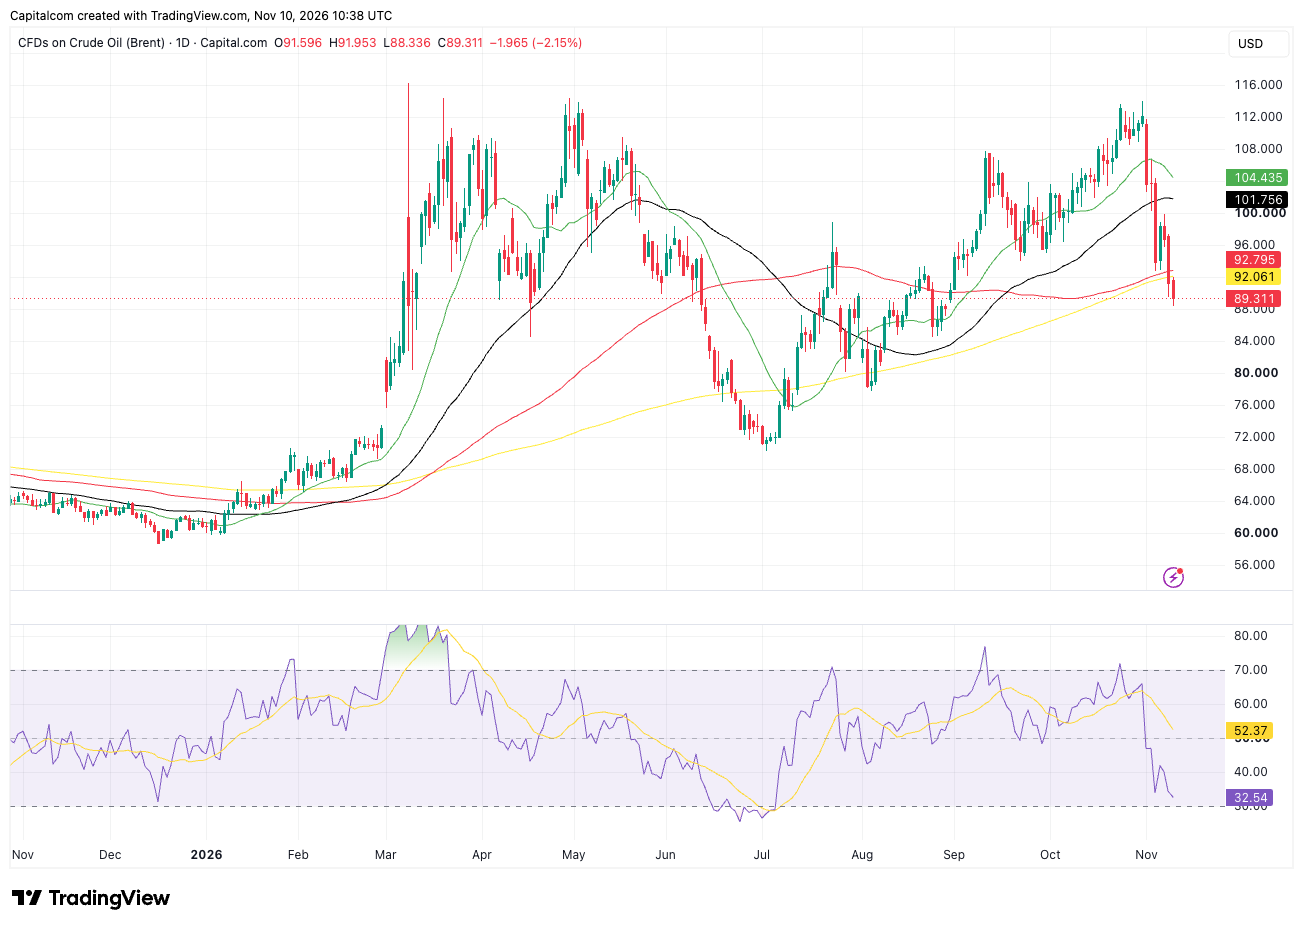
Brent has fallen towards $89, extending its decline from October highs above $110 as hopes of diplomatic progress between the US and Iran reduce concerns about prolonged supply disruptions. The possibility of a less confrontational relationship has encouraged traders to unwind positions built around geopolitical supply risks, with the speed of the decline suggesting a significant shift in sentiment. However, negotiations remain uncertain, and any renewed threats to shipping routes or energy infrastructure could quickly restore some of the risk premium.
The broader supply-demand outlook is also important. With prices retreating, investors are likely to refocus on OPEC+ production policy, global inventories and the resilience of demand from China and other major consuming economies. A sustained improvement in Middle East supply conditions could expose the market to additional downside if production remains elevated or consumption disappoints. Conversely, any evidence of tighter physical supply could help stabilise prices after the recent selloff.
Technically, Brent has broken below the important $92–93 support region, where its longer-term moving averages converge, reinforcing the bearish outlook. The next area to watch is $88–89, followed by $84–85 if selling continues. The RSI near 32 suggests bearish momentum is becoming stretched, increasing the possibility of a short-term rebound. However, any recovery would initially face resistance around $92–93, followed by $100–102. A sustained move back above these levels would be needed to improve the technical outlook.
Brent Crude daily chart
Past performance is not a reliable indicator of future results.
Natural gas: Winter demand and LNG exports support prices
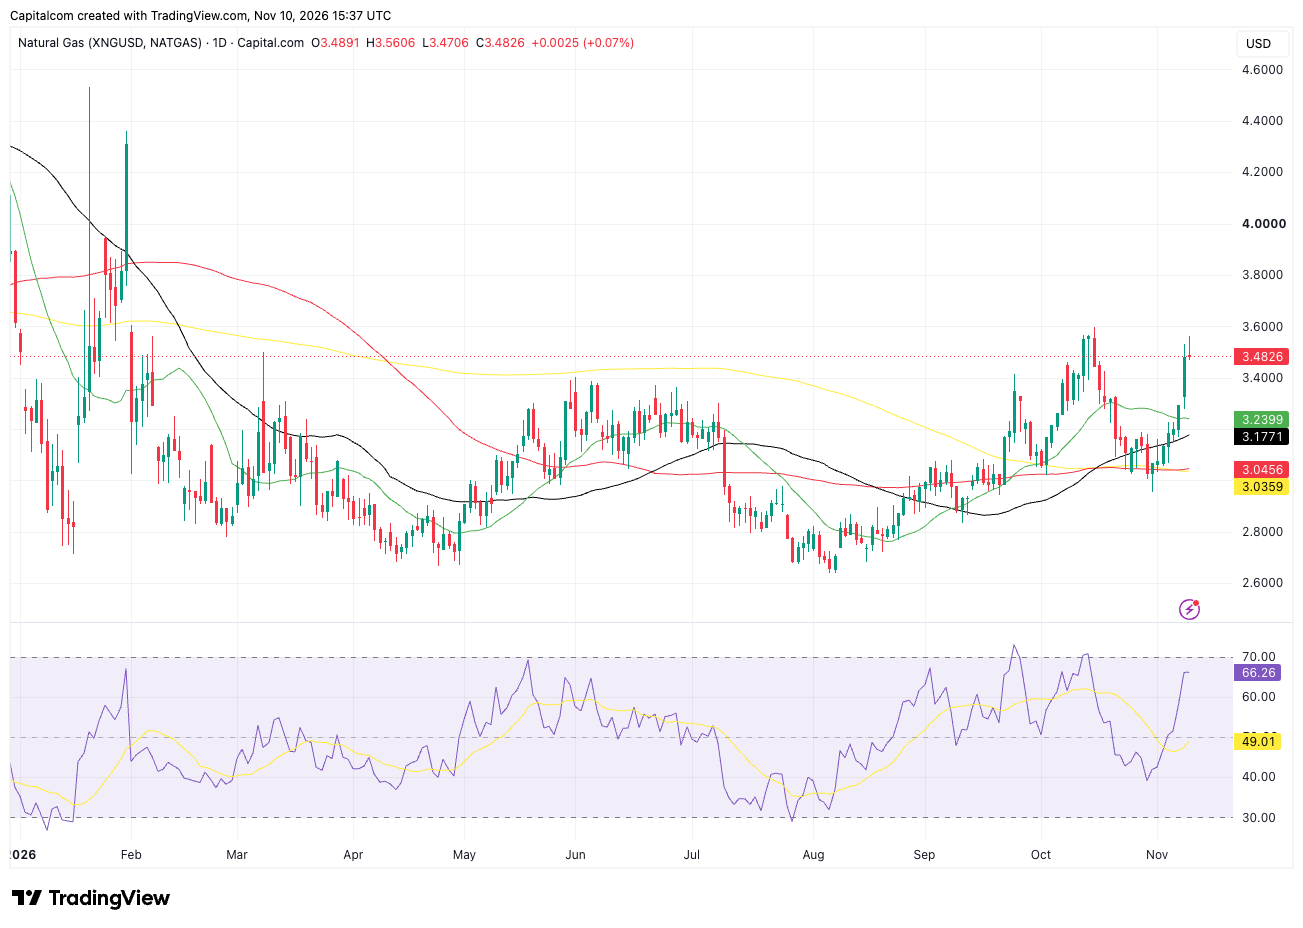
Natural gas is moving in the opposite direction to oil, with prices climbing towards $3.50, approaching their October highs. The recovery reflects growing expectations of stronger heating demand as temperatures begin to fall across parts of the US. Colder weather forecasts for the central and eastern states have encouraged buying, while robust LNG export demand and slightly lower domestic production are providing additional support. Recent reports indicate that flows to US LNG export facilities have reached around 19.3 billion cubic feet per day, highlighting the importance of international demand.
However, the outlook remains highly dependent on weather conditions. A colder-than-expected winter could accelerate withdrawals from storage and support further price increases, particularly if LNG exports remain elevated. US inventories remain slightly above their five-year average, suggesting there is still a reasonable supply buffer. This limits the immediate risk of a sustained shortage, even if seasonal demand increases.
Technically, natural gas has regained its major moving averages, reinforcing the improving bullish momentum. The immediate resistance area sits around $3.55–3.60, where previous rallies have struggled to maintain momentum. A sustained break above this region could expose $3.80, followed by the psychological $4.00 level. On the downside, initial support sits around $3.25, followed by $3.18 and the more significant $3.03–3.05 region. The RSI near 67 suggests buyers remain in control, although the market is approaching overbought territory, raising the possibility of short-term consolidation.
Natural Gas daily chart
Past performance is not a reliable indicator of future results.