Navigating Nvidia's VWAP Dynamics: A Trader's Guide
Having surged higher during the first quarter of the year, Nvidia’s share price is currently in ‘mean reversion mode’.
Having surged higher during the first quarter of the year, Nvidia’s share price is currently in ‘mean reversion mode’.
When it comes to measuring mean reversion, we can use traditional simple or exponential moving averages. We can see from Nvidia’s daily candle chart (below) that price has not yet reached the 50-day moving average which continues to slope upwards despite the recent sideways consolidation.
However, a perhaps more insightful measure of mean reversion is to use volume weighted average price (VWAP) anchored to key inflection points. If we anchor a VWAP to the recent trend highs and anchor another VWAP to the lows of the last trend leg (21st Feb lows), a compelling picture emerges: Nvidia's share price is effectively 'funnelled' between these two VWAPs.
This compression of price is also reflected in the swing highs and lows of the consolidation phase, forming a wedge pattern or flag formation.
NVDA Daily Candle Chart
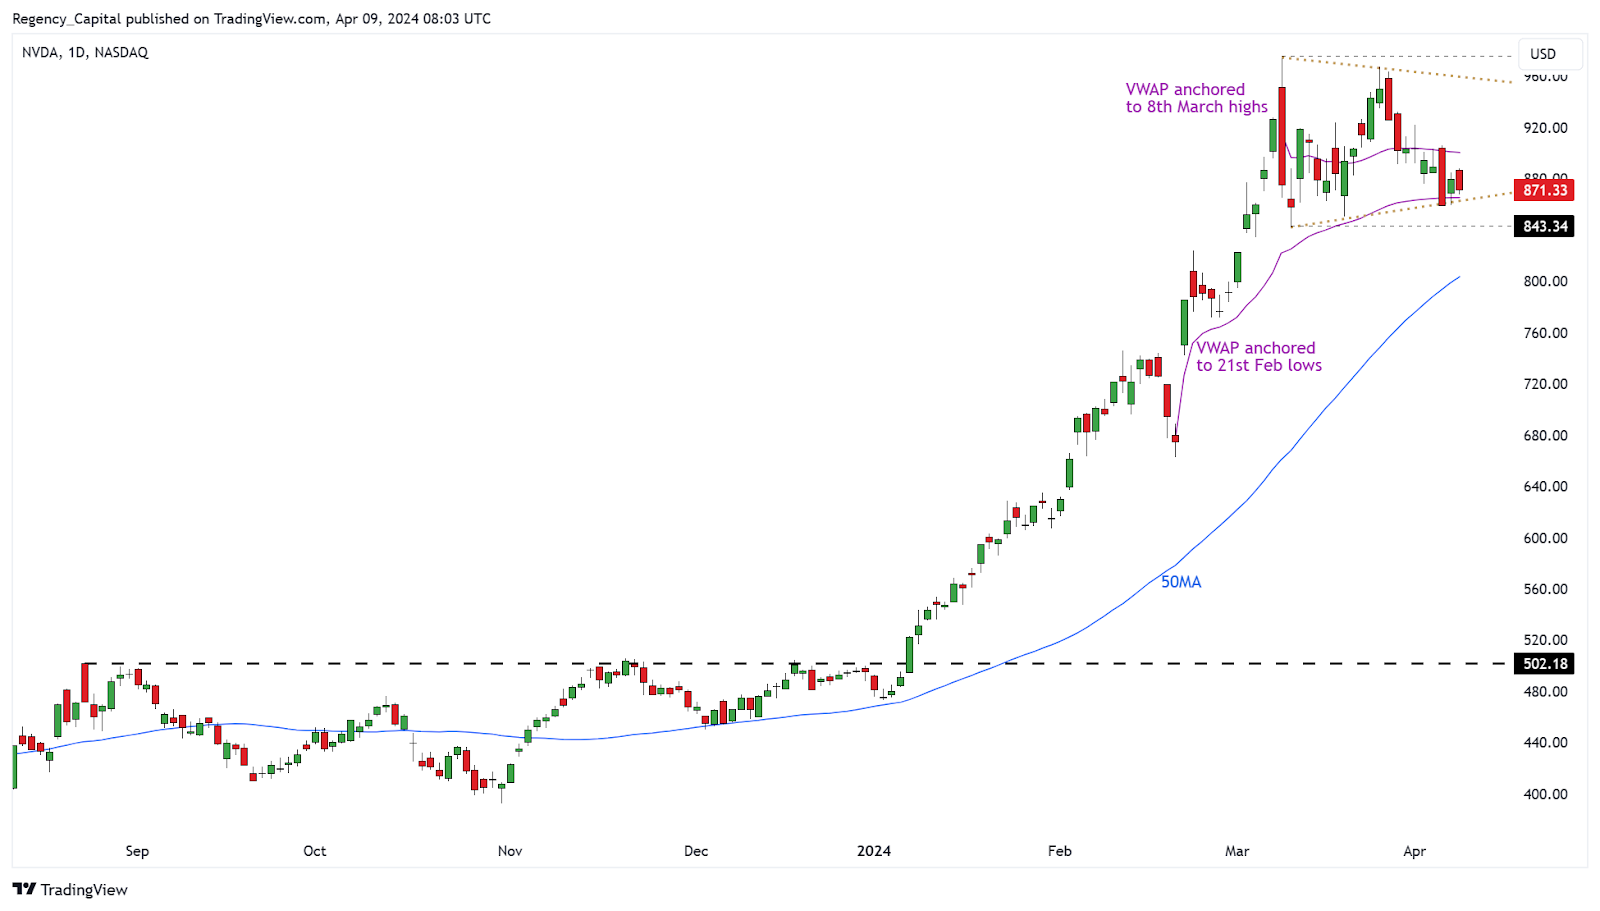
(Past performance is not a reliable indicator of future results)
Trading Strategies:
In navigating Nvidia's VWAP dynamics, traders have several short-term strategies at their disposal:
- Buying Breakout: A breakout and subsequent close above the VWAP funnel, accompanied by robust volume, could signify the continuation of Nvidia's upward trend.
- Buying Support: Given Nvidia's established long-term uptrend, buying at support levels presents attractive risk/reward opportunities. Look for reversal candle patterns like bullish hammer or engulfing candles as triggers for buying support.
- Shorting Breakdown: Conversely, a breakdown and close below the VWAP funnel might indicate the onset of a deeper retracement toward the 50-day moving average.
Risk Management:
Traders can employ Nvidia's Average True Range (ATR), currently at $35, as a baseline expectation for daily price movement. This should inform decisions regarding stop placement and price targets.
Nvidia is scheduled to release its Q1 2025 earnings on Wednesday, May 22nd, 2024.