Market analysis: Oil and Natural Gas update
Oil and Natural Gas prices storm higher but face resistance up ahead
Oil charges higher despite a stronger dollar, faces resistance ahead
Oil prices have regained the bullish momentum once again. US crude (WTI) is up over 4% in the week after bouncing from the lows of 72.60. The reversal started on Wednesday last week gaining strength on Thursday before encountering resistance on Friday after the US jobs data sent the dollar soaring. But, as the downside pressure from the dollar continues, US crude has managed to regain the upper hand, with Monday seeing its best daily performance since November, up 3.7%.
Traders seem to have shaken off the negative feelings from OPEC’s announcement to start phasing out production cuts later in the year. The focus now seems to be on an improved demand outlook, reinforced by the bigger-than-expected drawdown in US crude inventories published on Tuesday. Moreover, the Energy Information Administration (EIA) raised its 2024 world oil demand growth forecast to 1.10 million barrels per day from a previous estimate of 900,000 bpd, while the Organization of the Petroleum Exporting Countries (OPEC) maintained its 2024 forecast for relatively strong growth in global oil demand, citing expectations for travel and tourism in the second half. Inventory data from the EIA will be published on Wednesday afternoon.
Traders will also be paying close attention to the US Consumer Price Index (CPI) published hours before the Federal Reserve meeting on Wednesday. A dovish outlook from the Fed could support the oil rally further, but with the stronger-than-expected wage data last week, we could see Jerome Powell continue to push back on the possibility of rate cuts, which could weigh on oil prices.
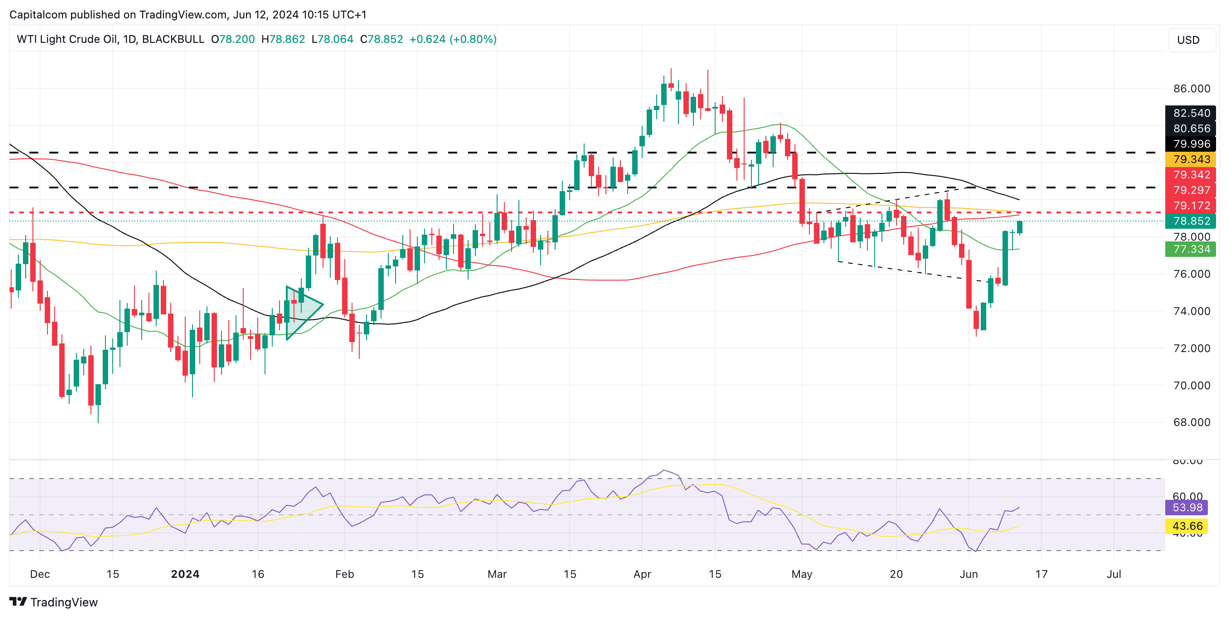
The first area of resistance for buyers will be the $79.30 horizontal line, to which both the 200-day SMA and 100-day SMA are converging. Beyond that, the 50-day SMA – currently at $80.00 - could offer some resistance before heading towards the key range of support/resistance between $80.65 and $82.54.
US Crude (WTI) daily chart
(Past performance is not a reliable indicator of future results.)
Natural Gas bullishness starts to fizzle out
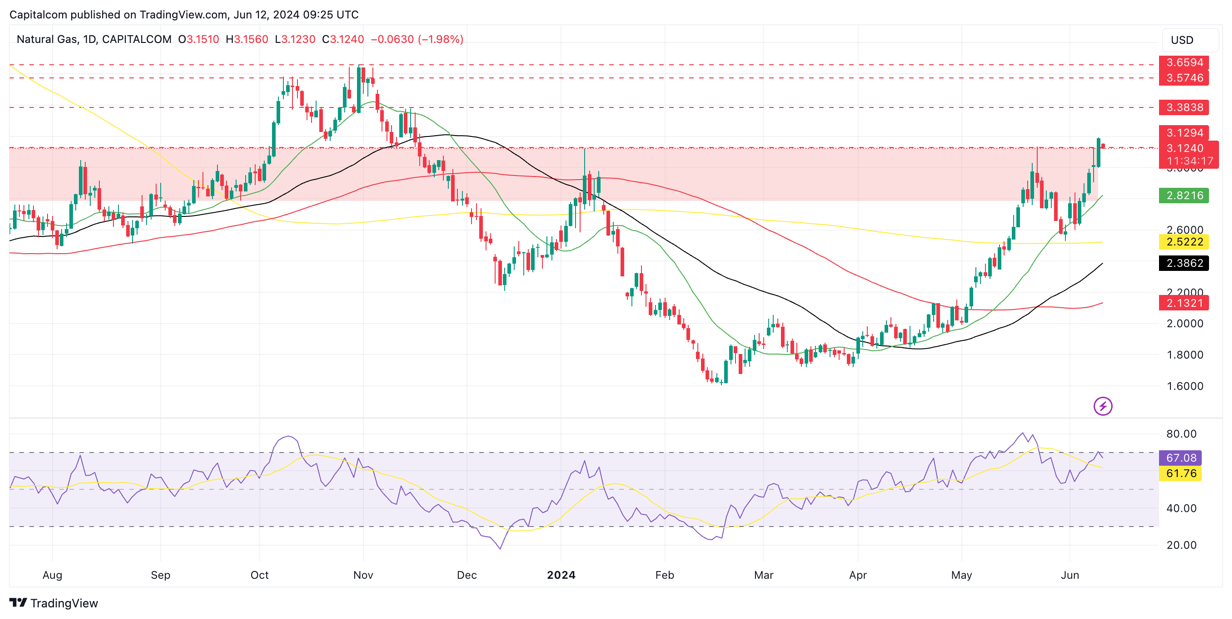
Natural gas prices have broken above resistance at 3.1260 for the first time since November. The commodity has found continued support after bouncing off the 200-day SMA ($2.5280) on May 31. But the bullish appetite has started to fizzle out as the RSI has reached overbought levels. After Tuesday’s 5.7% gain, natural gas has started Wednesday’s session with a bearish bias.
There is plenty of resistance up ahead, which will make it tough for buyers to continue having the upper hand. There is likely to be some profit-taking after the recent appreciation, so this will be a good test of bullish appetite, and how further the upside can go.
Natural Gas daily chart
 (Past performance is not a reliable indicator of future results.)