Market analysis: Gold reaches all-time high as Fed cut hopes increase
Gold continues to build bullish momentum as softer US data leads markets to expect a September rate cut from the Fed.
The drop in yields and the US dollar has been keeping gold supported. The precious metal reached a new all-time high on Tuesday at $2,470 as the dollar faces continued downside pressure. The momentum has attempted to continue building on the upside on Wednesday but the move has encountered some resistance around $2,480.
The softer CPI data on Thursday last week was a key driver of the rally in gold as markets have started to price in a higher chance of a rate cut from the Federal Reserve in September. Current pricing shows a 98% chance of a 25 basis point cut. This has been a long time coming, with market predictions just six months ago suggesting we could have seen up to three rate cuts by this time in the year. The realisation that rates would be higher for longer saw the bullish appetite for gold diminish throughout the second quarter, accompanied by a de-escalation in geopolitical tensions in the Middle East.
But now that rate cuts are back on the table the appetite for gold has re-emerged. The fact it is a non-yielding asset means the opportunity cost of holding gold will drop as rates are lowered. This, alongside softening economic growth in the immediate future, is expected to drive gold higher in the coming months.
That said, whilst Fed Chairman Jerome Powell has shown a favourable inclination towards cutting rates, there is still a chance that the central bank continues to view upside pressures to inflation, which could limit the possibility of a rate cut. The meeting at the end of July is likely the best place to gather more information on the likelihood of a September cut. For now, the downside in gold looks limited, but any reluctance to cut rates shown by FOMC members in the coming days could dampen the bullish sentiment.
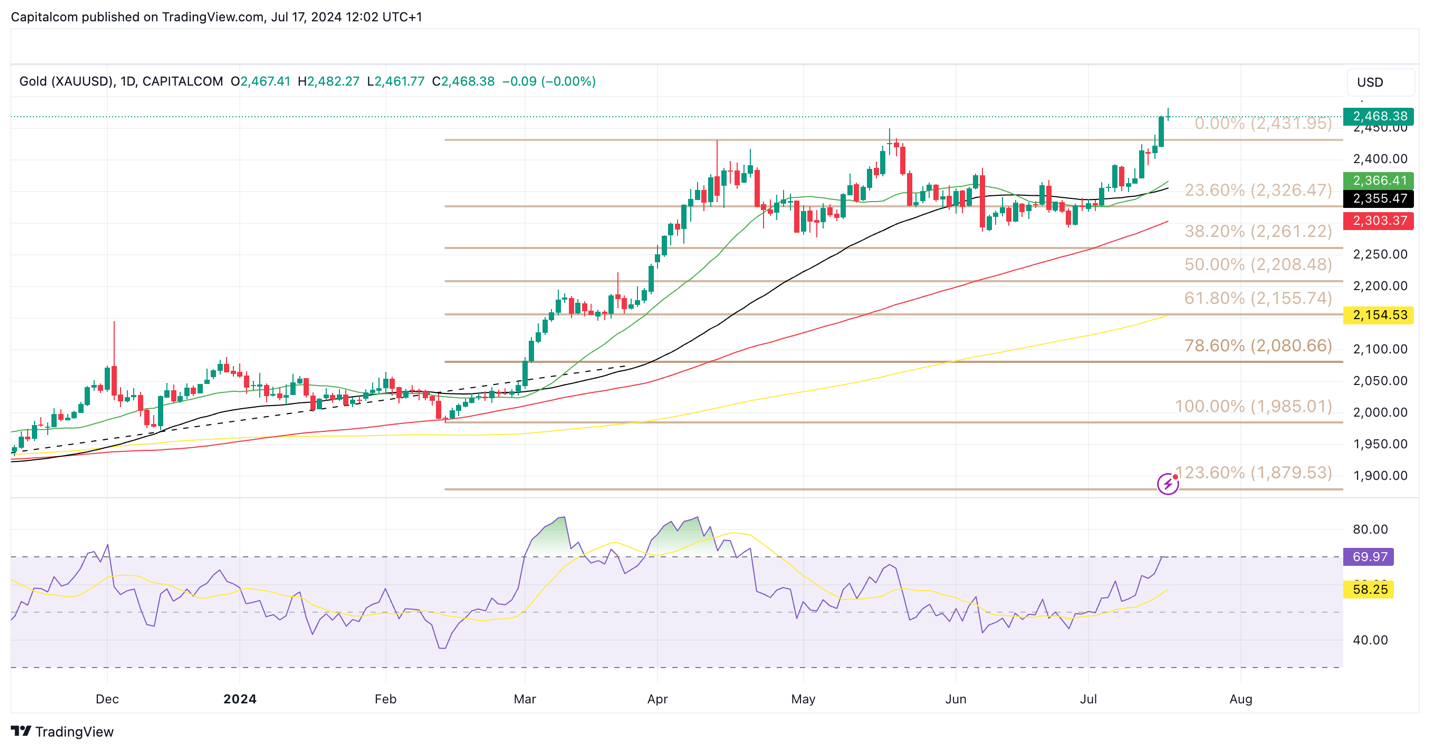
From a technical perspective, the bias in XAU/USD remains firmly on the upside. The RSI has started to break above the overbought line but evidence from the past few months suggests the indicator still has further room to go before a reversal is necessarily triggered. Today’s candlestick, as last Friday’s, shows there is interest from sellers to test the appetite to move lower but the support is limited, suggesting a continuation of the bullish rally. That said, the fact that XAU/USD to broken to a new all-time high may lead to some uncertainty as to much further the momentum can go, so a technical correction is not fully off the cards.
XAU/USD daily chart
Past performance is not a reliable indicator of future results.