What is a double top pattern in trading?

What is a double top pattern?
A double top pattern is a bearish reversal pattern in technical analysis that signals a potential shift from an uptrend to a downtrend. It features two peaks at roughly the same price level, separated by a pullback that forms a support area known as the neckline.
The first peak forms after a strong upward move, followed by a dip to the neckline. A second rally then fails to break above the first peak, suggesting fading bullish momentum and rising selling pressure near resistance.
The pattern is confirmed when the price breaks below the neckline, indicating a potential bearish reversal. This may lead traders to open short positions or close long ones—though, like all patterns, it can produce false signals.
How to identify a double top trading pattern
To recognise a double top pattern, carefully observe its price movements and follow a structured approach. Here’s a guide:
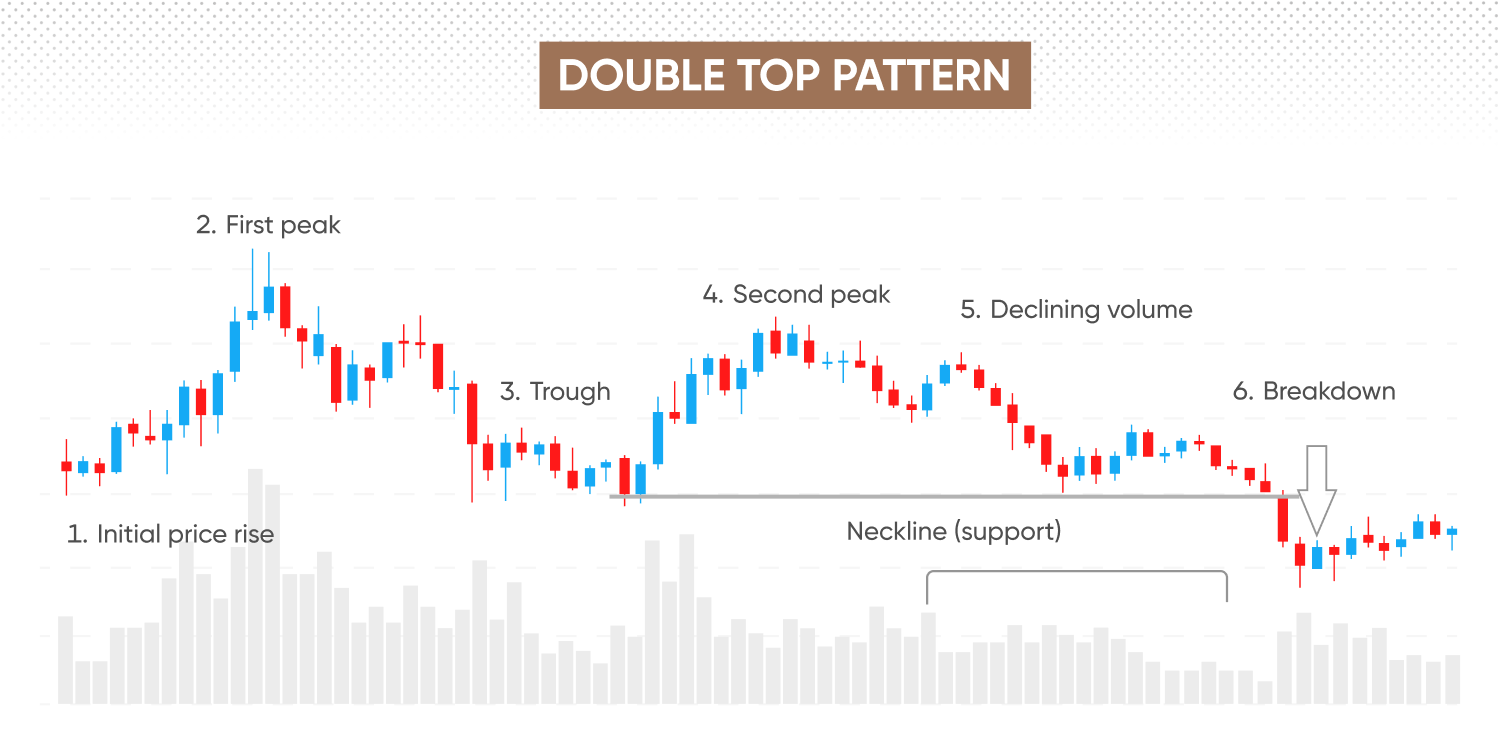
1. Established uptrend – start by confirming that the asset has experienced a clear upward trend, characterised by consistently rising highs and higher lows. The double top chart pattern is most meaningful after a bullish phase, as it suggests a potential shift in momentum from buyers to sellers.
2. First peak formation – observe the initial peak where the asset reaches a notable high price, followed by a retracement. This marks a temporary resistance, which may be confirmed if the price later fails to break above it.
3. Trough and neckline establishment – following the first peak, watch for a moderate pullback. Mark the lowest point of this decline, as this forms the trough. Draw a horizontal line across this low to create the neckline, a critical support level for confirming the pattern.
4. Second peak formation – the price should rally again, aiming to retest the first peak’s level. The second peak typically occurs near the same price level as the first, with minor height differences being common. It is important that the second peak does not significantly exceed the previous high, indicating continued resistance.
5. Volume consideration – assess the trading volume. The second peak often forms on lower or diminishing volume compared to the first, which may indicate reduced bullish momentum and lend further weight to the double top formation. However, this is not always observed.
6. Confirming the breakdown – the pattern is only confirmed once the price breaks below the neckline. A breakdown accompanied by increased volume could provide stronger evidence of a potential bearish reversal, although it is not essential.
Learn about more formations in our 12 chart patterns for traders guide.
How to trade the double top pattern
By following these steps, you can learn how to trade the double top pattern:
- 1. Confirm the breakdownEnsure the price decisively breaks below the neckline (support). A clear breakdown may be accompanied by increased trading volume, which can help confirm growing bearish sentiment.
- 2. Entry strategyTraders might enter a short position immediately following the neckline breakdown or after a potential retest. A retest occurs when the price briefly revisits the neckline after the initial break. Waiting for a retest can provide additional confirmation, potentially reducing false signals.
- 3. Set stop-loss levelsPlace a stop-loss slightly above the most recent peak – the second top. This helps limit risk if the pattern fails and prices reverse upwards. Consider market volatility to avoid premature stop-outs.
- 4. Determine profit targetsEstimate potential profit targets by measuring the vertical distance between the peaks and the neckline, then projecting this distance downwards from the break point. Alternatively, consider identifying key support levels below the neckline that could act as logical exit points.
- 5. Enhance reliability with indicatorsTo validate the pattern’s reliability, consider using additional indicators such as the relative strength index (RSI) or moving average convergence divergence (MACD). Bearish divergences – where these indicators form lower highs while the price forms similar peaks – can strengthen the validation.
- 6. Manage risk and position sizingPosition sizing should reflect your overall risk tolerance and account size, ensuring no single trade disproportionately affects your capital. Regularly adjusting stop-losses as the price moves in your favour (trailing stops) can also help protect profits, although stop-losses are not guaranteed. Guaranteed stop-losses incur fees.
Past performance is not a reliable indicator of future results.
Double top pattern meaning in technical analysis
The double top signals a potential reversal from bullish to bearish market sentiment. In technical analysis, the pattern highlights a scenario where upward momentum may be diminishing, indicating that buyers could struggle to drive the price further upward.
When prices reach the first peak, traders may interpret this area as resistance. After a pullback, the second peak reinforces this resistance, suggesting a weakening of bullish strength. Technically, this formation suggests a shift in sentiment – from confidence in continued gains to growing caution and profit-taking by traders.
A confirmed double top pattern – marked by a decisive price break below the neckline – can signal that selling pressure is increasing relative to buying pressure, setting the stage for a potential downtrend.
Common mistakes when reading this pattern
Even experienced traders can misinterpret the double top pattern, which could result in potential losses. Here are some common mistakes:
Misidentifying the peaks
Traders often mistake any two similar highs for a double top without confirming key criteria. A valid pattern typically forms after a clear uptrend and features two distinct peaks near the same level, separated by a meaningful pullback that creates a well-defined neckline. Without both a prior trend and a clear neckline, the pattern loses reliability.
Acting before confirmation
One of the most frequent errors is acting too soon – shorting the market after the second peak without waiting for a confirmed breakdown. Until the price closes below the neckline (ideally on strong volume), the pattern remains unconfirmed and may fail. Premature entries increase the risk of false signals and unnecessary losses.
Neglecting volume analysis
Volume analysis can add conviction to pattern recognition. A second peak forming on lower volume may suggest weakening buying interest, while a break below the neckline with rising volume can strengthen the bearish signal. However, in markets like spot FX or contracts for difference (CFDs), where volume data may be unavailable or unreliable, this factor is less relevant. Still, overlooking volume where it matters can lead to weaker setups.
Learn how to protect yourself against potential risks.
Double bottom chart pattern
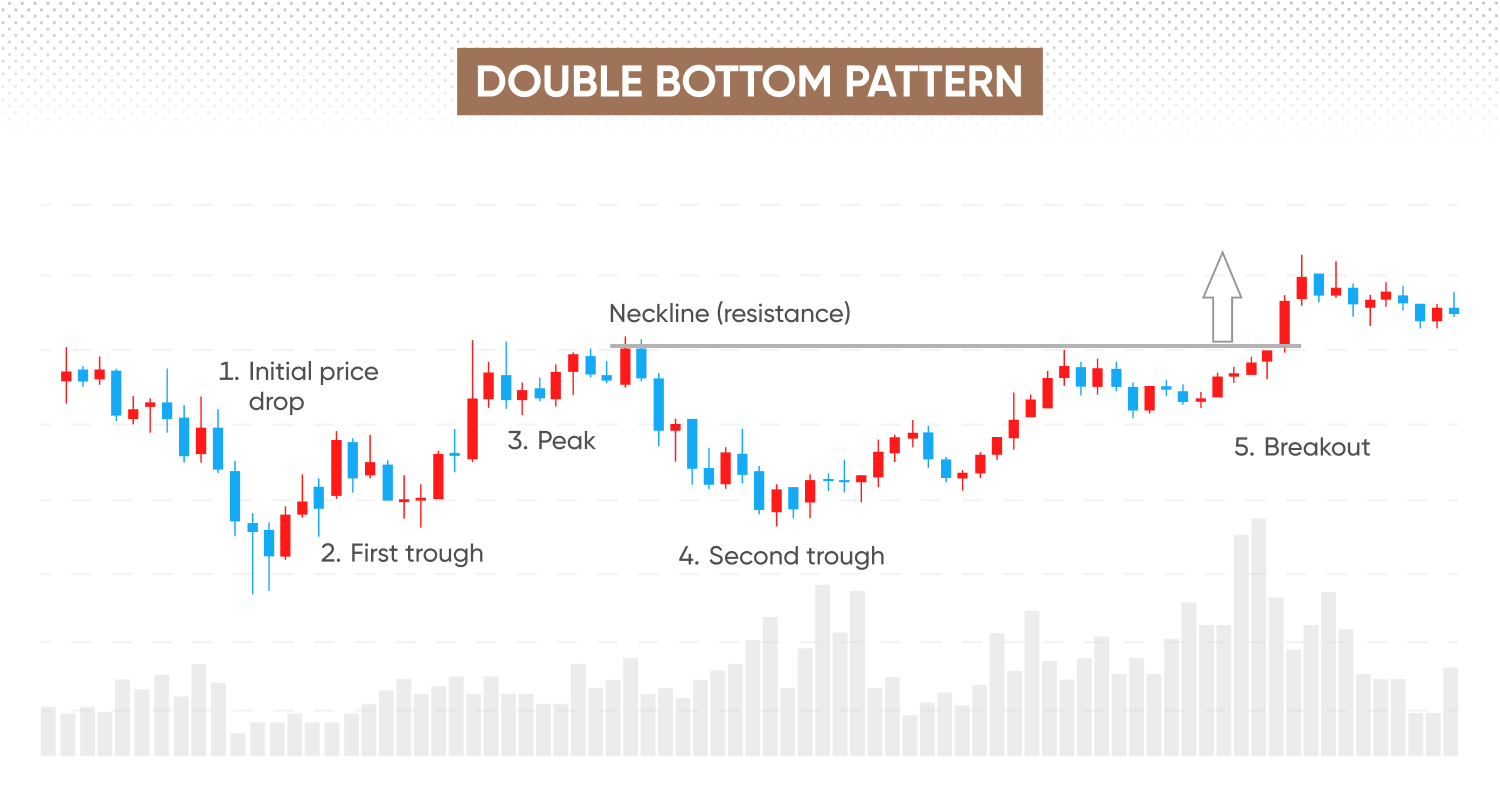
A double bottom is a bullish reversal pattern in technical analysis, regarded as the counterpart to a double top. This pattern emerges during a downtrend, indicating a potential shift from bearish to bullish sentiment.
The double bottom formation consists of two distinct lows at a similar price level, separated by a moderate upward retracement that tests the resistance, known as the neckline.
-
Initially, the price declines substantially, establishing the first low point.
-
Buying activity lifts the price towards the neckline, marking a temporary resistance.
-
Selling pressure resumes, and the price descends.
-
Ideally, this second low should be at a similar level as the first, signalling strong support and a possible loss of bearish momentum.
-
Confirmation occurs when the price breaks above the neckline (resistance).
For more approaches, visit our CFD trading strategies page.
FAQs
What is the double top pattern?
The double top pattern is a bearish reversal formation observed in technical analysis. It consists of two clear peaks at a similar price level, separated by a decline that forms the neckline. Traders interpret it as an indicator of weakening bullish momentum, suggesting a potential shift towards a bearish trend.
How do I spot a double top in real-time charts?
To spot a double top in real-time, look for two distinct peaks at roughly the same price level, clearly separated by a retracement creating a neckline. Pay close attention to the neckline break for confirmation. In some cases, the second peak may form on lower volume, which some traders consider may strengthen the pattern’s reliability.
Is the double top bullish or bearish?
The double top is primarily bearish. It signals that bullish momentum is waning and market sentiment may be shifting from positive to negative. Traders may use this pattern to identify short opportunities or to exit long trades.
Can a double top fail?
Yes, a double top can fail, especially if traders prematurely anticipate a breakdown without clear confirmation. If the neckline is not decisively breached, the price might rebound, invalidating the bearish setup. Waiting for a confirmed neckline break, ideally supported by volume, can help reduce false signals.
How reliable is this pattern in volatile markets?
The reliability of the double top pattern may be reduced in highly volatile markets. While the pattern can still offer valuable signals, volatility increases the likelihood of false breakdowns. Validating signals with supplementary indicators, such as RSI or MACD, may enhance accuracy in these conditions.