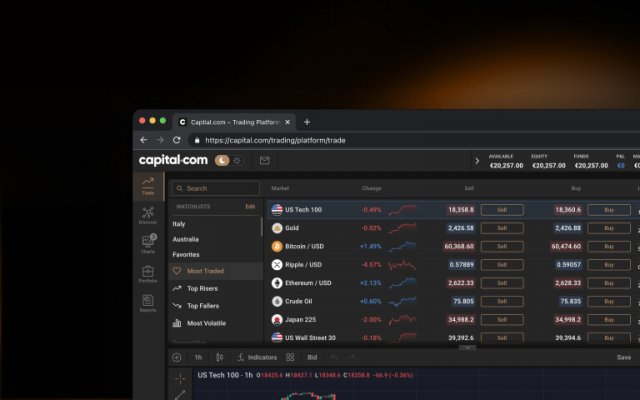
Kies voor een betrouwbare broker
Beste handelaren, wij beseffen dat veiligheid van het grootste belang is. Sluit u aan bij een broker met een verhandeld volume van meer dan $1 biljoen. Uw geld wordt veilig afgeschermd bij de allerbeste banken.
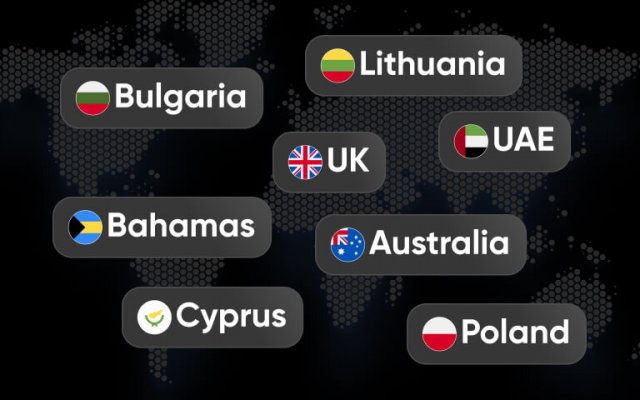
Erkend en onder toezicht van de Cyprus Securities and Exchange Commission (CySEC)