What is the Ichimoku Cloud and how does it work?
Learn about Ichimoku Cloud and how it works in trading, with guides, examples and strategies to help boost your skills.
What is the Ichimoku Cloud?
Ichimoku Cloud is a technical analysis tool used to analyse historical market data for patterns and trends, often with the aim of anticipating future price movements.*
Published in 1969, the Ichimoku Cloud consists of five technical indicators which, when plotted on a chart together, resemble a ‘cloud’-like shape. Combined, these indicators represent an asset’s support and resistance levels, momentum and trend direction.
‘Ichimoku’ is Japanese for ‘one-look’ which is apt, as the Ichimoku Cloud provides a detailed overview of market performance in a quick glance. Like most technical indicators, the Ichimoku Cloud can be applied across a range of markets, including shares, commodities, indices, forex and CFD trading.
*Past performance does not guarantee future results.
How does the Ichimoku Cloud work, and how do I draw one?
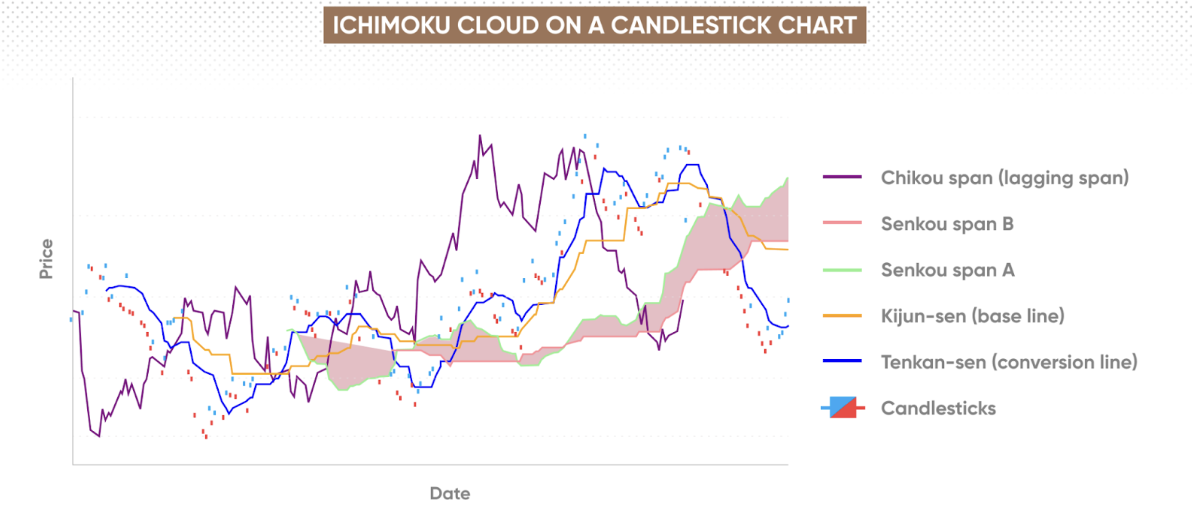
The Ichimoku Cloud works by drawing five technical indicators on a chart, called: tenkan-sen, kijun-sen, senkou span A, senkou span B and chikou span. Separately, they appear as lines. Together, they form the Ichimoku Cloud.
Tenkan-sen
Tenkan-sen, or ‘conversion line’, is calculated by averaging the 9-period high and the 9-period low. It indicates key support and resistance level changes, and can signal potential price reversals.
Kijun-sen
Kijun-sen, or ‘base line’, is calculated by averaging the 26-period high and the 26-period low. It’s another key support and resistance level indicator, suitable for confirming whether a trend is likely to continue or reverse.
Senkou span A and B
Senkou span A, or ‘leading line A’, is calculated by averaging the tenkan-sen and the kijun-sen, then plotting the results 26 periods ahead. Senkou span B is calculated by averaging the 52-period high and the 52-period low, then plotting the results 26 periods ahead. Together, they form the ‘Cloud’, which indicates potential future areas of resistance and support.
Senkou span B* = (52-period high + 52-period low) / 2
*Plot results 26 periods ahead.
Chikou span
Chikou span, or ‘lagging span’ doesn’t require calculations. To draw it, take the current closing price and plot it 26 days back on the chart. It represents potential resistance and support levels, and helps identify potential trend direction.
How do I interpret the Ichimoku Cloud?
Ichimoku Cloud is intended to be relatively easy to interpret and understand. The key is learning what each of its visual components represents, and how to read them.
Price action
When the price is above the cloud, it indicates a bullish trend. This suggests that the asset's price may continue to rise, and traders might look for opportunities to enter long positions. Conversely, when the price is below the cloud, it signals a bearish trend, indicating that the price may continue to fall, and traders might consider short positions. If the price is within the cloud, it suggests a sideways or consolidating market, where the trend is uncertain.
Senkou span A + B = Cloud
Formed by senkou span A and senkou span B, the cloud represents potential future support and resistance levels. A thicker cloud implies stronger support or resistance, which might make it harder for the price to break through.
The colour of the cloud can also provide insights. When senkou span A is above senkou span B, the cloud is typically coloured green, indicating upwards momentum. When senkou span A is below senkou span B, the cloud is usually coloured red, signalling bearish momentum.
Tenkan-sen and kijun-sen
A bullish signal occurs when the tenkan-sen crosses above the kijun-sen, especially if this crossover happens above the cloud. This suggests increasing upward momentum and potential for price appreciation. A bearish signal is generated when the tenkan-sen crosses below the kijun-sen, particularly if this occurs below the cloud, indicating downward momentum and potential for price decline.
Chikou span
Chikou span helps confirm the trend. When the chikou span is above the price line from 26 periods ago, it supports a bullish prediction, reinforcing the signals from other components. If it's below, it indicates a bearish outlook. Traders can examine where the chikou span lies in relation to past prices to determine the strength of the current trend.
How to trade the Ichimoku Cloud?
Trading the Ichimoku Cloud involves using its signals to identify potential entry and exit points. Here's how you can incorporate it into your trading strategy.
Determine the overall trend
Look at the price's position relative to the cloud. If the price is above the cloud, traders could consider opening a long position, as this suggests a bullish trend. If it's below the cloud, they might open a short position, as this indicates a bearish trend.
Monitor for crossovers
A bullish crossover is where the tenkan-sen crosses above the kijun-sen to signal increasing upward momentum, especially if it occurs above the cloud. Traders might consider opening a long position.
A bearish crossover is where the tenkan-sen crosses below the kijun-sen to indicate downward momentum, particularly if it happens below the cloud. Traders might consider opening a short position.
Confirm the signal
Use the chikou span to confirm your trading signals. If the chikou span is above the price from 26 periods ago, it might indicate a bullish trade. If it's below, it could support a short position. This helps validate the signals from the tenkan-sen and kijun-sen crossovers.
Support and resistance
Be mindful of the cloud's thickness; a thicker cloud may represent stronger support or resistance, affecting the price's ability to move through it. The cloud can act as a dynamic support in an uptrend and resistance in a downtrend.
Risk management
Traders might consider using risk management tools such as stop-loss and take-profit orders, to limit potential losses and protect potential gains.
Use stop-loss orders to protect against adverse market movements, and consider setting take-profit levels to secure gains. Combine the Ichimoku Cloud with other forms of analysis, such as support and resistance levels, candlestick patterns and fundamental analysis, to increase the reliability of your trades.
What are some Ichimoku Cloud strategy examples?
Forex example – GBP/USD has just broken above the cloud, indicating a bullish trend. The tenkan-sen crosses above the kijun-sen and the chikou span is above the price from 26 periods ago. These signals combined suggest a potential opportunity to enter a long position. Traders might choose to set a stop-loss below the cloud or recent swing low to manage risk*.
*Stop–loss is not guaranteed.
FAQs
Is Ichimoku Cloud a trading strategy or technical analysis indicator?
The Ichimoku Cloud is primarily a technical analysis indicator. While it is a powerful tool that can inform trading decisions, it is not a trading strategy on its own. Ichimoku Cloud can offer a comprehensive view of market trends, momentum, and potential support and resistance levels by combining multiple indicators into one chart. Traders often incorporate it into their broader trading strategies to enhance market analysis.
Can you use Ichimoku Cloud for swing trading?
Yes, you can use the Ichimoku Cloud as part of a swing trading strategy. Its ability to highlight medium-term trends and potential reversal points makes it suitable for swing traders aiming to capitalise on price movements over several days to weeks. By identifying trend direction and momentum, the Ichimoku Cloud could help swing traders make informed decisions.
How do I interpret the Ichimoku Cloud?
Interpret the Ichimoku Cloud by analysing the asset price position relative to the cloud, the interactions between the tenkan-sen and kijun-sen lines, and the position of the chikou span. When the price is above the cloud, it suggests a bullish trend; below the cloud indicates a bearish trend. Crossovers between the tenkan-sen and kijun-sen lines can signal potential trading opportunities, and the chikou span provides confirmation of the trend.
Ready to start trading with the Ichimoku Cloud?