

UK 100 forecast: Bond yields, oil concerns
UK 100 is a CFD market based on the FTSE 100. UK bond yields have risen ahead of August inflation data and the Bank of England's September rate decision. Explore third-party UK100 price targets and technical analysis. Past performance is not a reliable indicator of future results.
The FTSE 100 index – referred to as the UK 100 (UK100) on CFD trading platforms such as Capital.com – trades near 10,628 at 9:40am UTC on 15 September 2026, within an intraday range of 10,597–10,739.8. Past performance is not a reliable indicator of future results.
Government bond yields have resumed their rise ahead of several central bank decisions (MarketScreener, 14 September 2026), while oil-linked inflation concerns remain in focus after Brent crude traded above $100 a barrel earlier this month amid Middle East supply disruptions (Reuters, 9 September 2026). Attention is also on Wednesday's UK inflation data and Thursday's Bank of England decision, with the benchmark rate widely expected to remain at 3.75% (FXStreet, 18 August 2026).
Banks and homebuilders fell 1.4% and 2.2%, respectively, on Monday, while pharmaceuticals and consumer staples gained (MarketScreener, 14 September 2026).
Third-party UK 100 outlook: oil, bond yields and BoE decision
As of 15 September 2026, third-party UK 100 predictions vary by timeframe and methodology, with UK earnings, commodity prices and bond yields among the main factors considered. The following estimates cover the FTSE 100, on which the UK 100 CFD is based.
UBS (updated mid-year revision)
UBS projects the FTSE 100 will reach 11,200 by December 2026 and 11,500 by June 2027, up from previous estimates of 11,000 and 11,300. Strategist Matthew Gilman cites a stronger UK earnings outlook, with the bank raising its 2026 earnings growth forecast to 16% from 11% after stronger first-half corporate profits (Yahoo Finance, 21 August 2026).
Goldman Sachs (12-month target)
Goldman Sachs projects the FTSE 100 will reach 11,400 over 12 months, implying approximately 5.2% upside from the level used at publication. The bank points to near-zero pairwise stock correlations and free cash flow yields of around 6% as factors it considers supportive (Finvaulta, 4 September 2026).
Long Forecast (monthly model projection)
Long Forecast projects the FTSE 100 will average 10,627 in September 2026, within a monthly range of 9,739–11,437, before closing at 10,507. That would represent a projected 1.3% decline from the prior close of 10,650.44. The forecast comes from an automated technical model rather than fundamental analysis (Long Forecast, 14 September 2026).
Pound Sterling Live (daily model projection)
Pound Sterling Live projects the FTSE 100 at 10,689, within a modelled daily range of 9,834–11,544, following a prior close of 10,650. Its model also projects a September month-end close of 10,507, 2.9% below the month's opening level of 10,824 (Pound Sterling Live, 14 September 2026).
Predictions and third-party forecasts are inherently uncertain, as they cannot fully account for unexpected market developments. Past performance is not a reliable indicator of future results.
UK100 index price: technical overview
As of 9:40am UTC on 15 September 2026, the UK100 index trades between its short- and longer-term moving averages. The 20-, 50-, 100- and 200-day simple moving averages (SMAs) sit near 10,769, 10,738, 10,567 and 10,393, respectively.
The index remains below the two shorter-term averages but above the 100- and 200-day SMAs, leaving no clear directional alignment, according to TradingView.
The 14-day relative strength index (RSI) is near 40, in lower-neutral territory, while the 14-day average directional index (ADX) stands around 18, below the 25 level commonly associated with a more established trend.
Above the current price, classic pivot resistance R1 sits near 10,961, followed by R2 at 11,098. Below it, the Hull moving average (9) near 10,611 and 100-day SMA around 10,567 provide nearby reference points, with the 200-day SMA near 10,393 further below.
The classic central pivot near 10,823 currently sits above the index, making it an overhead reference rather than immediate downside support (TradingView, 15 September 2026).
This is technical analysis for informational purposes only and does not constitute financial advice or a recommendation to buy or sell any instrument.
UK 100 index history (2024–2026)
The UK 100 index has moved through several distinct phases over the past two years. On 16 September 2024, the index closed at 8,309.4 and spent much of the fourth quarter in the low-to-mid 8,000s as investors weighed persistent inflation against expectations for Bank of England rate cuts.
Volatility increased sharply in April 2025, when US tariff announcements coincided with a broader global equity sell-off. UK 100 fell to an intraday low of 7,533.5 on 7 April before recovering as trade tensions subsequently eased.
That recovery continued through the rest of 2025, with the index closing the year at 9,933.0. The advance extended into 2026, taking UK 100 to an all-time high of 10,898.5 on 25 August. It has since given back part of that move, closing at 10,630.5 on 15 September 2026.
Past performance is not a reliable indicator of future results. This is not investment advice.

Past performance is not a reliable indicator of future results. Prices are indicative and may differ from live market prices.
UK 100 (UK100): Capital.com analyst view
UK 100's 2026 performance has extended the recovery that followed 2025's tariff-related volatility, taking the index from around 9,933 at the start of the year to an all-time high of 10,898.5 on 25 August. It has since eased towards the 10,600–10,700 area as oil prices and bond yields have risen.
The outlook remains mixed. Stronger corporate earnings or lower bond yields could support valuations, while weaker profits or persistently high yields could weigh on them. Higher oil prices may benefit energy companies but also add to inflation concerns and pressure rate-sensitive sectors.
Sterling can also influence the index because many FTSE 100 companies earn revenue overseas. A weaker pound can raise the sterling value of foreign earnings, while a stronger currency may reduce it. Bank of England policy could similarly support some sectors while weighing on others.
These competing factors leave UK 100 sensitive to both corporate and macroeconomic developments, with recent gains providing no reliable indication of future direction.
Capital.com’s client sentiment for UK 100 CFDs
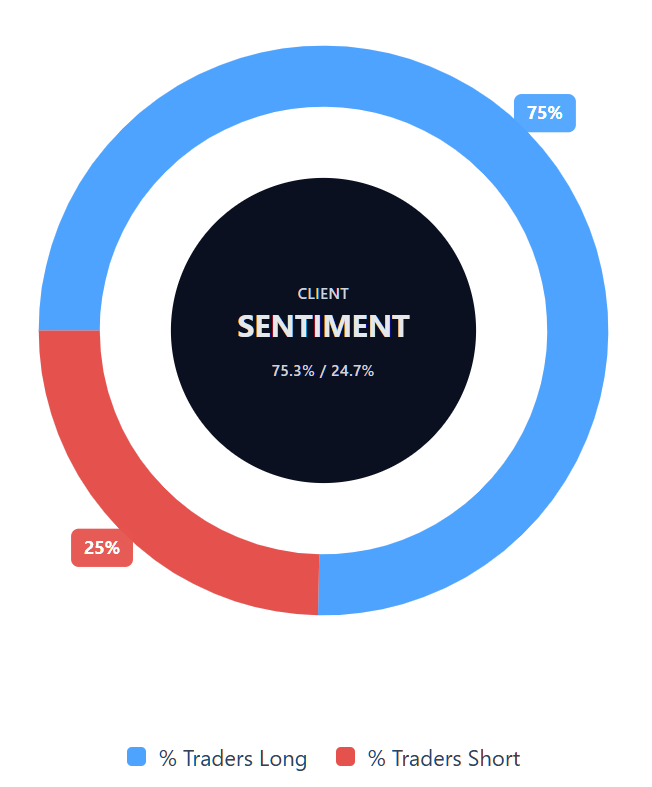
As of 15 September 2026, Capital.com client positioning in UK 100 CFDs leans towards long positions, with 75.3% of clients holding buy positions and 24.7% holding sell positions, a difference of 50.6 percentage points.
This reflects a marked long skew at the time of capture, but positioning can change and does not indicate future price direction.
Summary – UK 100 2026
- As of 9:40am UTC on 15 September 2026, UK 100 traded near 10,628, within an intraday range of 10,597–10,739.8.
- The index sits below its shorter-term moving averages but above its 100- and 200-day SMAs, while RSI near 40 and ADX around 18 provide no clear directional signal.
- Key factors include oil-linked inflation concerns, bond yields, sterling movements, UK inflation data and the Bank of England rate decision.
- Barratt Redrow and NEXT are among the FTSE 100 constituents reporting this week.
Past performance is not a reliable indicator of future results.
FAQ
Who owns the most UK 100?
UK 100 isn't a company with shareholders, so it doesn't have a single owner or largest shareholder. It is Capital.com's CFD market based on the FTSE 100, an index of 100 large companies listed on the London Stock Exchange. The weight of individual companies within the underlying index varies according to their market capitalisation, meaning larger constituents can have a greater influence on overall index movements.
What is the five-year UK 100 forecast?
The article doesn't provide a five-year UK 100 forecast. The cited third-party estimates cover shorter periods, including UBS projections of 11,200 by December 2026 and 11,500 by June 2027, and a Goldman Sachs 12-month target of 11,400. Five-year projections would involve considerably more uncertainty because corporate earnings, interest rates, inflation, commodity prices, sterling and the composition of the underlying FTSE 100 can all change over time.
Is UK 100 a good CFD to trade?
Whether UK 100 is suitable to trade depends on a trader's objectives, experience and tolerance for risk. The index offers exposure to a broad group of large UK-listed companies, but its price can respond to earnings, interest rates, sterling and commodity markets. These factors can support or weigh on the index at different times. CFDs also use leverage, which magnifies both potential gains and losses, so they aren't appropriate for everyone.
Could UK 100 go up or down?
Yes. UK 100 can move in either direction as corporate and macroeconomic conditions change. Stronger earnings, lower bond yields or favourable currency moves could support the index, while weaker profits, higher yields or economic uncertainty could weigh on it. Commodity prices can have mixed effects: higher oil prices may benefit energy constituents while increasing inflation concerns elsewhere. The article's technical indicators also show no clear directional alignment at the time of writing.
Should I invest in UK 100?
Whether to gain exposure to UK 100 depends on your objectives, financial circumstances and tolerance for risk. This article doesn't recommend investing or trading in the index. Factors including UK corporate earnings, Bank of England policy, bond yields, sterling and commodity prices may affect performance in either direction. Third-party forecasts also use different methodologies and time horizons, so they shouldn't be treated as reliable indicators of future index levels or returns.
Can I trade UK 100 CFDs on Capital.com?
Trading UK 100 CFDs on Capital.com lets you speculate on movements without owning the underlying asset and to take long or short positions. However, contracts for difference (CFDs) are traded on margin, and leverage amplifies both profits and losses. You should ensure you understand how CFD trading works, assess your risk tolerance, and recognise that losses can occur quickly.