S&P 500’s Confluent Pullback Zone
It’s finally happened: the S&P 500 has started to retreat after a strong upward trend. Between late October and early November, the US headline index surged by 28%, marking a powerful uptrend.
With the S&P pulling back from highs, let's explore where prices might find support.
Retreat and Rebound: Analysing S&P 500's Pullback Opportunities
It’s finally happened: the S&P 500 has started to retreat after a strong upward trend. Between late October and early November, the US headline index surged by 28%, marking a powerful uptrend.
However, concerns about persistent inflation have led markets to reconsider expectations for rate cuts. Additionally, Iran’s military strike on Israel has raised fears of a larger conflict, potentially disrupting energy supplies in the region. These factors have collectively slowed the S&P's ascent. After forming a small triple top pattern at the beginning of the month, prices have begun to pull back.
Pullbacks are normal in uptrends and can present opportunities to re-enter the market at better risk/reward levels. By analysing various technical indicators, we can identify a confluent pullback zone on the S&P's daily candle chart, offering an estimate of where the pullback might find support.
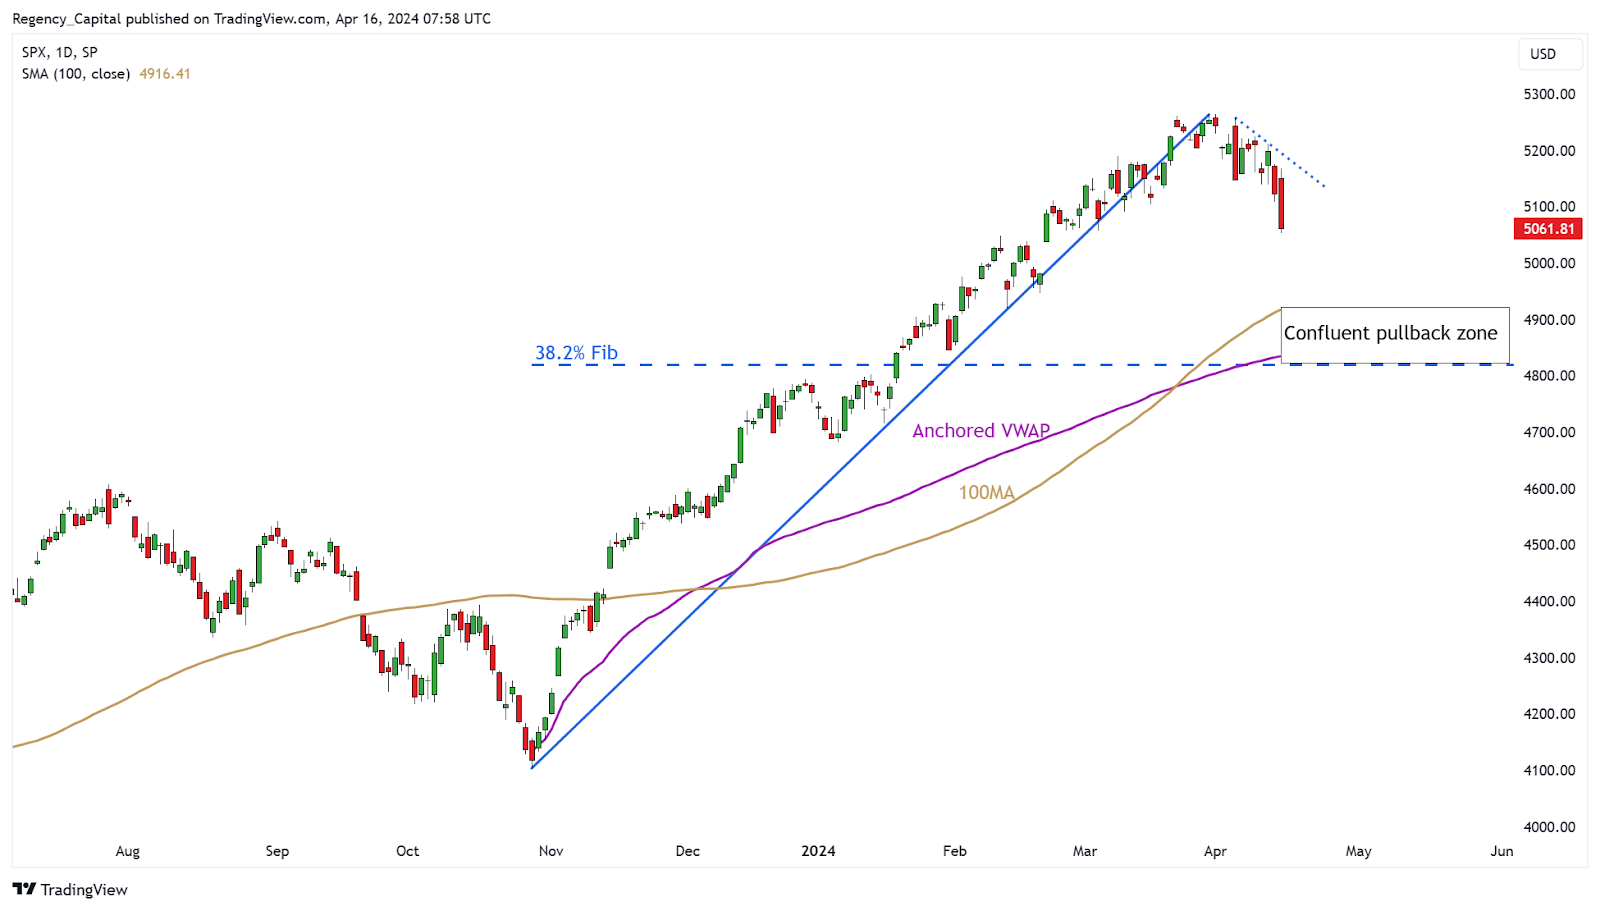
In the chart below, we observe confluence among three key technical indicators:
- 38.2% Fibonacci retracement: Reflects a significant Fibonacci level from the October-April rally.
- 100-Day Simple Moving Average: A widely monitored moving average.
- VWAP Anchored to October lows: Represents the volume-weighted average price of investors who bought before the rally.
If prices reach the confluent pullback zone, traders may watch for bullish reversal patterns such as a double bottom, bullish engulfing pattern, or large bullish hammer candle to time their re-entry into the market.
S&P 500 Daily Candle Chart
(Past performance is not a reliable indicator of future results)