Is momentum in US stocks changing?
Us stocks continue to face bearish pressure as uncertainties persist, but is the long-term momentum turning?
The US stock market continues to look a little shaky as the S&P 500, Nasdaq and Russell 2000 all ended lower again on Tuesday.
Economic Environment and Market Sentiment
Hotter-than-expected inflation figures and a robust labour market have reinforced expectations that the Federal Reserve will maintain current interest rates for the foreseeable future—with only a pair of modest 25bps rate cuts anticipated later this year. While the resilient economic data may suggest continued growth in corporate earnings, it also means that financing conditions remain tight, potentially hindering market expansion.
Compounding these concerns, consumer confidence has rapidly declined, following a series of lacklustre reports on manufacturing and retail sales. Tariff-related uncertainties have further dampened sentiment; President Trump recently confirmed that 25% tariffs against Canada and Mexico will go into effect next month.
An unstable political climate may also be prompting both consumers and businesses to delay critical investment decisions, thereby weakening growth prospects. Moreover, high valuations—especially among tech giants that have fuelled the market rally over the past two years—are making stocks increasingly expensive for investors. This uncertainty has driven many toward bonds, with the 10-year government yield dropping to 4.28%, the lowest since mid-December.
Technical Analysis: Mixed Signals
The question is whether this is another dip in the uptrend in US stocks or the start of a reversal. A closer look at the daily charts for the S&P 500 and Nasdaq reveals a somewhat chaotic picture. The Relative Strength Index (RSI) on both indices has fallen into selling territory, and the key moving averages are no longer consistently positioned below current prices. However, recent lows have held firm, with both indices finding support at their respective 100-day Simple Moving Averages (SMAs).
For the bearish trend to solidify, the indices would need to fall below the levels where the bullish uptrend began to plateau—around 5,800 for the S&P 500 and 20,650 for the Nasdaq.
S&P 500 daily chart
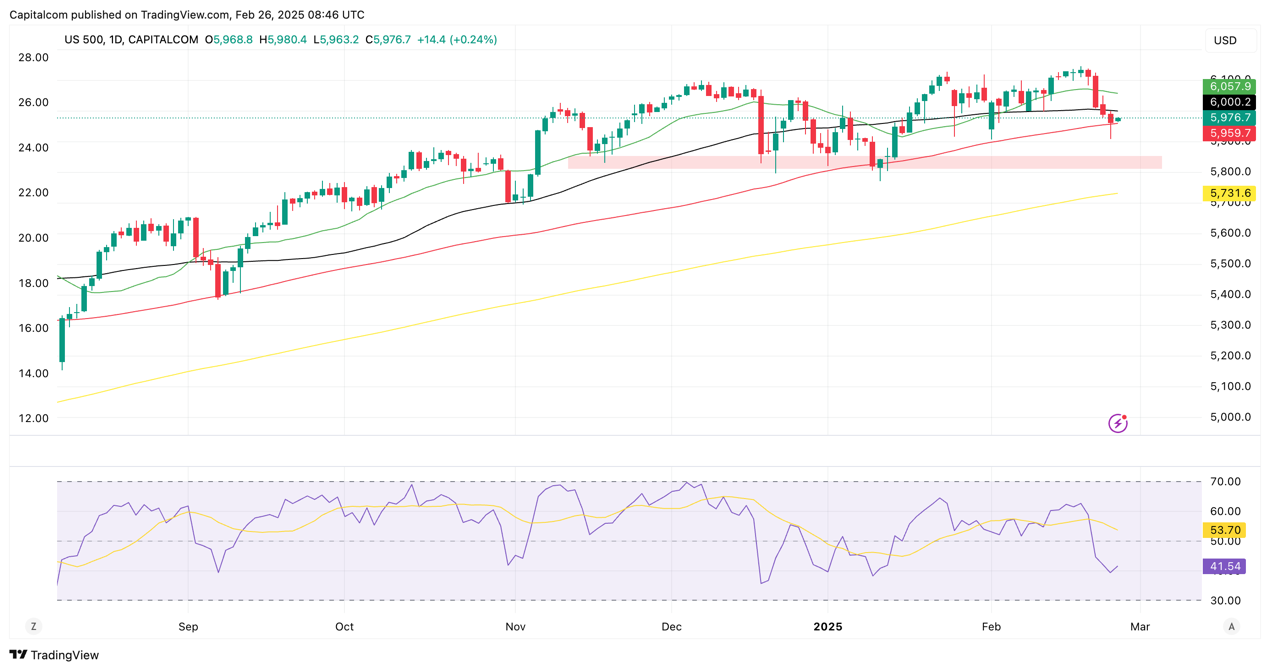
Past performance is not a reliable indicator of future results.
When zooming out to the weekly charts, the current pullback appears less threatening. Since the uptrend commenced in October 2023, there have been three previous corrections. Each time, the 20-week SMA provided robust support and allowed the market to reset before attracting fresh buyers. This historical pattern suggests that the current downturn may be a temporary pause rather than the start of a reversal.
S&P 500 weekly chart
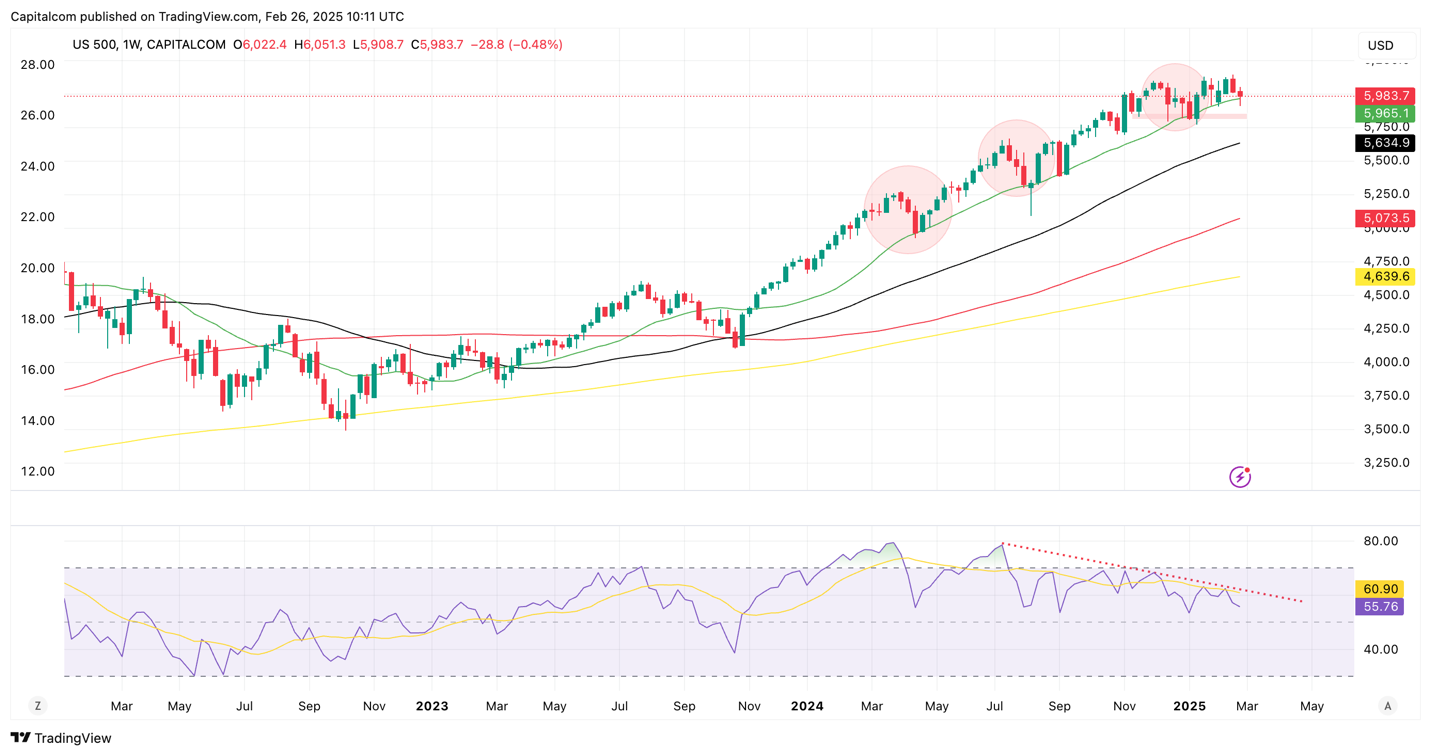
Past performance is not a reliable indicator of future results.
Long-Term Momentum: A Potential Shift?
Despite the reassuring support on weekly charts, recent trends hint at a potential change in long-term momentum. The interval between the last pullback and the current selloff has shortened noticeably, and prices have struggled to move decisively away from the 20-week SMA. Additionally, the RSI is exhibiting bearish divergence—forming lower highs even as prices record higher peaks since July of last year. This divergence could signal a gradual shift in market dynamics, suggesting that the overall bias may tilt towards the downside throughout 2025.
Conclusion
While there is no immediate threat of a full-blown reversal in the US stock market, the emerging signs of weakening long-term momentum indicate that stocks could eventually trend lower. Investors should remain cautious and consider these technical and economic signals when making future decisions.