Can Nvidia Go Higher?
In early-January we published a Breakout Alert highlighting Nvidia’s breakout from a long-term consolidation phase. Nearly two months on, the shares have surged 59% and we’re now left asking, can Nvidia go higher?
In early-January we published a Breakout Alert highlighting Nvidia's breakout from a long-term consolidation phase. Nearly two months on, the shares have surged 59% and we're now left asking, can Nvidia go higher?
Nvidia's quarterly numbers: A “tipping point” in the AI revolution
Last week's colossal quarterly update from Nvidia represents a self-proclaimed “tipping point” in the AI revolution.
The $22.1 billion in quarterly revenues, a staggering 265% increase, far exceeding Wall Street predictions, is not merely a financial achievement for Nvidia but a testament to the seismic shift happening in the tech landscape.
Nvidia's founder and CEO, Jensen Huang, didn't mince his words when he declared, “Accelerated computing and generative AI have hit the tipping point.” This statement encapsulates a pivotal moment where the demand for AI technologies has surged globally, creating an unprecedented frenzy.
On the back of the market-beating numbers, Nvidia's share price gapped higher again – reigniting the powerful stocks uptrend.
Signs of exhaustion creeping in
The Breakout Alert we published in early-January highlighted several reasons why Nvidia's breakout was likely to sustain, including the prolonged period of consolidation prior to the breakout, the strong close backed by rising volume, and the long-term uptrend.
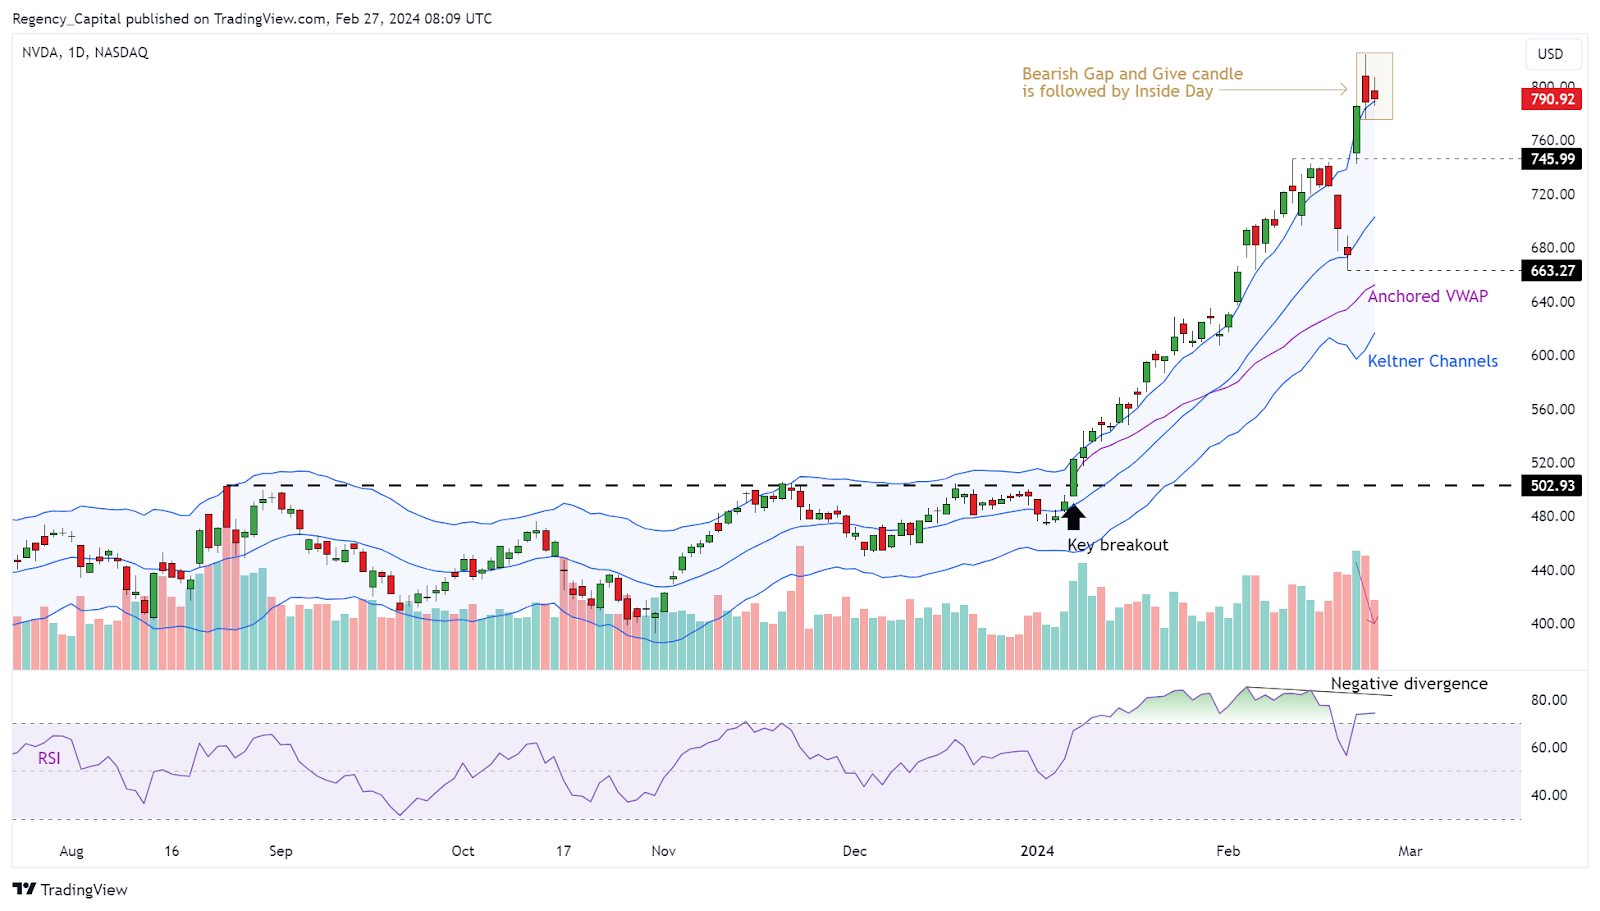
However, with prices more than 20% above the volume weighted average price (VWAP) anchored to the January breakout, there are signs that trend exhaustion is creeping in.
1. Bearish 'Gap and Give':
On Friday, Nvidia's share price gapped outside the upper Keltner Channel only to close lower on the day – forming a 'gap and give' pattern which signals exhaustion. This has been followed by a small inside day. A break below the inside day lows could trigger a deep pullback.
2. RSI Divergence:
The RSI being technically 'overbought' is nothing new to Nvidia. The RSI stands for Relative Strength Index and there are no better stocks at demonstrating relative strength than Nvidia. However, in recent weeks, the shares have been making higher highs, but the RSI has been making lower highs – negative divergence. This is signals that the trend is potentially running out of momentum.
3. Falling Volume:
We have seen quite a significant drop in volume since last week's quarterly numbers. This is not a standalone indication of exhaustion, but when viewed within the context of the other factors it adds to the picture of waning appetite to drive higher prices.
NVDA Daily Candle Chart
(Past performance is not a reliable indicator of future results)