Dark cloud cover candlestick pattern: definition & trading strategy
The dark cloud cover is a recognised candlestick pattern in technical analysis. It’s typically used to highlight a possible shift from bullish to more cautious or bearish conditions after an uptrend. Rather than predicting outcomes with certainty, it offers a visual way to interpret changing sentiment between buyers and sellers.
This guide explains what the dark cloud cover is, how it forms, how some traders use it in technical analysis, and how it compares with other reversal patterns.
What is the dark cloud cover candlestick pattern?
In technical analysis, the dark cloud cover is a two-candle bearish reversal pattern that typically appears after an uptrend. It is often interpreted as a sign that bullish momentum may be weakening and that selling pressure is beginning to increase.
Dark cloud cover patterns can appear across multiple asset classes and timeframes. They’re often assessed on daily or weekly charts, as these can help filter out some of the noise present in very short-term price movements.
- The dark cloud cover is a two-candle bearish reversal pattern that can form after an uptrend.
- It consists of a strong bullish candle followed by a bearish candle that opens above the first candle’s close or high and closes below the first candle’s midpoint.
- The pattern highlights a possible transition from buyer dominance to increasing selling pressure.
- Some traders view the pattern as more noteworthy when it forms near resistance levels, with elevated volume and supporting technical indicators, although outcomes still vary.
- Historical tests generally suggest modest reliability on a standalone basis, so the pattern is often combined with broader technical and risk-management frameworks.
How the dark cloud cover pattern forms
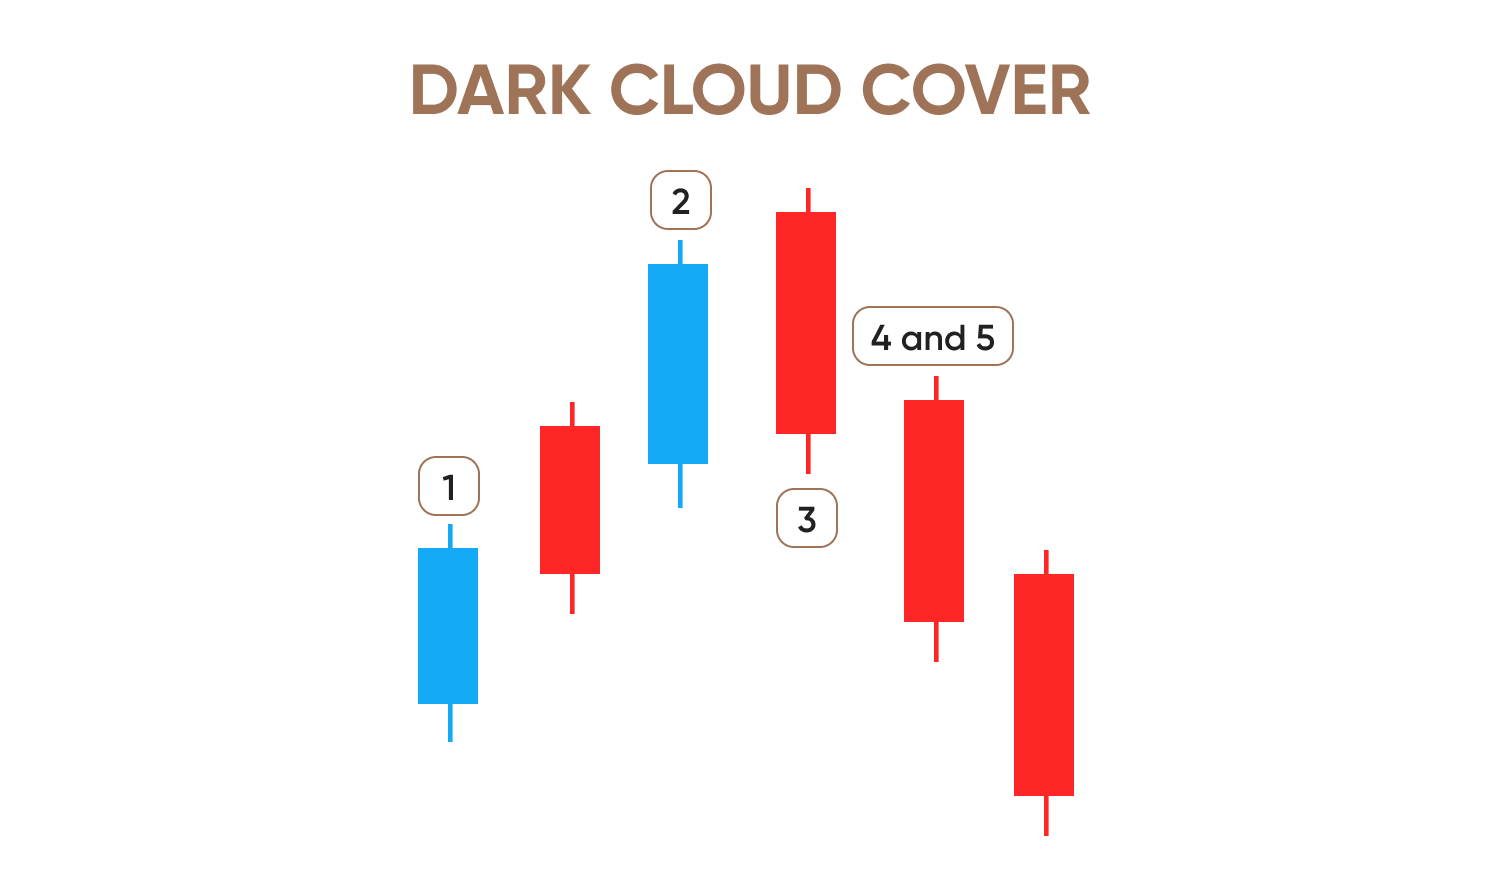
The dark cloud cover pattern focuses on the transition from a strong upward move to an early sign of potential weakness. For a textbook example, several conditions are usually present:
Prior uptrend
The pattern is usually considered most meaningful after a clear upward move, typically shown by higher highs and lows or price holding above key moving averages. A small rebound within a sideways range offers far less contextual significance.
First candle: strong bullish session
The first candle is usually a large bullish candlestick that closes near its high, indicating sustained buying interest throughout the session and showing that buyers were firmly in control before the potential shift appears.
Second candle opens above the previous high
The second session often opens above the prior high, sometimes with a gap, suggesting bullish momentum initially continues. This higher open provides the contrast that makes the subsequent reversal more notable within the pattern.
Second candle closes below the midpoint of the first candle’s body
During the second session, selling pressure intensifies, pushing the close below the first candle’s midpoint. This key feature signals that earlier optimism has been overwhelmed. Some definitions require the close to remain above the first candle’s open to avoid mimicking a bearish engulfing pattern.
How to identify the dark cloud cover in technical analysis
Spotting the dark cloud cover is not only about recognising the visual formation; it’s also about interpreting it within a broader market context. Here is a structured approach:
- 1. Confirm a prior uptrendLook for higher swing highs and lows, price trading above key moving averages (such as the 20-day or 50-day), and a meaningful upward move rather than a minor rebound.
- 2. Identify the first candleEnsure the first candle is clearly bullish, with a relatively large real body and a close near the session high.
- 3. Assess the opening of the second candleCheck that the second candle opens above the first candle’s high – or at least its close – indicating continued bullish sentiment at the open.
- 4. Measure the midpoint of the first candleCalculate the midpoint and confirm that the second candle closes below it, showing sellers have retraced more than half of the prior gain.
- 5. Evaluate candle size and volumeLook for relatively large real bodies and equal or higher volume on the second candle, which some traders view as potential signs of stronger selling conviction.
Finally, consider whether the pattern forms near resistance or key levels, and look for supporting signals from tools such as RSI or MACD for signs of overextension or weakening momentum.
How to calculate the midpoint of the first candle
Frequency and success rate
The dark cloud cover appears with moderate frequency and has sometimes been associated with slightly better bearish follow-through in some historical studies, though many instances produce limited or no sustained movement. Its apparent effectiveness often seems higher in some analyses after extended rallies or when supported by volume and other signals. Research generally finds limited standalone predictive power, so the pattern is typically used within a broader analytical framework.
Trading the dark cloud cover pattern
Some traders use the dark cloud cover to identify points where an uptrend may weaken. While the dark cloud cover isn’t a full trading strategy, it can support a broader framework that combines price action, indicators and structured risk management.
Context and confirmation
Traders often confirm an existing uptrend and look for the pattern near resistance. Some wait for added confirmation, such as a lower close, a break of short-term support or weakening momentum, to avoid relying on a single candlestick signal.
Using supporting indicators
Many traders pair the pattern with indicators such as RSI, MACD and moving averages. Overbought readings, bearish crossovers or resistance at key averages can help assess whether the pattern aligns with wider technical conditions, although none guarantees an outcome.
Potential entry approaches
Entry styles vary. Conservative traders may wait for a further bearish close below the pattern’s low. Others act sooner if volume or indicators reinforce the setup, accepting earlier entry but a higher risk of false signals.
Stop-loss and take-profit reference points
Some traders use the pattern’s high as a stop-loss reference and may allow a small buffer for volatility. Take-profit levels often align with nearby support or prior swing lows, guided by pre-defined risk-reward considerations.*
- Stop-loss orders are not guaranteed. Guaranteed stop-loss orders incur a fee if activated.
Dark cloud cover candlestick examples
Dark cloud cover in stock markets
The dark cloud cover can appear on individual shares, particularly after extended upward moves. In equity markets, it is often assessed in the context of sector behaviour. For example, if a share forms the pattern while its sector index also shows reduced upward momentum, some traders may view the alignment as adding context rather than confirmation. Outcomes still vary and depend on broader market conditions.
Dark cloud cover in forex markets
In the forex market, the pattern can appear across major currency pairs and is commonly reviewed on daily and four-hour charts. As forex trades nearly 24 hours a day during the trading week, gaps are less frequent except around weekend opens. Some practitioners therefore adapt the pattern by accepting a second candle that opens above the prior close rather than above the prior high. This reflects market structure rather than altering the pattern’s core idea, and its use varies across methodologies.
Dark cloud cover in cryptocurrency markets
Cryptocurrency markets can produce more examples of the dark cloud cover due to higher volatility. However, this same volatility can generate more false signals. As a result, some traders apply stricter confirmation criteria, such as increased volume, clearer trend context or alignment with additional indicators. Given the speed at which crypto markets move, these filters can help distinguish short-lived fluctuations from more meaningful changes in sentiment.
Case study: failed setup
A dark cloud cover does not always precede a reversal. The pattern may form during strong upward momentum or after materially positive developments, and price may continue rising despite its appearance. In such cases, it illustrates that no single candlestick pattern is decisive. Many traders therefore incorporate predefined stop-loss levels and broader analysis to help manage situations where the pattern does not evolve into sustained downside movement.
Nothing in this section constitutes financial advice. Approaches vary widely, and traders remain responsible for their own decisions and for ensuring that any strategy they use is appropriate for their circumstances.
Advantages and disadvantages of the dark cloud cover
Like most technical patterns, the dark cloud cover has strengths and limitations. Understanding both can help analysts set realistic expectations.
Advantages
- Relatively early potential warning signal: The pattern can highlight a possible shift in sentiment within just two sessions, offering an early indication that bullish momentum may be fading.
- Clear, visual structure: With only two candles and specific criteria, the pattern is relatively straightforward to recognise on charts, even for those who are still building experience.
- Defined technical reference levels: The high of the two-candle formation and the midpoint of the first candle provide clear technical reference points when assessing potential invalidation or risk levels.
- Applies across markets and timeframes: Dark cloud cover formations can appear in equities, indices, commodities, forex and cryptocurrencies, and they can be analysed on anything from intraday to weekly charts.
- Supports sentiment analysis: Beyond its potential use in trade setups, the pattern summarises how sentiment may have shifted from strong buying to renewed or stronger selling pressure.
Disadvantages
- Moderate reliability: Historical testing generally places the dark cloud cover in a moderate to modest reliability category. A significant proportion of patterns do not lead to sustained downward moves.
- Context-dependent performance: The pattern tends to work better in certain environments – for example, after extended uptrends or during counter-trend rallies in broader downtrends – and can be less useful in strongly trending or sideways markets.
- Subjective interpretation: Analysts may differ over what qualifies as a 'clear' uptrend, how strictly to apply gap requirements, and the exact definition of the midpoint. These subjective elements can lead to differing views about validity.
- Sensitivity to timeframe and market: Short-term charts can produce many apparent dark cloud cover patterns that may be heavily influenced by noise. Longer-term charts may deliver fewer but potentially more meaningful formations, at the cost of reduced trading frequency.
- Not a complete strategy: On its own, the pattern does not define a full trading approach. Position sizing, risk management, broader market analysis and personal objectives remain central considerations.
Dark cloud cover vs other patterns
The dark cloud cover is part of a broader group of bearish reversal patterns. Comparing it with related formations can help clarify where it might fit within a technical toolkit.
Dark cloud cover vs bearish engulfing
Dark cloud cover and bearish engulfing both appear after an uptrend and are interpreted as potential bearish reversal signals. Dark cloud cover requires the second candle to close below the midpoint of the first, while bearish engulfing involves the second candle’s body fully engulfing the first. Because engulfing candles often reflect stronger selling dominance, some traders consider them more forceful signals, though they tend to occur less frequently.
Dark cloud cover vs piercing line
The piercing line is generally considered the bullish counterpart to the dark cloud cover. It appears after a downtrend and forms when a bearish candle is followed by a bullish candle that opens lower and closes above the midpoint of the prior body. While dark cloud cover may indicate potential downside after an uptrend, the piercing line highlights a possible shift toward upside momentum following a decline, reflecting the opposite sentiment cycle.
Dark cloud cover vs evening star
The evening star is a three-candle bearish reversal pattern comprising a strong bullish candle, a small-bodied 'star' showing indecision, and a subsequent bearish candle closing well into the first candle’s body. Its multi-stage structure introduces a pause before potential reversal, which some analysts view as adding robustness. However, this additional phase also makes the evening star slower to form than the two-candle dark cloud cover.
A simplified comparison is shown below:
| Pattern | Candles | Typical interpretation | Context |
|---|---|---|---|
| Dark cloud cover | 2 | Moderate bearish reversal | After an uptrend |
| Bearish engulfing | 2 | Strong bearish reversal | After an uptrend |
| Piercing line | 2 | Moderate bullish reversal | After a downtrend |
| Evening star | 3 | Strong bearish reversal | After an uptrend |
None of these patterns guarantees a particular outcome. Understanding how they differ can help traders interpret them in combination with other tools.
Practical tips for traders
For traders who include dark cloud cover patterns in their analysis, several practical points can help frame expectations:
- Prioritise trend context: The pattern tends to carry more weight when it forms after a clear uptrend rather than within a sideways or highly volatile range.
- Look for confluence: Many practitioners give more weight to patterns that coincide with resistance levels, Fibonacci retracement zones, psychological round numbers or key moving averages.
- Combine with indicators: Candlestick patterns can complement, rather than substitute, other technical tools such as RSI, MACD and moving averages.
- Be cautious on very low timeframes: Short-term charts, such as one-minute or five-minute intervals, can generate frequent patterns influenced by noise. Some traders place more emphasis on signals from higher timeframes.
- Use structured risk management: Preserving capital is a central concern in trading. Many traders decide in advance how much of their overall capital they’re willing to risk per position and set stop-loss levels accordingly.
- Review and adapt: Regularly reviewing historical trades can help evaluate whether the dark cloud cover added value to a strategy and under what conditions it seemed more or less helpful.
Nothing in this section should be taken as a recommendation to follow any particular method. Traders should consider their own objectives, experience and risk tolerance.
Psychology behind the pattern
The dark cloud cover reflects a shift in market psychology across two sessions:
- The first candle shows confidence, with buyers pushing price higher and often closing near the session’s peak.
- The second candle opens higher, continuing the optimistic tone, but sentiment shifts as selling pressure emerges through the session.This may stem from profit-taking, resistance levels or new information.
When price falls back into the prior candle’s body and closes below its midpoint, it suggests sellers have taken control. Traders who bought near the open may be facing losses, which can influence later behaviour. Whether the shift continues depends on wider market conditions and news flow.
Backtesting & effectiveness
Historical testing provides perspective on how the dark cloud cover has behaved across large datasets. Studies suggest only a modest bearish edge, so it’s often used as a supporting signal rather than a standalone strategy. Results may improve after extended uptrends, within broader downtrends, or when combined with volume and other tools. Outcomes vary by definition, timeframe and methodology, so no single statistic is definitive.
Conclusion
The dark cloud cover candlestick pattern is a widely recognised bearish reversal formation that seeks to capture a shift from bullish control to emerging selling pressure after an uptrend. Defined by a strong bullish candle followed by a bearish candle that opens higher but closes below the first candle’s midpoint, it offers a compact visual snapshot of changing sentiment.
Create an account Open a demo account
FAQ
What does the dark cloud cover candlestick indicate?
The dark cloud cover is a two-candle bearish reversal pattern that signals a potential shift in sentiment following an uptrend. It forms when a strong bullish candle is followed by a bearish candle that opens above the previous high but closes below the midpoint of the first candle’s real body. This sequence shows that buyers initially advanced prices but were later overtaken by selling pressure, creating the possibility of a pause, correction or reversal in the upward move. While the pattern highlights a change in the balance between buying and selling activity, it does not imply certainty about what will happen next.
Is dark cloud cover bullish or bearish?
The pattern is considered bearish because it emerges after an upswing and reflects slowing upward momentum. The combination of a bullish candle, a higher open on the next session and a subsequent close well into the previous candle’s body suggests that sellers have disrupted the prevailing trend. Although this is often interpreted as an early warning that bullish conditions may be under pressure, the formation alone cannot confirm that the market will turn lower; it simply indicates that the strength behind the prior uptrend may be weakening.
How reliable is the dark cloud cover pattern?
The dark cloud cover is generally viewed as having modest reliability on a standalone basis. Historical research often shows the pattern preceding bearish reversals slightly more often than continuation, yet a sizeable number of instances fail or lead only to short-lived pullbacks. Its perceived effectiveness tends to improve when it appears after extended rallies, within counter-trend moves in broader downtrends, or around well-established resistance zones. Because of this, many traders regard it as a contextual clue rather than a complete signal and look for confirmation through volume, indicators and broader price structure.
What is the difference between dark cloud cover and bearish engulfing?
Both patterns indicate potential bearish shifts, but they differ in the degree to which sellers take control. A dark cloud cover requires the second candle to open higher and close below the midpoint of the first candle without necessarily covering it completely. By contrast, a bearish engulfing pattern forms when the second candle’s real body entirely engulfs the previous candle’s body, usually reflecting a more forceful change in sentiment. Because the engulfing pattern represents a fuller reversal of the prior session’s gains, it is often interpreted as the stronger of the two, although both serve similar analytical purposes.
What is the opposite of the dark cloud cover pattern?
The opposite is the piercing line pattern, which appears after a downtrend and highlights a possible shift towards bullish sentiment. While the dark cloud cover reflects sellers overriding earlier buying pressure, the piercing line shows buyers reasserting themselves after a period of weakness. It does so through a bearish candle followed by a bullish candle that opens lower but closes above the midpoint of the previous candle’s body. Both patterns illustrate changing sentiment, though in opposing directions, and neither provides certainty about future price movements.
How can you confirm a dark cloud cover signal?
Confirmation usually comes from observing how price behaves immediately after the pattern forms. Some traders look for a subsequent close below the low of the two-candle formation, suggesting that selling interest is continuing rather than fading. Others pay attention to whether the bearish candle forms with relatively elevated volume or whether the pattern appears near a level that has acted as resistance in the past. Additional signals, such as indicators showing overbought conditions or weakening momentum, may further support the idea that the uptrend is losing strength. Even when several elements align, outcomes can still vary.
Which indicators work best with dark cloud cover?
The pattern is often combined with broader momentum and trend tools to give it more context. Traders may look to RSI for signs of overbought conditions or divergence where price rises but momentum begins to fade. MACD can serve a similar purpose by highlighting potential slowing in upward movement, while moving averages help define whether the broader trend supports or contradicts the pattern’s implications. Volume can also add insight, as stronger selling activity on the second candle may indicate deeper participation. No indicator can guarantee an outcome, but each can help place the pattern within the wider technical picture.
Can the dark cloud cover be used in forex and crypto trading?
The pattern can appear across markets, including forex and cryptocurrencies. In forex, where continuous trading limits the formation of gaps, traders often focus less on the precise opening position of the second candle and more on whether its close cuts deeply into the previous candle’s body. Context, confirmation and risk controls play a key role when interpreting the pattern.
How often does the dark cloud cover appear in markets?
The dark cloud cover appears with moderate frequency across liquid instruments. On daily charts, several examples may surface over a month depending on the asset and prevailing trend conditions, although only a subset will meet stricter criteria relating to candle size, location and context. Weekly charts tend to produce fewer occurrences but may offer clearer signals because each candle reflects more sustained market activity. As with any candlestick formation, the frequency of appearance does not imply reliability, and each instance is typically assessed alongside other forms of analysis.