交易 Spectrum Brands Holdings - SPB 差價合約
最新股票文章
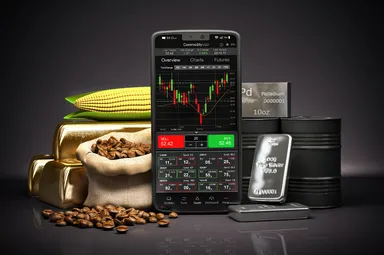
期貨是什麼?一文看懂期貨合約運作、種類與香港交易入門
期貨是什麼?本文拆解期貨合約組成、保證金計算與常見類型(股指、商品、加密貨幣),並詳解香港恒指期貨玩法、開戶流程及風險管理,新手必讀入門教學。
10:57, 16 6月 2026
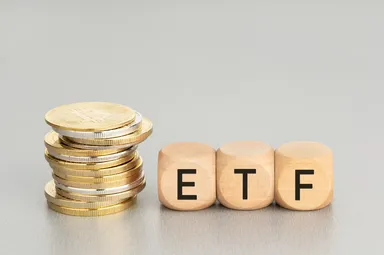
ETF是什麼?一文讀懂交易所買賣基金的運作、種類與投資方法
ETF是什麼?本文深入解析交易所買賣基金的運作原理、主要類型(指數、債券、主題、槓桿反向)、投資費用及香港/美股熱門ETF清單,幫助新手快速開始ETF投資。
10:21, 16 6月 2026

港人實戰:如何佈局 SpaceX IPO 前後的交易節奏
SpaceX以750億美元完成歷史性IPO,估值1.77萬億美元。深度解析港股CFD交易策略、供應鏈映射與恒生指數聯動,助投資者理解太空經濟相關市場動態。資本面臨風險。
08:58, 16 6月 2026
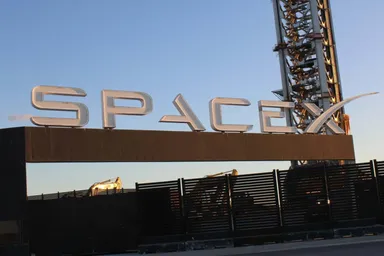
SpaceX上市首日收漲19%——IPO後如何交易SpaceX SPCX差價合約
SpaceX(SPCX)於2026年6月12日在納斯達克首次上市,開盤報150美元,收盤報160.95美元,較135美元的IPO發行價上漲19.2%。
08:23, 16 6月 2026