交易 Rolls-Royce Holdings PLC - RR.
最新股票文章

三大技術指標 實戰捕捉美股見頂調整訊號
以標普500與納指為例,拆解50日及200日均線、RSI與MACD如何組成技術轉弱框架,協助讀者辨識短線回調與趨勢反轉。本文僅供一般資訊用途,不構成投資研究、投資建議或任何交易推薦。
07:26, 23 7月 2026
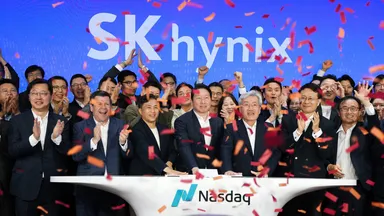
亞洲投資者如何了解SK hynix ADR的市場結構與相關風險
全面拆解SK hynix ADR(SKHY)交易機制:ADR換算比例、港股戶口執行路徑、韓圜匯率風險、與英偉達(NVDA)及半導體ETF的跨市場比較,以及AI供應鏈配置框架,適合香港及亞洲投資者參考。
07:10, 14 7月 2026

SpaceX 產業鏈與受惠股:從太空到 AI 再到防務
全面解析 SpaceX 產業鏈:從火箭推進、衛星載荷到地面段,逐一檢視美股、A股與港股受惠標的的功能對標與實際供貨差異,評估估值修復風險與跨市場波動傳導。
07:58, 22 6月 2026
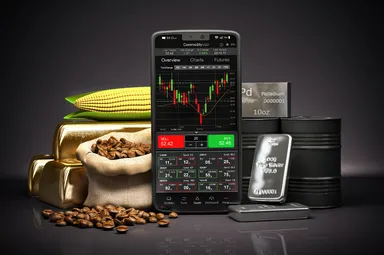
期貨是什麼?一文看懂期貨合約運作、種類與香港交易入門
期貨是什麼?本文拆解期貨合約組成、保證金計算與常見類型(股指、商品、加密貨幣),並詳解香港恒指期貨玩法、開戶流程及風險管理,新手必讀入門教學。
10:57, 16 6月 2026
Reuters News•Europe
17:31 (UTC), 24 undefined 2026Reuters News•Europe
17:13 (UTC), 24 undefined 2026Reuters News•Europe
15:58 (UTC), 22 undefined 2026Reuters News•Europe
02:25 (UTC), 22 undefined 2026Reuters News•Europe
01:54 (UTC), 22 undefined 2026Reuters News•Europe
13:59 (UTC), 21 undefined 2026Reuters News•Europe
13:21 (UTC), 21 undefined 2026