Silver Breaks Away from Gold in a Potential Blow-Off Top
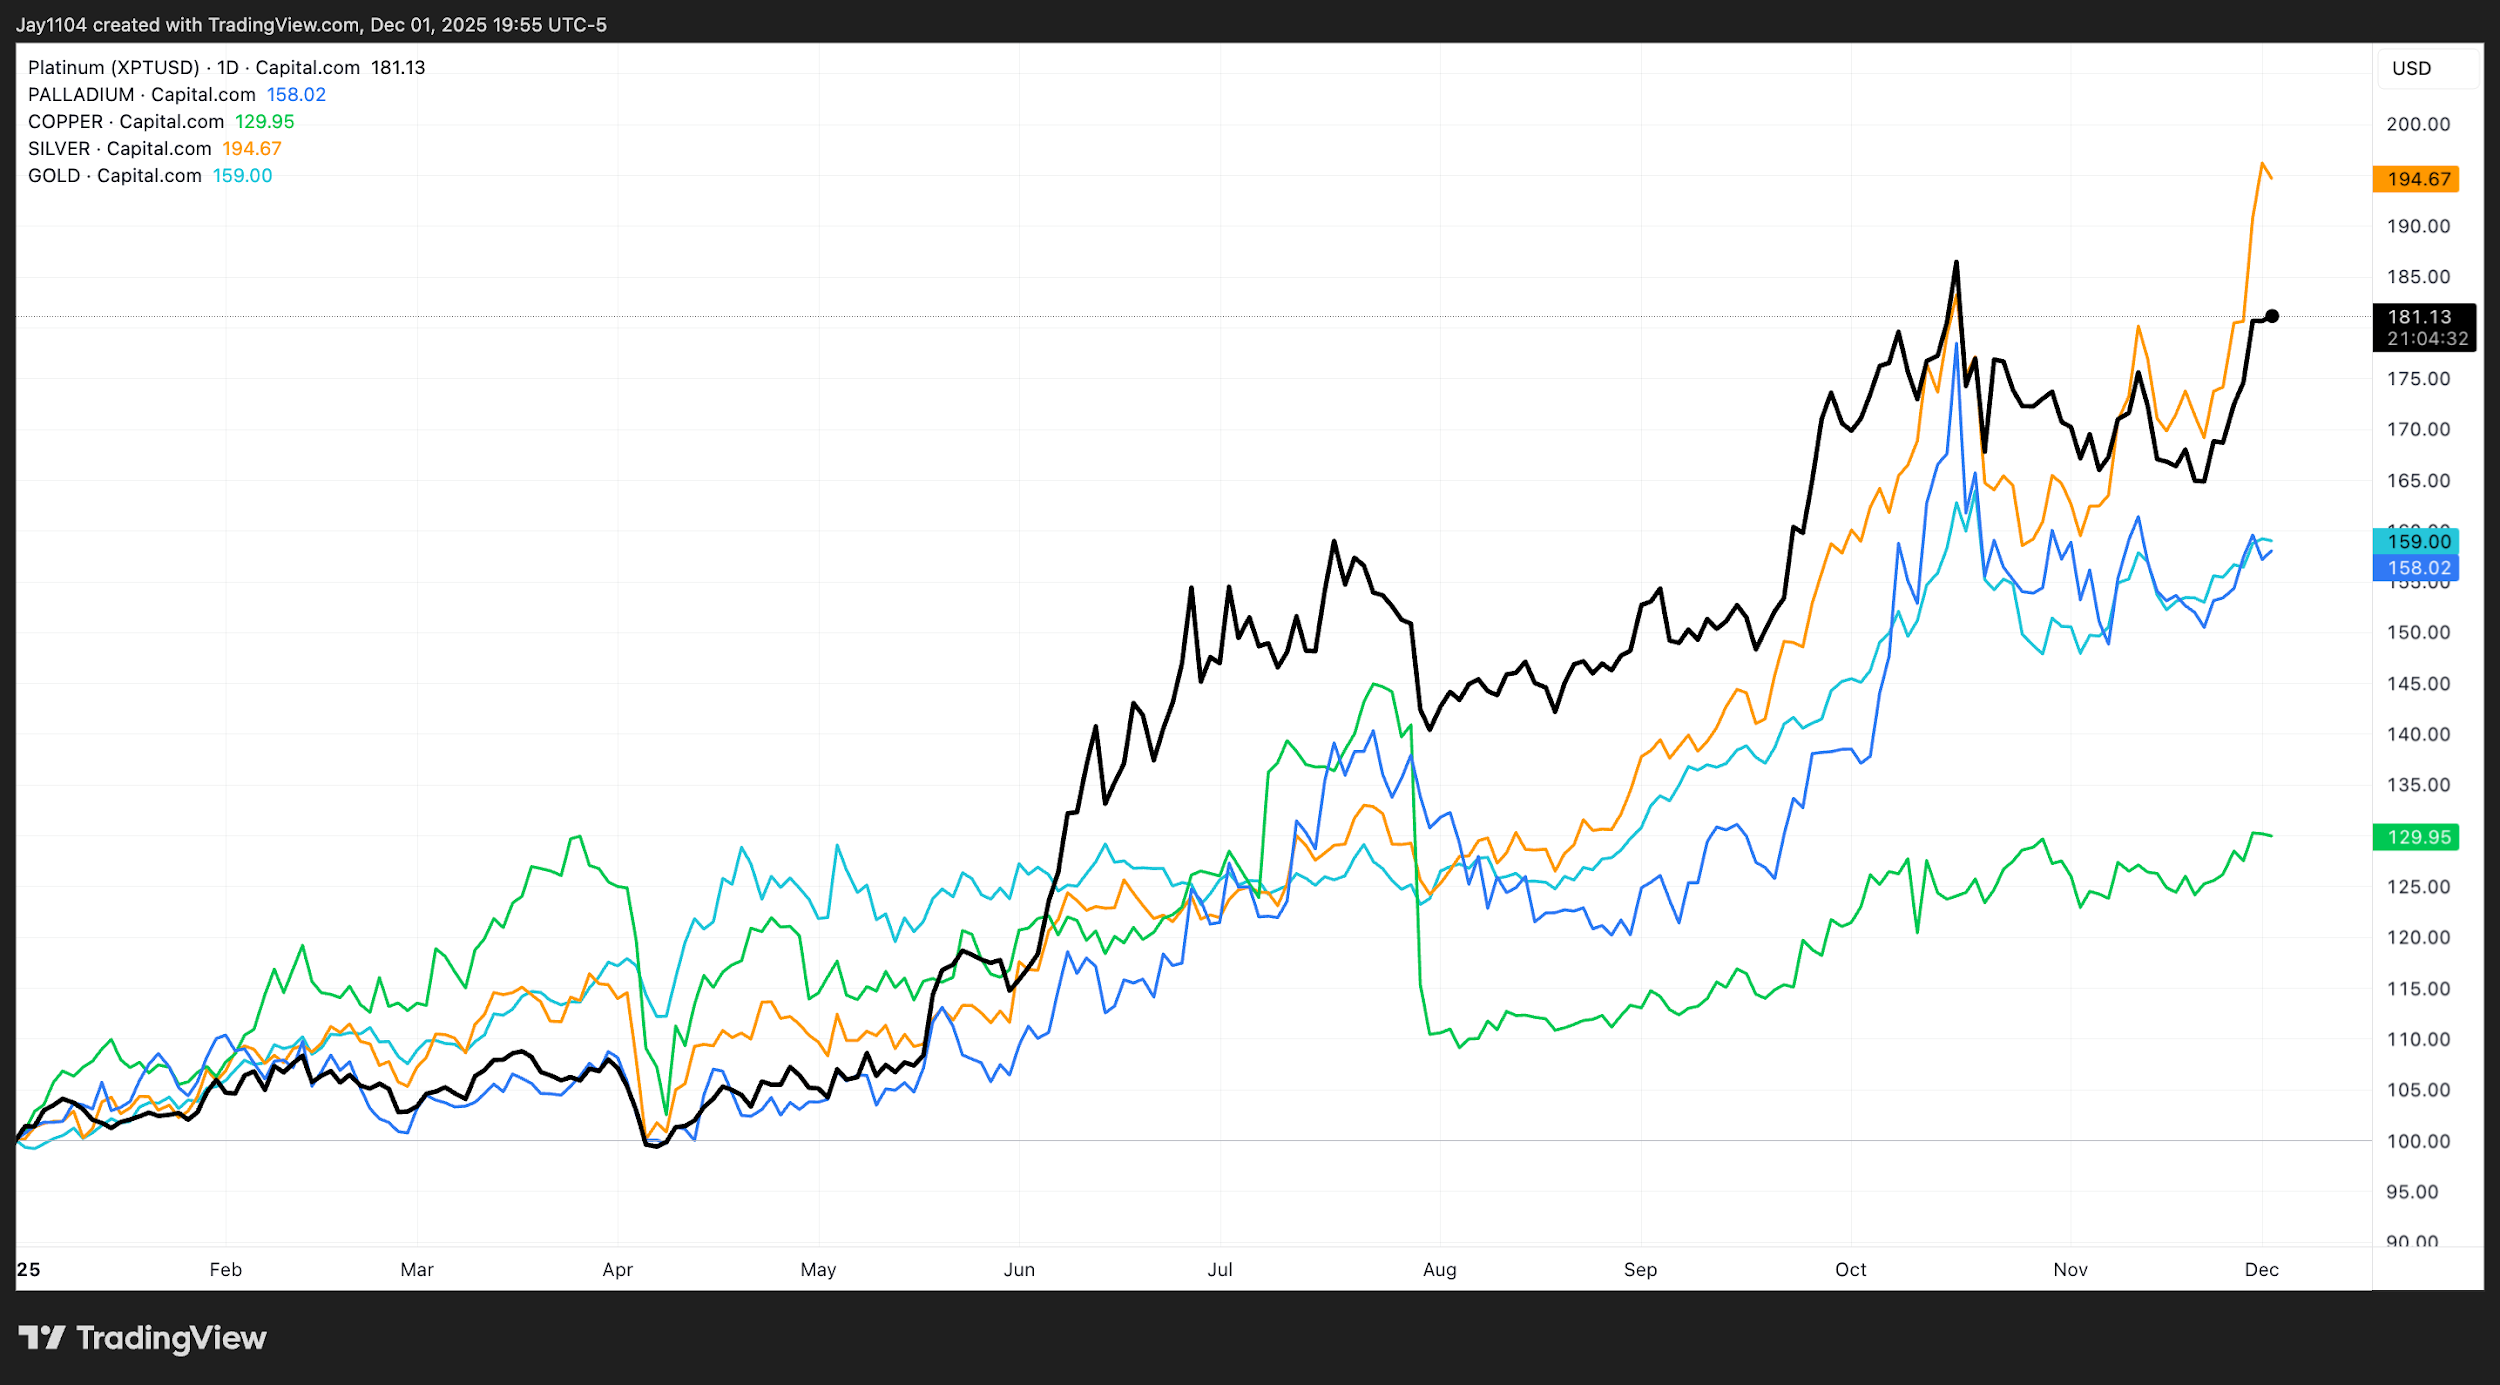
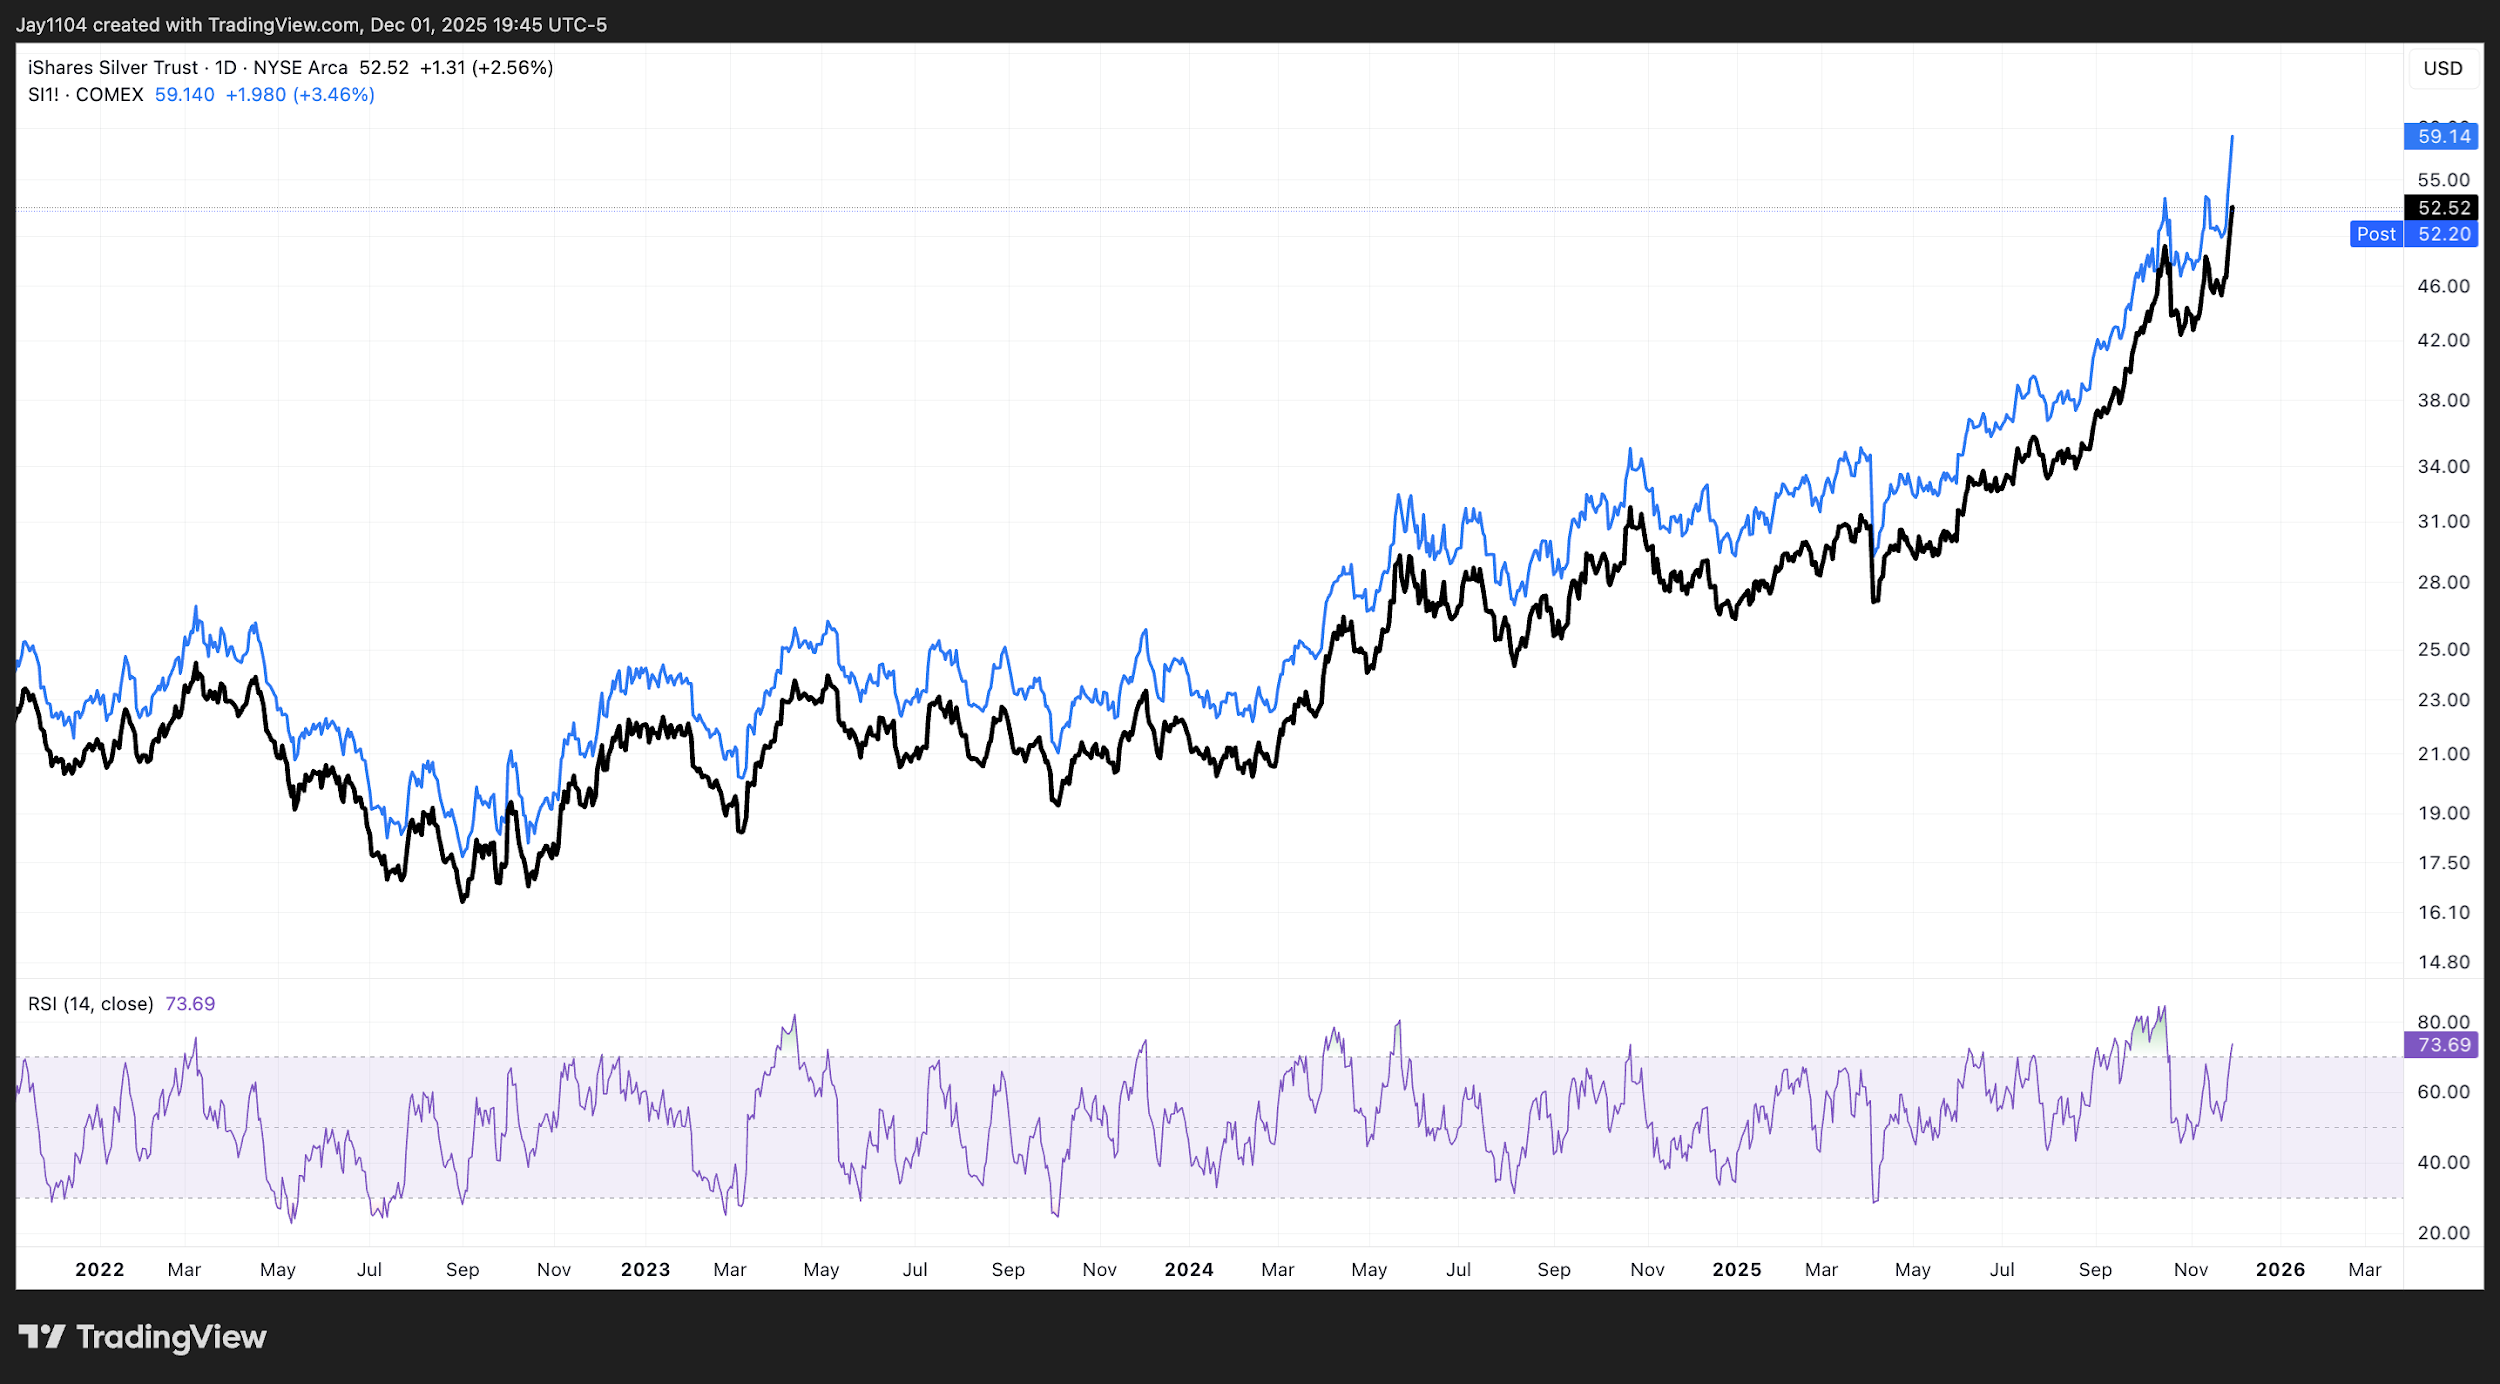
Gold and silver prices have surged in 2025, but several divergences have emerged more recently, with notable non-confirmations between gold and silver, as well as across other precious metals such as platinum and palladium, and industrial metals like copper.
[CHART1] These divergences suggest that the move we are seeing in silver is specific to silver itself and may have little to do with notions of the end of fiat currency, monetary debasement, or a return of inflation. Instead, it may reflect speculative risk-taking, particularly given that gold, platinum, palladium, and copper have yet to make new highs, while silver has moved significantly higher — potentially sending a warning signal about developments in that market specifically.
(Source: TradingView)
(Past performance is not a reliable indicator of future results)
[CHART1]

Mania or Reason?
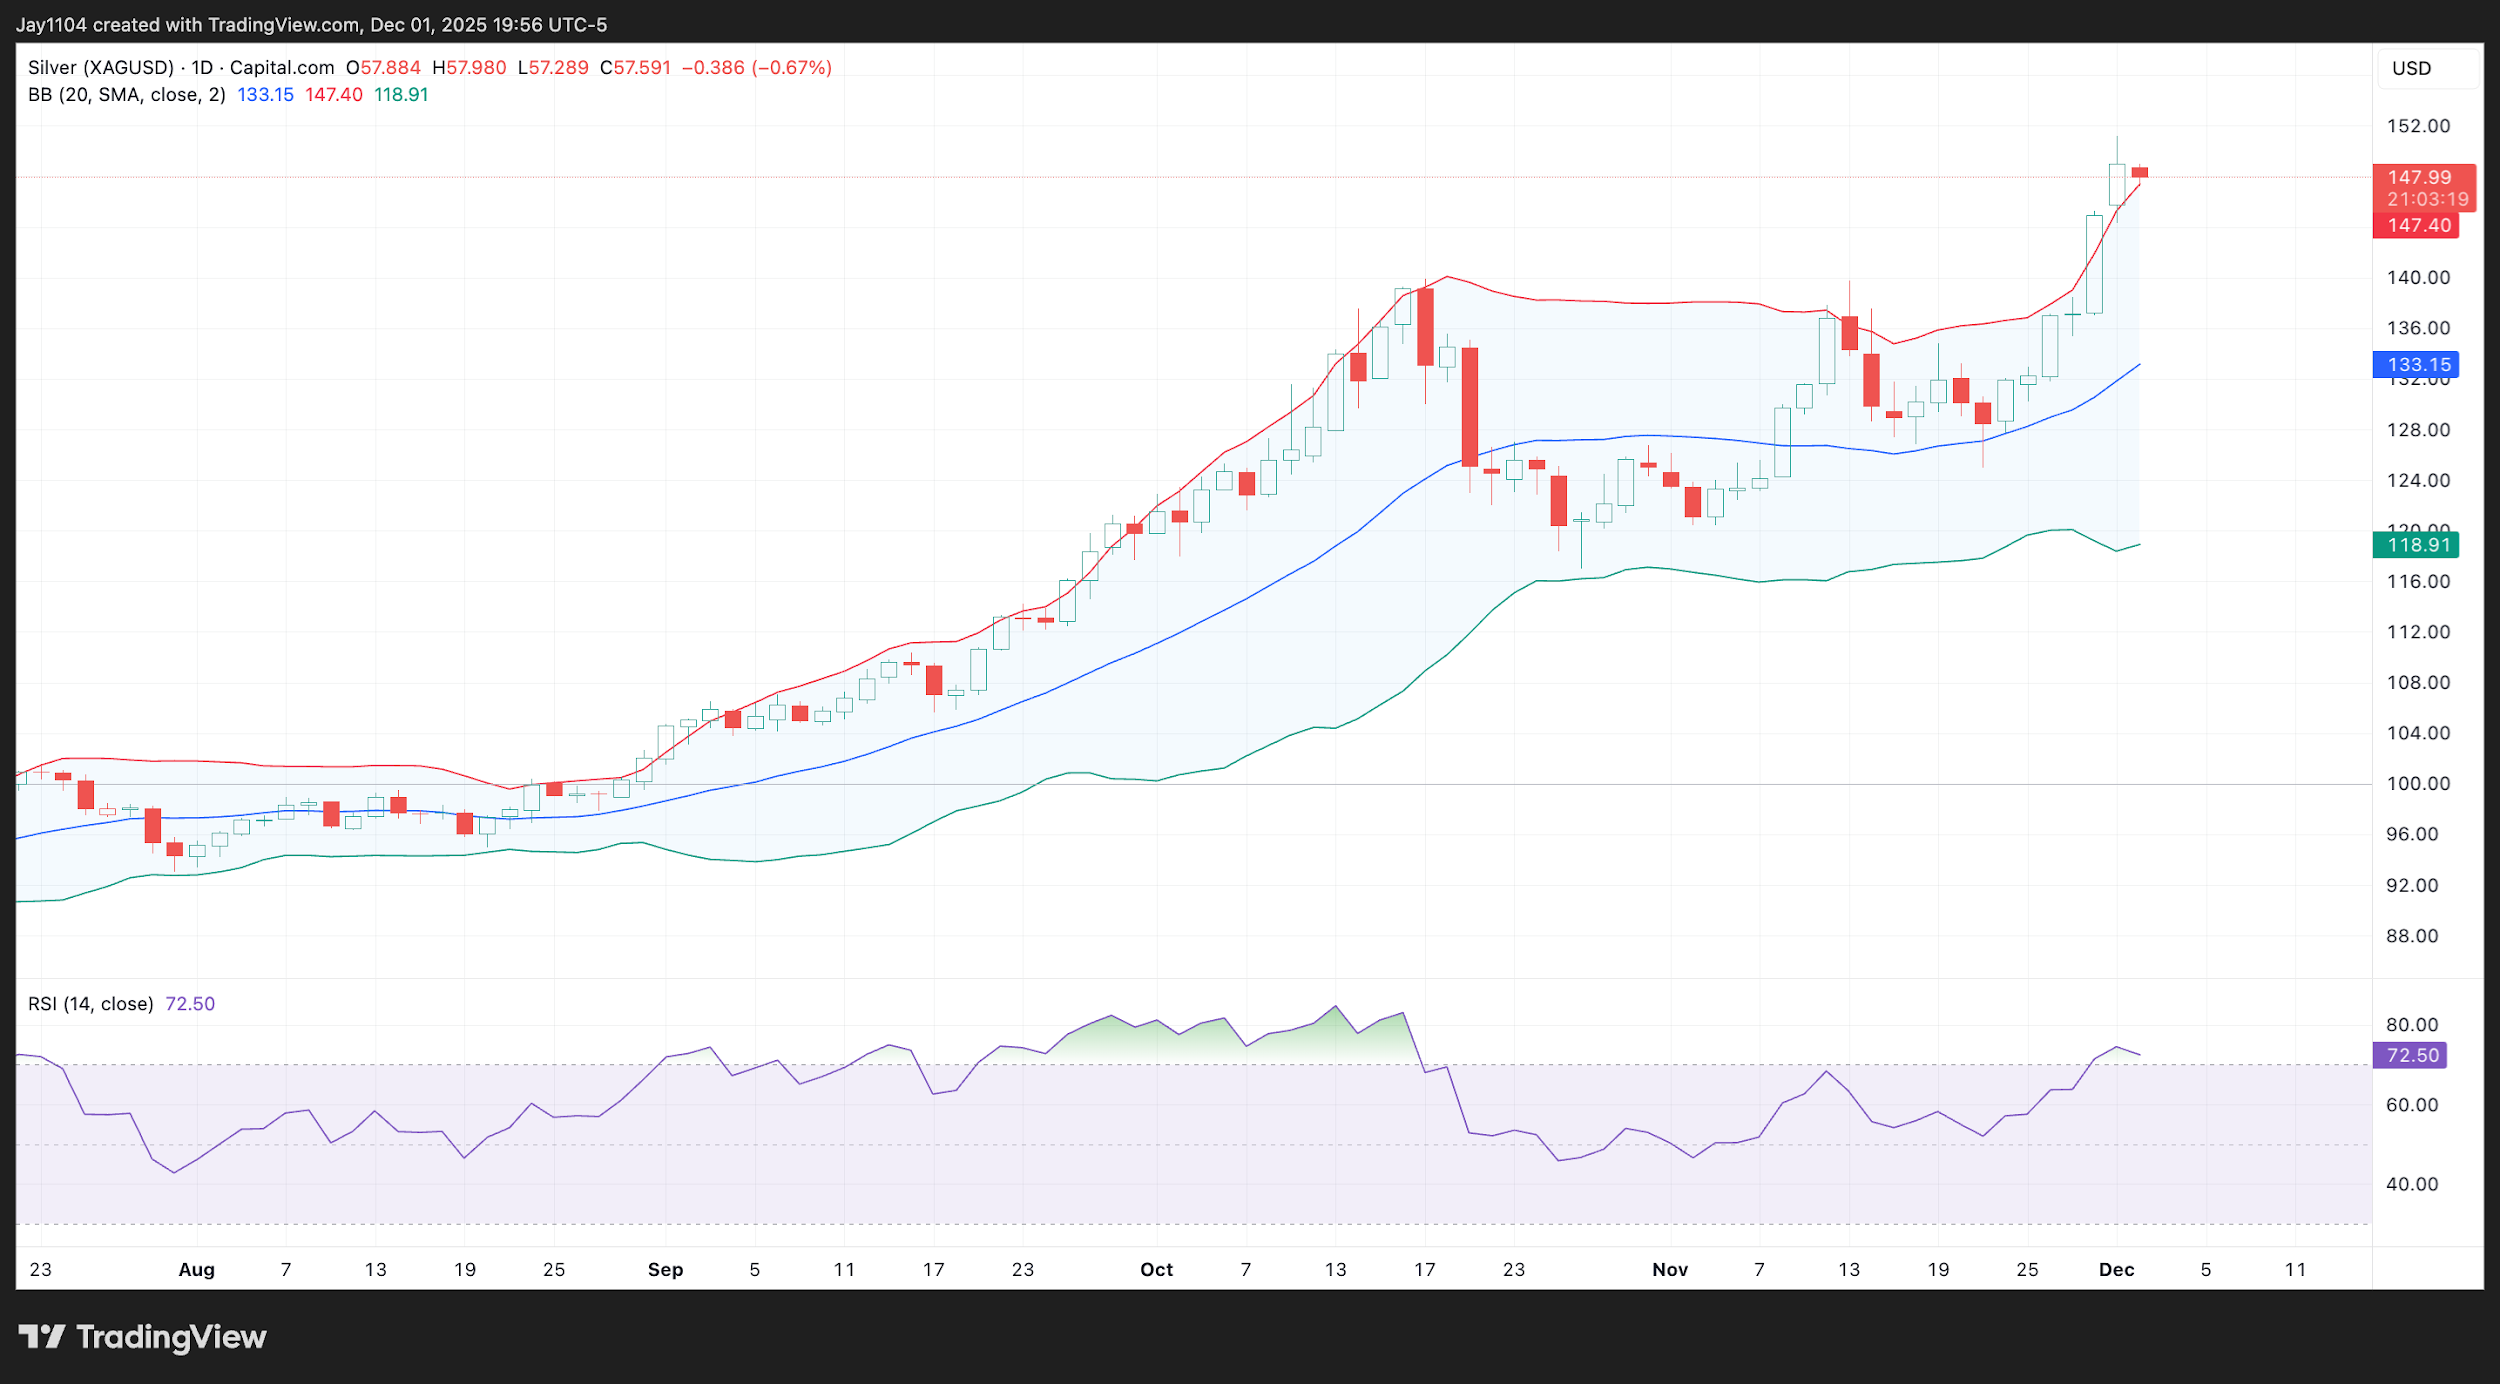
It is easy to argue that silver is extremely overbought on a technical basis, with the metal trading above its upper Bollinger band and its RSI above 70. [CHART2] However, and perhaps more importantly, we are also seeing implied volatility metrics in proxies such as the silver ETF, SLV, reaching very elevated levels, which again points to a potentially risky behaviour scenario. These overbought conditions, coupled with surging implied volatility, appear to create a degree of speculative mania that may currently be unfolding in silver.
(Source: TradingView)
(Past performance is not a reliable indicator of future results)
[CHART2]
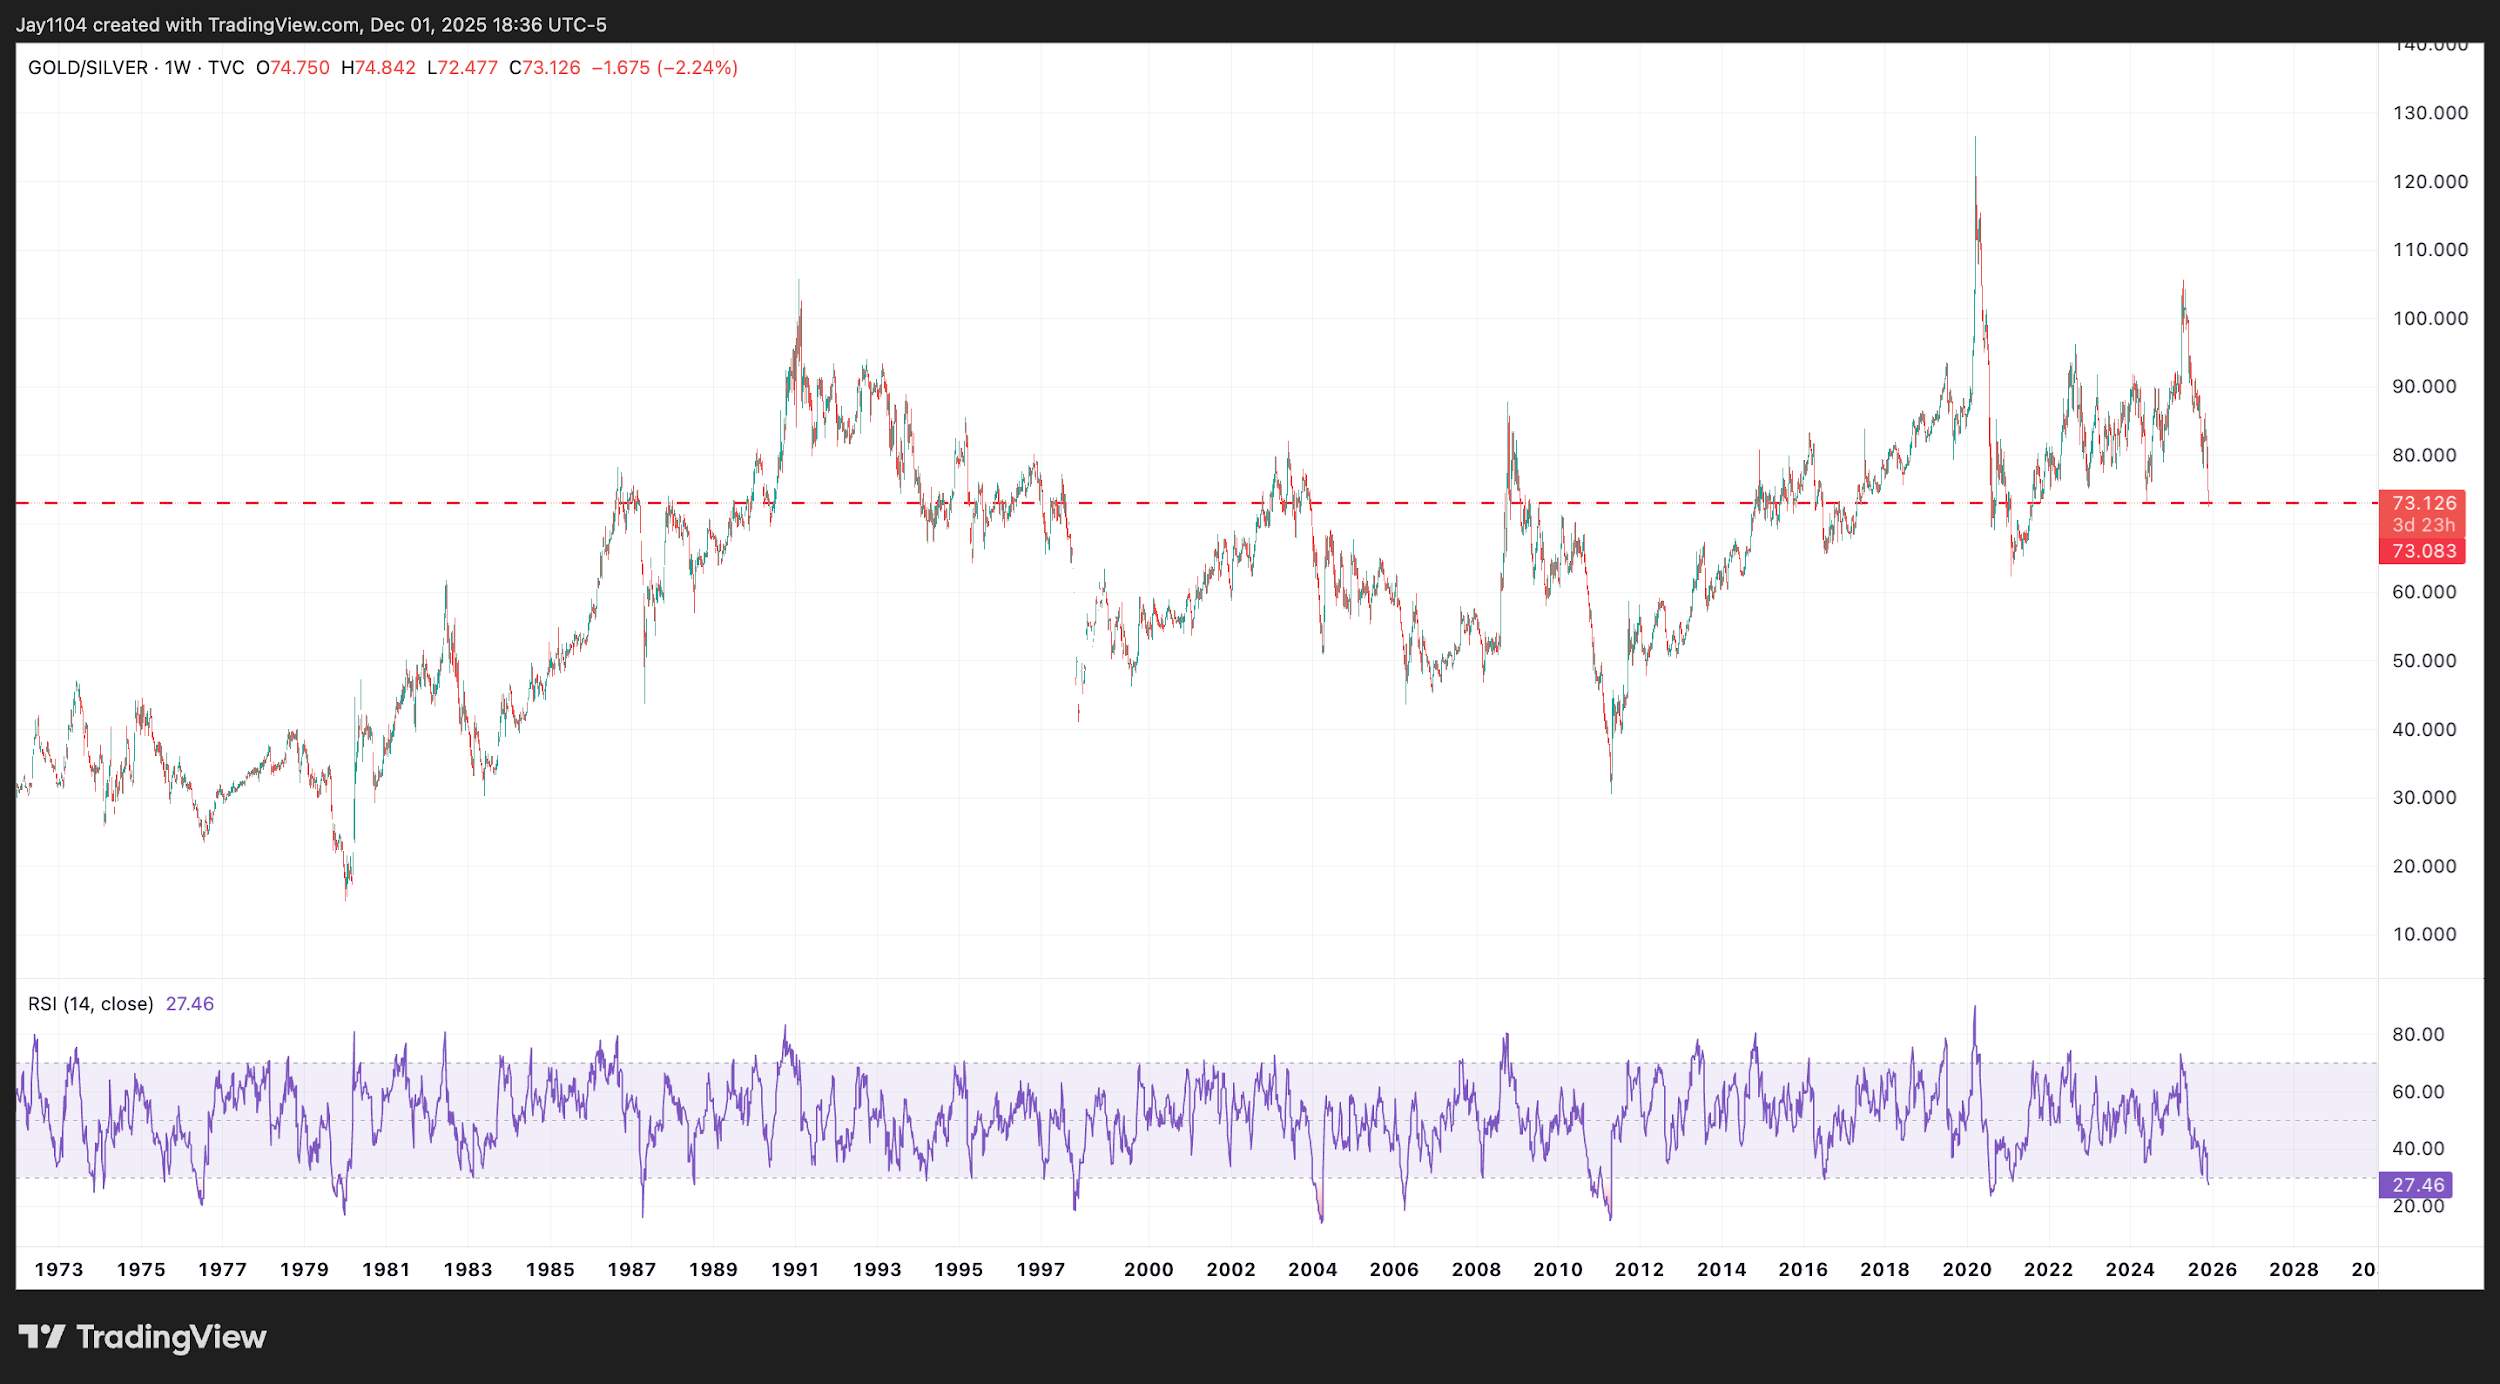
Examining the gold-to-silver ratio, we see that gold broke out relative to silver in spring 2025. Since then, however, silver has risen much more quickly, leaving it looking overvalued relative to gold over the past 10 years. The ratio now stands at 73 to 1, meaning 73 ounces of silver are needed to buy one ounce of gold, compared with more than 100 ounces in the spring. [CHART3] Although silver is no longer cheap relative to gold, the ratio has at least moved back into its long-term historical range, dating to the late 1980s.
(Source: TradingView)
(Past performance is not a reliable indicator of future results)
[CHART3]
Implied Volatility Divergence
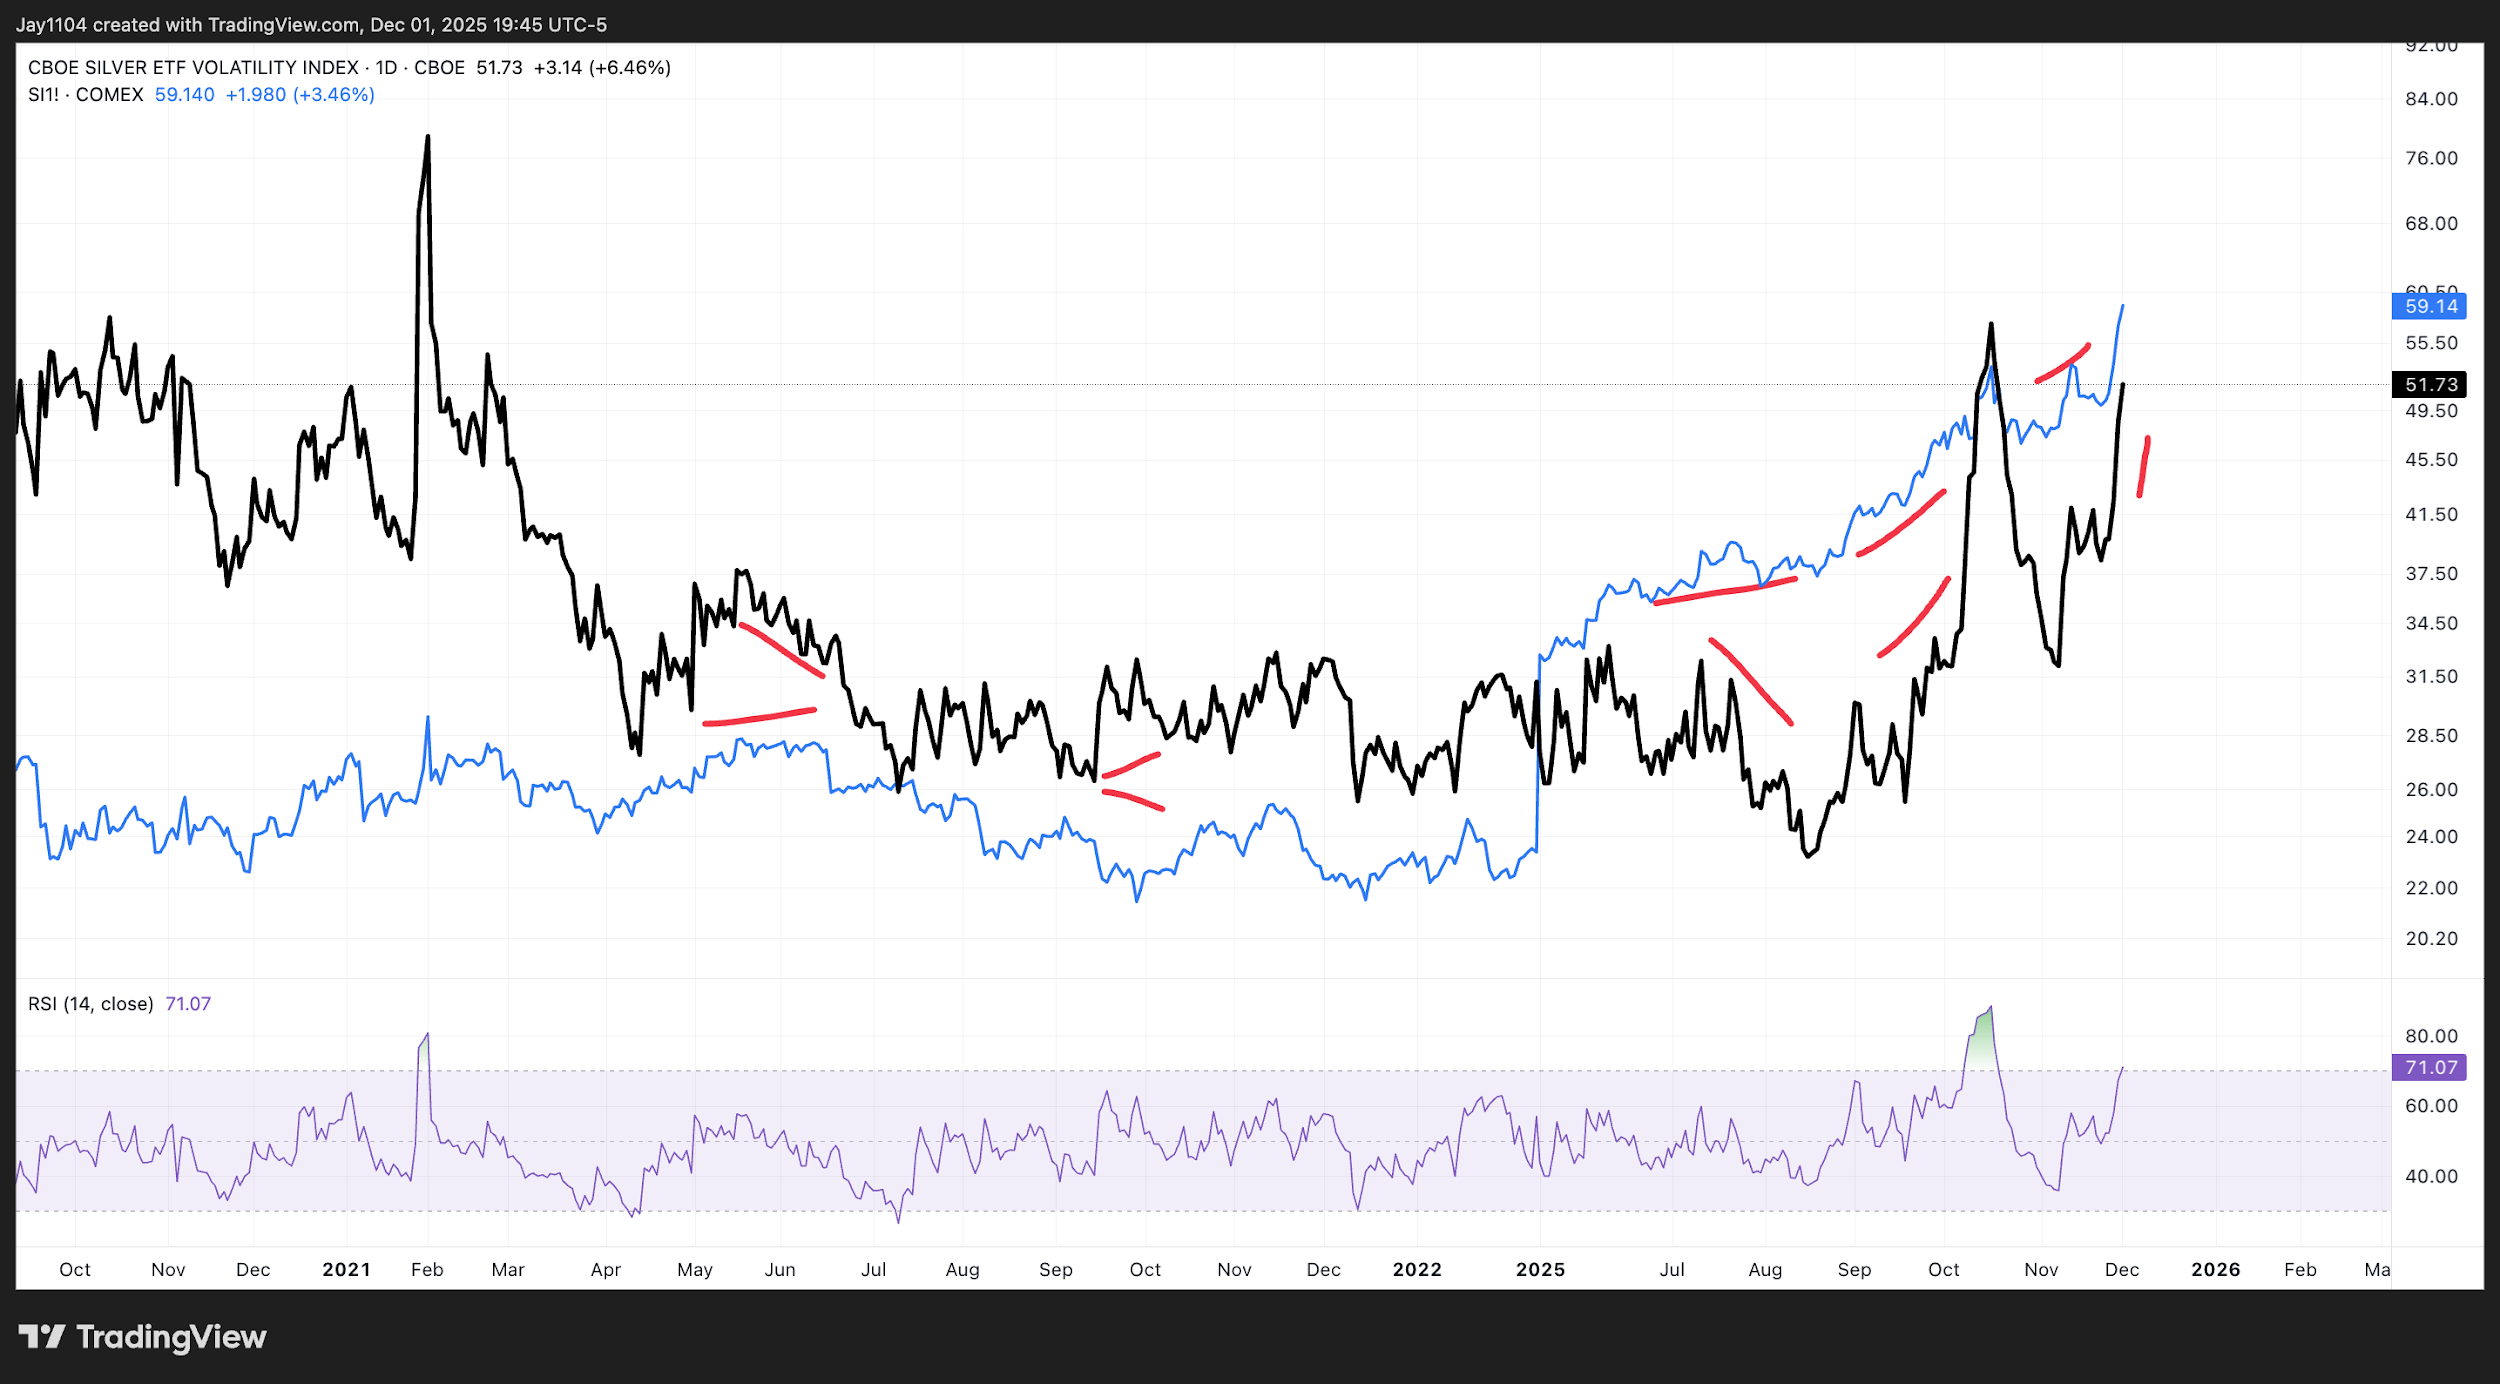
Another notable feature of silver’s recent behaviour is that it is clearly rising alongside implied volatility, as measured by the CBOE Silver ETF Volatility Index (VXSLV). Historically, there has been no clear correlation between silver's price and the implied volatility of the silver ETF. [CHART4] This could be telling us several things. Silver’s recent price action appears driven by speculative activity, with volatility levels resembling those observed during the October spike. While it's unclear whether we are entering a similar phase, traders should remain cautious given the inherent risks and unpredictability in such market conditions.
(Source: TradingView)
(Past performance is not a reliable indicator of future results)
[CHART4]
What is especially notable about the current move is that, although silver has made a new high, implied volatility has not. This may indicate a shift in the market’s underlying dynamics, suggesting that the latest advance does not carry the same level of call-buying demand seen during the previous spike. That, in turn, may say something about the stability of the current market structure. Since the silver ETF closely tracks spot silver over time, it is reasonable to expect VXSLV’s implied volatility to be a reliable proxy for spot silver implied volatility. [CHART5] This makes the divergence all the more striking and may be signalling a change in the character of the move.
 (Source: TradingView)
(Past performance is not a reliable indicator of future results)
[CHART5]
Gold Stalls
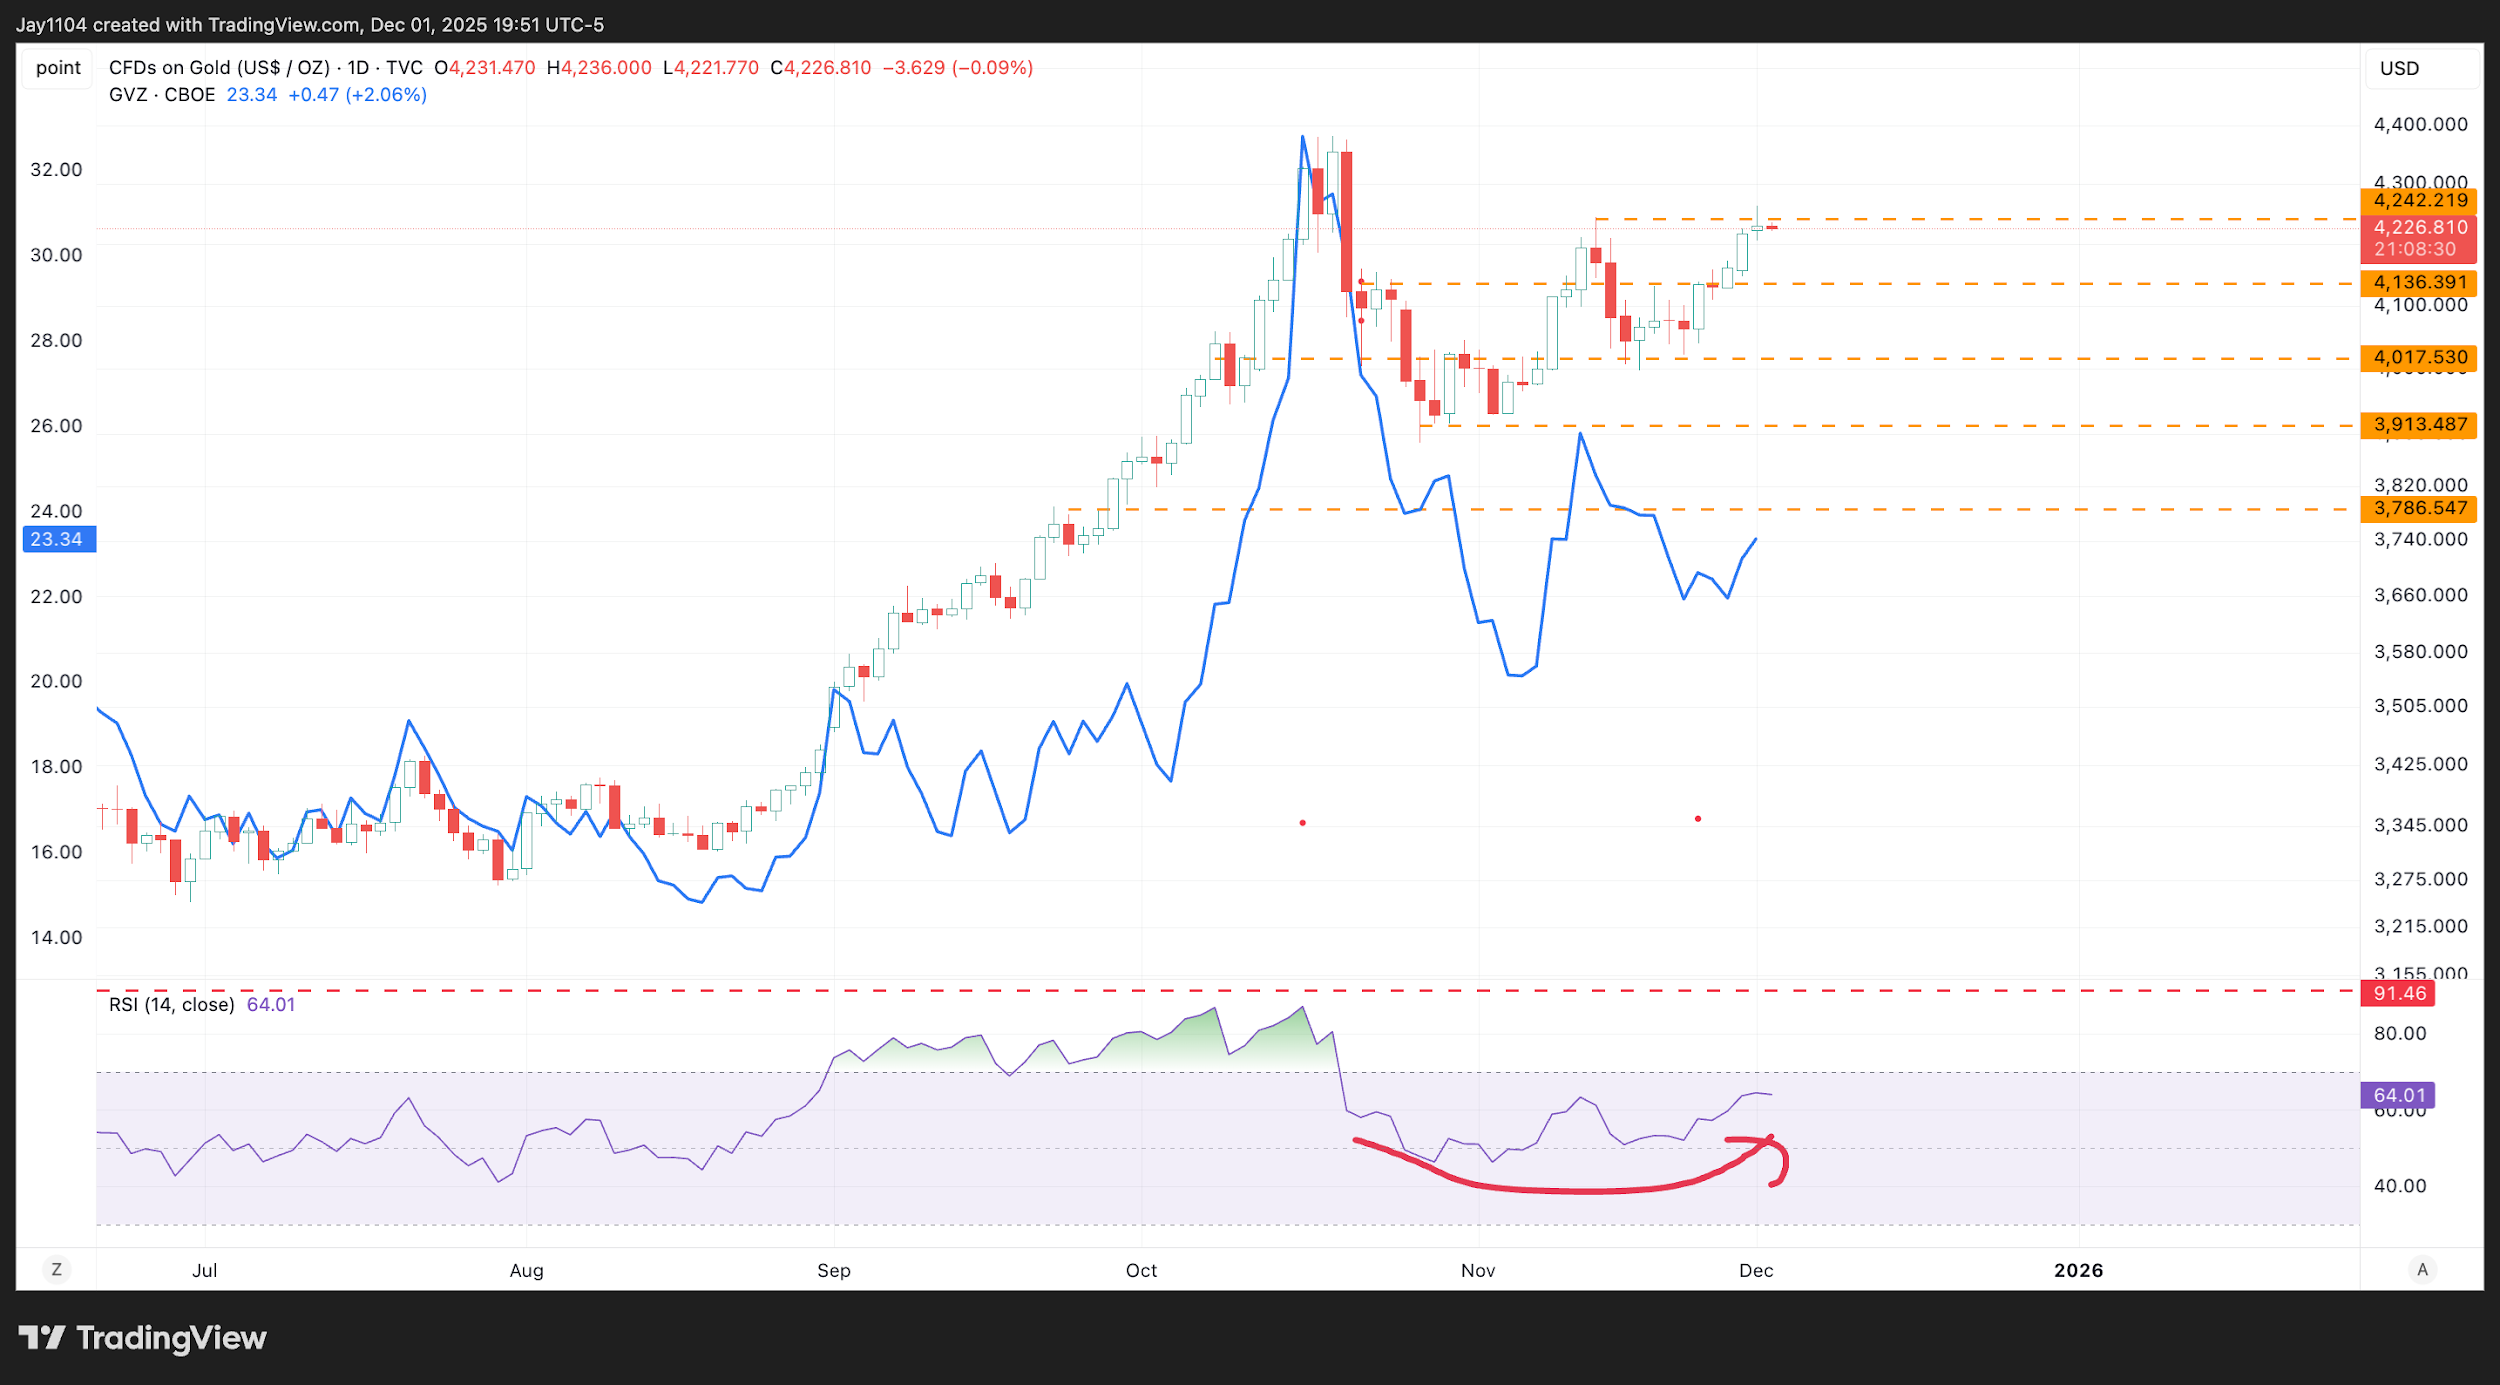
Gold has also failed to confirm silver's recent movements. Gold has been struggling to break above the highs established on 13 November, around the $4,250 region. This is an important area because, if gold can clear it, the metal could take out the prior highs last seen in mid-October and potentially move beyond them, thereby confirming the strength recently observed in silver. However, a failure to break above that level would likely see gold retrace and move back towards the $4,000 area. [CHART6]
It is also worth noting that we have not seen implied volatility in gold make new highs either. Gold’s implied volatility has been forming a series of lower highs even as the price has attempted to move higher. Again, this may signal a lack of enthusiasm or a change in market structure driving current demand dynamics, and could be a warning about the potential future direction of both metals.
(Source: TradingView)
(Past performance is not a reliable indicator of future results)
[CHART6]
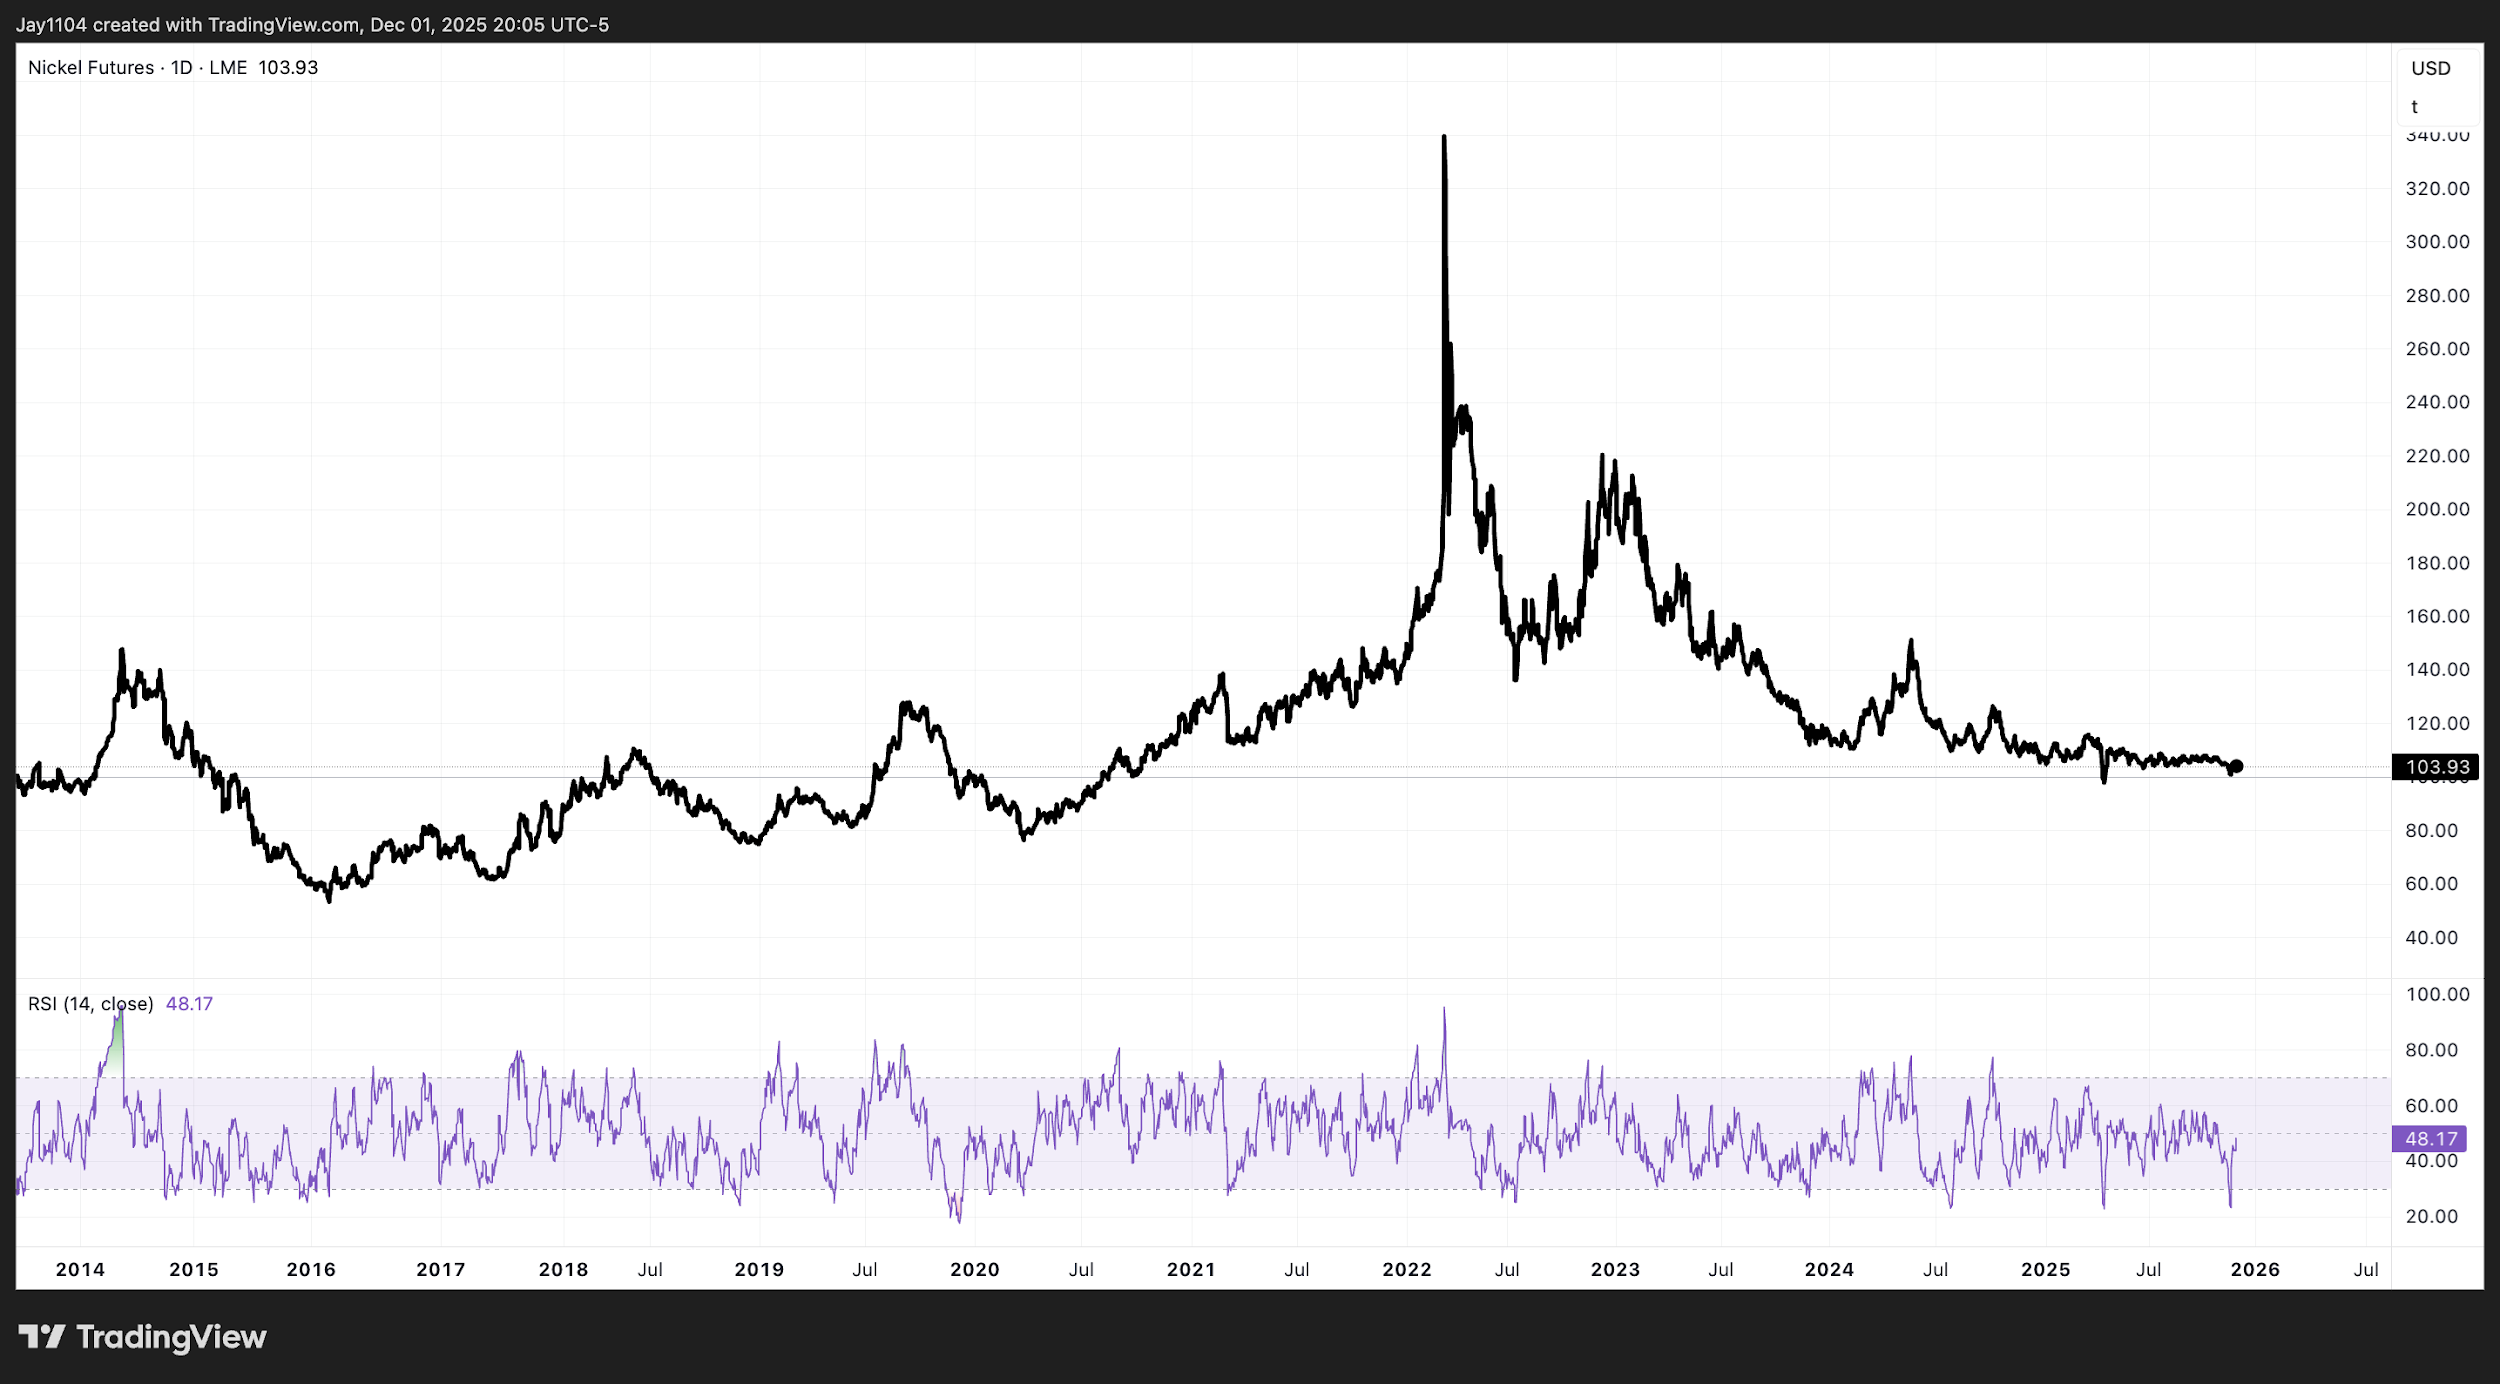
It was not too long ago that we saw something similar in nickel — a move that, in hindsight, proved to be nothing more than a giant short squeeze. There is nothing to say that history is not repeating itself here. [CHART7]
(Source: TradingView)
(Past performance is not a reliable indicator of future results)
[CHART7]