

Copper price forecast: Third-party outlook
Copper is trading near early-July highs after the US confirmed a temporary refined import exemption and a phased 15% tariff from 2027. Explore third-party Copper price targets and technical analysis. Past performance is not a reliable indicator of future results.
Copper (XCU/USD) is trading near $6.29 in early European trading as of 9:30am UTC on 13 July 2026, holding within the day’s $6.23–$6.33 range. Past performance is not a reliable indicator of future results.
Price action continues to reflect the finalised US copper tariff structure. The US Department of Commerce confirmed on 30 July 2025 that refined copper imports would be temporarily exempt, with a phased tariff starting at 15% scheduled for 1 January 2027 (White & Case, 6 August 2025). As traders adjust positioning around that timeline, short-covering and tariff-related trade flows appear to have supported prices more than any tightening in physical supply, with LME inventories reported at eight-year highs (Geomechanics.io, 10 July 2026). Macquarie has noted that the market is not short of copper and expects a 262,000-tonne surplus in 2026, with surpluses above 700,000 tonnes annually in 2027 and 2028 (Mining.com, 9 July 2026). The broader macro backdrop includes a softer US dollar index, which has continued to support dollar-denominated commodities amid ongoing Federal Reserve policy uncertainty (LinkedIn, 5 January 2026).
Third-party US Copper forecast: tariff exemption
As of 13 July 2026, third-party Copper predictions reflect a range of outlooks shaped by tariff policy, supply constraints and shifting Federal Reserve expectations.
Bernstein (broker forecast)
Bernstein sets its 2026 copper price forecast at an average of $12,419 per metric tonne, with second-half prices expected at $11,750 per tonne. This places the call slightly below the wider market consensus of $12,515 per tonne. The bank ties the revision to easing supply tightness alongside shifting Fed policy expectations (Investing.com, 9 July 2026).
Macquarie (house view)
Macquarie lifts its average 2026 copper price forecast to $13,165 per tonne, up from a previous estimate of $12,310 per tonne. The bank attributes the upgrade to price momentum and macro tailwinds that it says have run ahead of underlying physical fundamentals (Mining.com, 8 July 2026).
Tacto (market data view)
Tacto notes LME cash copper at $13,298.50 per tonne, around 4.5% below the early-June level, with a risk-scenario ceiling near $14,000–$15,500 per tonne. It flags the removal of a Strait of Hormuz risk premium and evolving tariff dynamics as the key swing factors behind the pullback (Tacto.ai, 5 July 2026).
Copper Weekly Brief (LME/Westmetall data roundup)
The weekly note cites LME official copper prices around $13,307–$13,360 per tonne and Westmetall cash data near $13,090–$13,169 per tonne across the first full week of July. It also flags UBS market commentary pointing to copper reaching around $14,000 per tonne by September 2026 and potentially $14,500 per tonne by year-end if supply constraints persist (LinkedIn, 9 July 2026).
Predictions and third-party forecasts are inherently uncertain, as they cannot fully account for unexpected market developments. Past performance is not a reliable indicator of future results.
Copper spot: recent and upcoming market developments
Copper spot (XCU) is consolidating near recent highs as of 9:30am UTC on 13 July 2026, with US benchmarks trading at a premium to London Metal Exchange (LME) levels amid regional tightness (Westmetall, 10 July 2026).
LME cash copper stood at $13,408.50 per tonne on 10 July 2026, while three-month copper settled at $13,454. LME stocks were 306,500 tonnes, down from 324,850 tonnes at the start of the month, signalling continued warehouse drawdowns (Westmetall, 10 July 2026).
A weekly market note said copper held near historically high levels in the second week of July, but remained in consolidation rather than extending the sharper rally seen earlier in 2026. It also noted that major research houses broadly viewed refined copper fundamentals as constrained into year-end, though estimates varied on the size of any deficit or surplus (LinkedIn, 10 July 2026).
Policy remains a key watchpoint. The US tariff framework finalised on 30 June 2026 temporarily exempted refined copper imports, with phased tariffs scheduled from 2027 (TradingKey, 26 June 2026). Supply-side pressures, including underutilised output at major mines, are also shaping the physical market (J.P. Morgan Global Research, 24 April 2026), while China's restrictions on sulphuric acid exports, an input used in copper smelting, add a further constraint on refined supply (IFC Horgan Galbraith's, 21 May 2026).
From a technical analysis perspective, Reuters identified a bull pennant on the daily copper futures chart after futures peaked at $6.72 per pound on 13 May 2026, before entering a more subdued consolidation phase (Reuters, 22 June 2026).
Past performance is not a reliable indicator of future results.
Copper futures: technical overview
Copper spot trades near $6.29 as of 9:30am UTC, while Copper futures hold above their 20-, 50-, 100- and 200-day simple moving averages at roughly $6.26, $6.30, $6.06 and $5.73, according to TradingView data. This places price within a tight band around the shorter moving averages while sitting well clear of the 100- and 200-day levels, keeping the broader trend constructive without suggesting an overextended move either way.
Momentum sits in upper-neutral territory, with the 14-day relative strength index around 50.70, while the 14-day average directional index reads near 12.40, pointing to a weak trend by conventional readings, according to TradingView data. The stochastic %K near 72.50 suggests some short-term firmness, though this remains a single reading rather than a directional signal.
On the upside, the nearest classic pivot resistance sits at $6.66. A daily close above that level would put the next classic pivot, near $7.07, back in view, according to TradingView pivot data. Beyond that, the Hull moving average and volume-weighted moving average both sit near $6.26, offering additional short-term references traders may watch alongside price action.
On the downside, the classic pivot point near $6.29 marks initial support, according to TradingView data. Below that, the 100-day simple moving average near $6.06 stands as the closest longer-term level. A move below this level could point to a deeper move toward the classic S1 support near $5.89, according to TradingView (TradingView, 13 July 2026).
This is technical analysis for informational purposes only and does not constitute financial advice or a recommendation to buy or sell any instrument.
Copper price history (2024–2026)
Two years ago, on 14 July 2024, the Copper spot price traded around $4.57, having spent much of that summer consolidating in the low-$4 range. Prices drifted lower into early 2025, dipping to a two-year low of $4.11 on 8 April 2025 as broader risk sentiment weakened, before staging a steady climb through the year.
The largest single-session move came on 30 July 2025, when copper rose sharply from around $4.69 to an intraday high of $5.82, a jump often linked to the announcement of US tariffs on copper imports that month. Copper closed 2025 at $5.72, roughly 42% higher than where it started the year.
The upward move continued into 2026, with copper climbing steadily to a new high of $6.73 on 3 June 2026, before easing back through late June as the rally paused. Copper closed at $6.29 on 13 July 2026, up around 10% year to date and roughly 12% higher year on year.

Past performance is not a reliable indicator of future results. Prices are indicative and may differ from live market prices.
Copper price outlook: Capital.com analysis
Copper’s price performance through the first half of 2026 was strong, with the metal breaking above multi-year highs before settling into a period of consolidation. The rally reflected a combination of factors, including tight refined supply, resilient demand tied to electrification and grid infrastructure, and shifting expectations around US tariff policy on copper imports. However, this supportive backdrop sits alongside a more cautious counter-view: several forecasters have said prices may have run ahead of physical fundamentals, with some pointing to potential surpluses later in 2026 as new mine and scrap supply comes online.
The tariff exemption for refined copper imports, confirmed at the end of June 2026, removed one source of near-term uncertainty, though a phased tariff structure due in 2027 could reintroduce volatility as that timeline approaches. At the same time, softer-than-expected industrial activity or a stronger US dollar could weigh on prices, offsetting some of the structural demand narrative. Copper’s dual role as an industrial input and a macro-sensitive asset means its price can respond to both supply-side developments and broader shifts in risk appetite, making it useful to consider multiple drivers rather than a single theme. Past performance is not a reliable indicator of future results.
Capital.com’s client sentiment for Copper CFDs
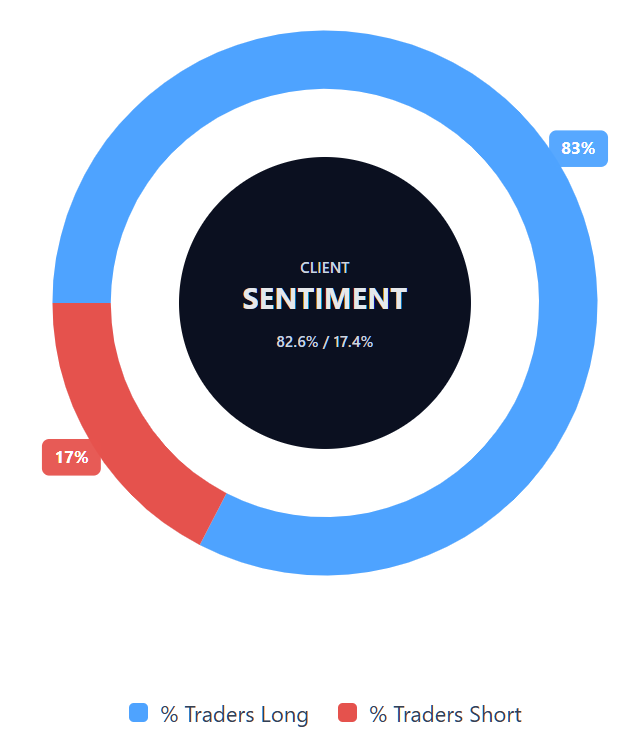
As of 13 July 2026, Capital.com client positioning in Copper spot CFDs shows 82.6% long vs 17.4% short, putting long positions ahead by 65.26 percentage points and keeping positioning firmly weighted towards longs. This snapshot reflects open positions on Capital.com and can change.
Summary – Copper price 2026
- As of 10:30 UTC on 13 July 2026, copper spot traded near $6.29, up from around $4.57 two years earlier and near June 2026 highs.
- Technicals show price holding above key moving averages, with RSI near neutral and an ADX reading pointing to a weak short-term trend.
- Key drivers include US tariff policy timing, tight refined supply, demand from electrification and grid infrastructure, and US dollar movements.
- Recent news centres on the finalised US tariff exemption for refined copper, mixed analyst price targets, and consolidation near record LME levels.
Past performance is not a reliable indicator of future results.
FAQ
What is the copper price forecast?
Analyst copper price forecasts for 2026 vary, reflecting different views on tariff policy, supply conditions, Federal Reserve expectations and US dollar movements. The article cites tonne-based targets broadly clustering between $12,000 and $14,500 per tonne, with some sources seeing further support if supply constraints persist. However, other forecasters note that prices may have run ahead of physical fundamentals, especially if new mine or scrap supply increases.
Could copper’s price go up or down?
Copper’s price could move in either direction, depending on how key drivers develop. Further support could come from tight refined supply, resilient demand linked to electrification and grid infrastructure, or a softer US dollar. Downside risks include weaker industrial activity, a stronger US dollar, easing supply constraints or tariff-related uncertainty fading. Copper is also sensitive to macro sentiment, so price moves can reflect both physical market conditions and broader risk appetite.
Should I invest in copper?
Whether copper is suitable depends on your financial goals, risk tolerance, market knowledge and preferred way to gain exposure. This article is for informational purposes only and doesn’t constitute investment advice. Copper can be volatile, and CFD trading adds further risk because leverage can magnify both profits and losses. Before making any trading decision, consider your own circumstances, carry out independent research and make sure you understand how the product works.
Can I trade copper CFDs on Capital.com?
Yes, you can trade Copper CFDs on Capital.com. Trading commodity CFDs lets you speculate on price movements without owning the underlying asset and to take long or short positions. However, contracts for difference (CFDs) are traded on margin, and leverage amplifies both profits and losses. You should ensure you understand how CFD trading works, assess your risk tolerance, and recognise that losses can occur quickly.