
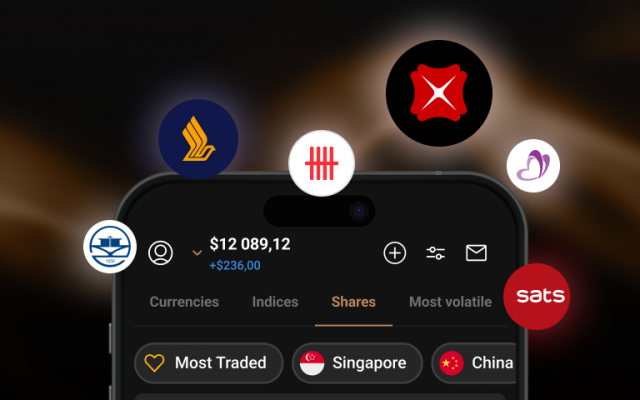
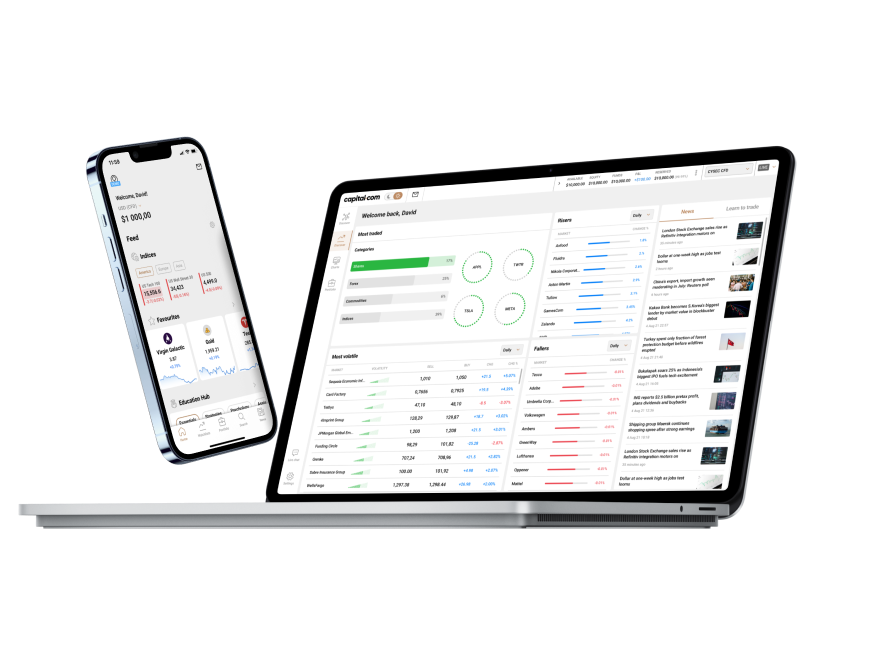
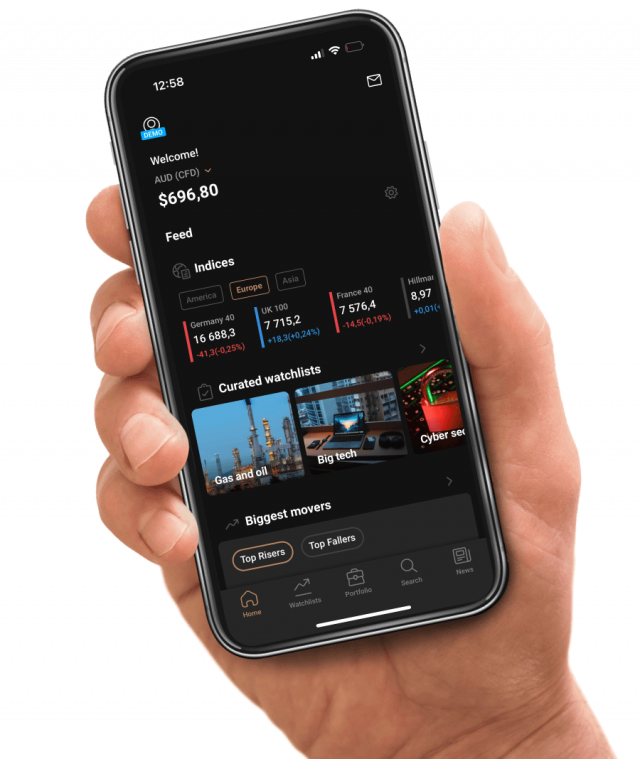
即刻交易,畅享全球市场
对黄金、香港50、USD/JPY 等多种资产进行差价合约 (CFD) 交易。开户便捷高效,$20美金即可交易。
本平台由巴哈马证券委员会 (SCB) 授权并监管
对黄金、香港50、USD/JPY 等多种资产进行差价合约 (CFD) 交易。开户便捷高效,$20美金即可交易。
本平台由巴哈马证券委员会 (SCB) 授权并监管

展示我们的 4 星和 5 星好评。为遵守 GDPR 要求并保护用户隐私,用户的具体信息已被匿名处理
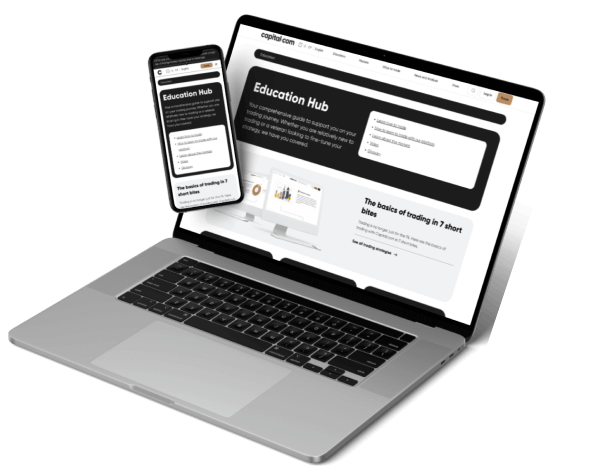
全面且完善的服务、专业工具与优质资源,助您持续提升交易技能。
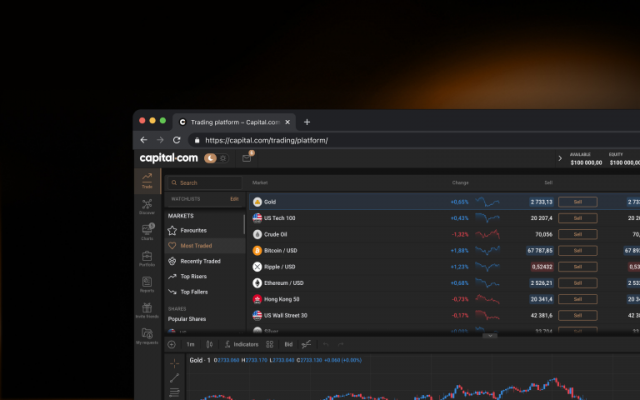
利用 100+ 种技术指标、直观图表和绘图工具,助力市场分析。
在精选市场以低保证金掌控更大交易头寸。杠杆不仅能提升盈利潜力,也会加大亏损风险。可能存在杠杆限制
我们的专业团队提供全天候支持服务,随时为您答疑解惑
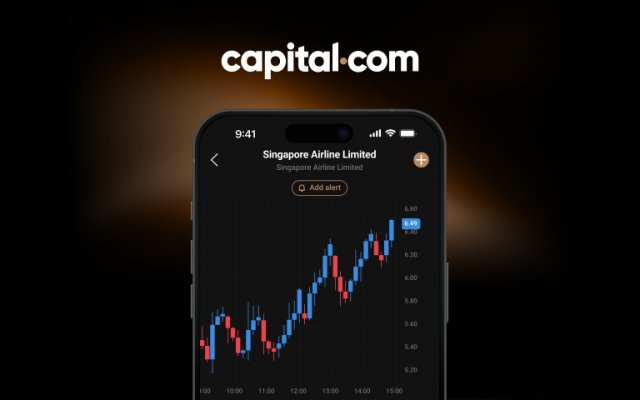
时刻关注您最爱资产的价格走势,把握市场机遇,优化交易策略
根据我们 2024 年的内部服务器数据,99% 的提款请求在 24 小时内处理完毕。
选择 Capital.com,开启您的交易之旅。
零风险体验交易,轻松积累实战经验。
享受专业且友好的全天候客户支持服务。
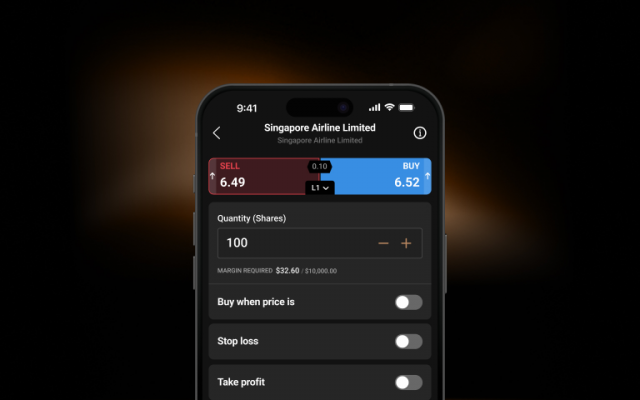
灵活设置交易规模,优化资金管理,稳健掌控风险。
使用止损单1在市场走势对您不利时及时止损。
1止损可能无法保证执行