Crypto chart patterns: How to use them in your trading strategy
Learn how to spot crypto chart patterns and use them in your CFD trading – with classic BTC, ETH, SOL, and AVAX examples, and more.
What are crypto chart patterns?
Crypto chart patterns are shapes or formations that appear on price charts as a result of cryptocurrency price movements over time. These patterns can form on any timeframe, from five-minute charts to longer-term daily or weekly views.
As a crypto trader, you might use crypto trading chart patterns to gauge market conditions and identify where a price trend might continue, reverse, or consolidate.
It’s important to note that crypto chart patterns can provide valuable insights, but they cannot predict the future – past performance doesn’t guarantee future results.
How do crypto trading chart patterns work?
Crypto trading chart patterns form as price movements create recurring shapes or formations on a candlestick chart. These patterns can appear across a range of timeframes, from intraday to multi-week charts. They reflect collective buying and selling behaviour, which could indicate shifts in sentiment, supply and demand, or broader market trends.
Contracts for difference (CFD) traders use chart patterns within broader crypto trading strategies – alongside other forms of analysis, such as technical indicators, to build a more complete view of the market. You can analyse crypto trading chart patterns using platforms such as TradingView, applying them across different timeframes depending on your strategy.
What are the types of crypto trading chart patterns?
Crypto trading chart patterns are widely organised into three groups: continuation patterns, reversal patterns, and bilateral patterns.
Continuation patterns
Continuation patterns suggest that the current trend is likely to resume after a brief period of consolidation or pause. In crypto markets, these may occur during strong directional moves, potentially supported by rising volume during the breakout.
Here are some common continuation patterns:
-
Flags: small rectangles formed by parallel trendlines, typically sloping against the prevailing trend, signalling a brief consolidation before the trend continues.
-
Pennants: small, converging formations that develop after a sudden move, with price usually expected to break out in the same direction.
-
Ascending/descending triangles: flat-topped or flat-bottomed triangles that often signal a breakout will follow in the direction of the existing trend, though they may occasionally mark a reversal.
Reversal patterns
Reversal patterns point to a possible change in the current trend. These formations often develop after an extended move up or down, providing an early indication that sentiment may be shifting.
Patterns include:
-
Head and shoulders / inverse head and shoulders: three-peak patterns suggesting a trend reversal, either from bullish to bearish or vice versa.
-
Double top / double bottom: patterns that look like the letter ‘M’ (double top) or ‘W’ (double bottom), often seen near market turning points.
Bilateral patterns
Bilateral crypto trading patterns are less directional and typically form during periods of indecision or consolidation. These formations indicate that a significant move is likely, but don’t predict which way the breakout will occur. In fast-moving crypto markets, they can appear during periods of high volatility.
Common bilateral patterns include:
-
Symmetrical triangles: price converges within two trendlines, with breakout potential in either direction.
-
Wedges: sloping, narrowing price action that may resolve as a reversal or continuation, depending on overall market momentum.
Identifying which type of pattern is forming can help traders prepare for different scenarios, but no pattern is infallible. Crypto price action is highly reactive, and patterns should be considered as part of a broader trading approach.
What are some examples of classic crypto chart patterns?
Chart patterns may appear across cryptocurrency markets, from BTC to altcoins. While these formations are not exclusive to digital assets, the high volatility and round-the-clock trading in crypto can make their appearance seem more pronounced – and sometimes more visually distinct – than in traditional markets.
Let’s look at a few classic examples you’ll often see on charts for crypto, like Bitcoin (BTC) and Ethereum (ETH):
Head and shoulders
Head and shoulders is a well-known reversal pattern. It typically signals a shift from bullish to bearish momentum. The pattern is formed by three peaks: a higher middle peak (the ‘head’) between two lower peaks (the ‘shoulders’). The ‘neckline’ connects the troughs between the peaks and acts as a support level.
A break below the neckline with increased trading activity is traditionally seen as confirmation, though volume signals can be less consistent in crypto.
The inverse head and shoulders pattern is the opposite, indicating a possible transition from bearish to bullish. Here, the chart displays three troughs, with the middle one being the lowest. A break above the neckline can signal the start of an uptrend.
ETH head and shoulders example
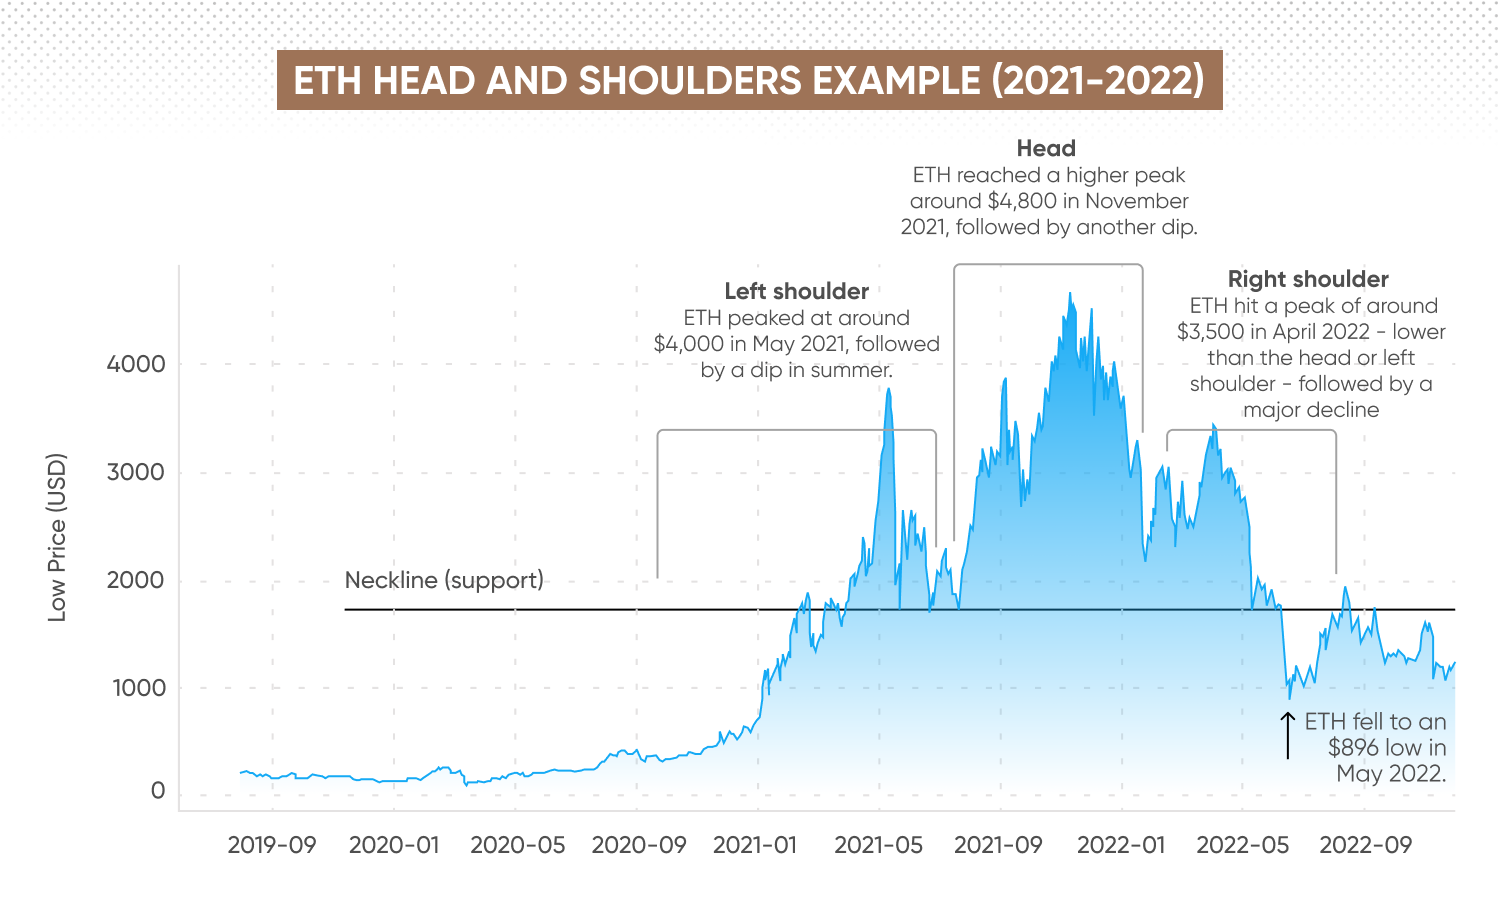
In 2021-2022, Ethereum (ETH)’s daily chart completed a multi-year head and shoulders pattern, with a price decline after neckline breakdown.
ETH’s head and shoulders pattern developed as follows:
-
Left shoulder – formed in early 2021, with price highs near $4,000 in May.
-
Head – created in late-2021, peaking at approximately $4,800 in November.
-
Right shoulder – took shape from early-mid 2022 into mid 2025, with lows similar to the left shoulder around $3,500-$3,600.
-
Neckline – clearly defined by support in the $1,750-$1,850 zone, tested multiple times through 2021 and 2022.
-
Breakdown – a confirmed break below $1,800 with strong volume appeared to validate the pattern, projecting a potential price target near $20,000 over the long term.
Double top and double bottom
Double top and double bottom patterns signal potential reversals at market highs or lows. These patterns can be observed on intraday as well as daily charts.
A double top can form when price tests the same resistance level twice before reversing lower, creating an ‘M’ shape. Conversely, a double bottom appears as a ‘W’, with price rebounding twice from a support level.
SOL double bottom example
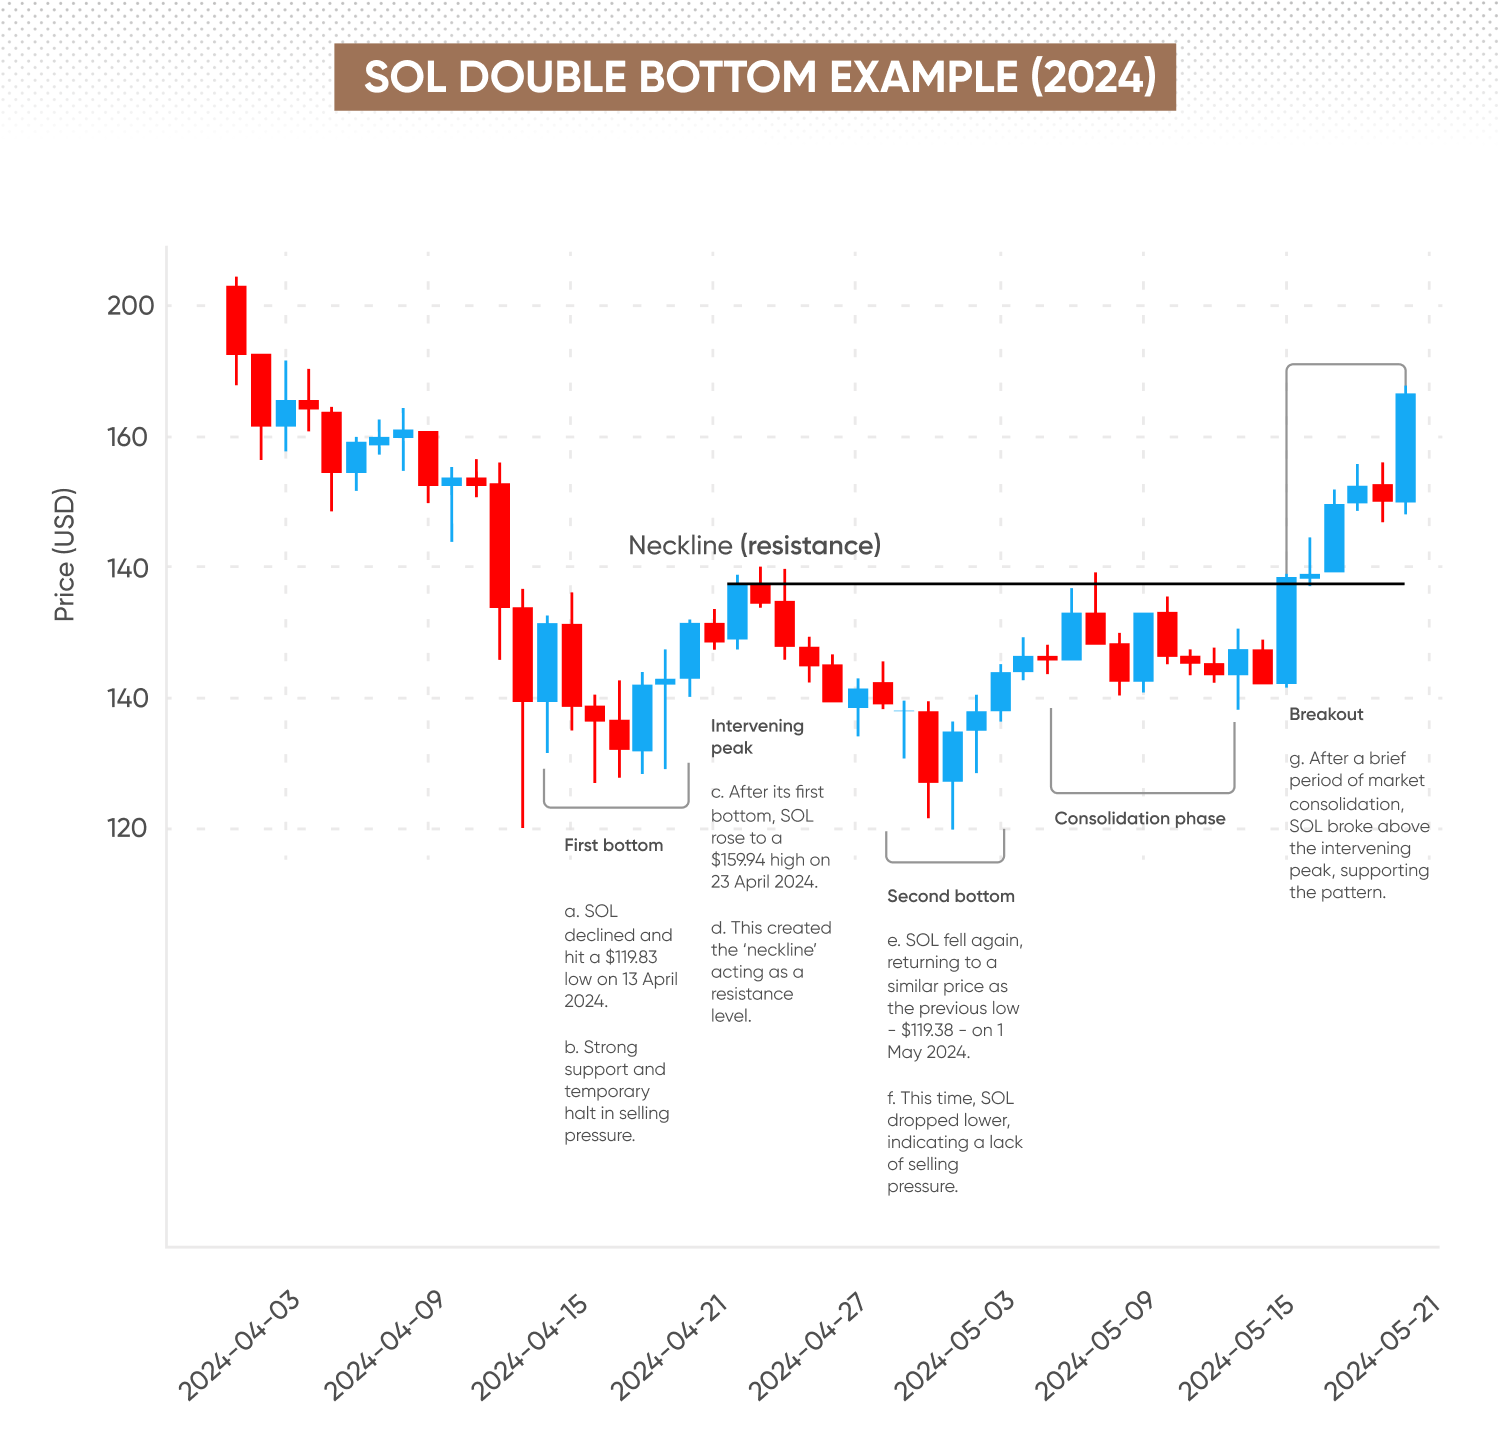
In April-May 2024, Solana (SOL)’s chart formed a double bottom pattern, which occurred in the following sequence:
-
First bottom – formed in mid-April 2024, with SOL dipping to a $119.83 low.
-
Intervening peak – brief rally to $159.94 by late-April.
-
Second bottom – retested support near $119.38 in early May.
-
Breakout – SOL surged above $160 resistance in mid-late May, confirming the double bottom before continuing higher through the month.
Triangles
Triangles are consolidation patterns that often appear during periods of uncertainty. They can be:
-
Ascending triangle – flat top, rising lows – typically bullish.
-
Descending triangle – flat bottom, falling highs – usually bearish.
-
Symmetrical triangle – converging trendlines – breakout can go either way.
XRP symmetrical triangle example
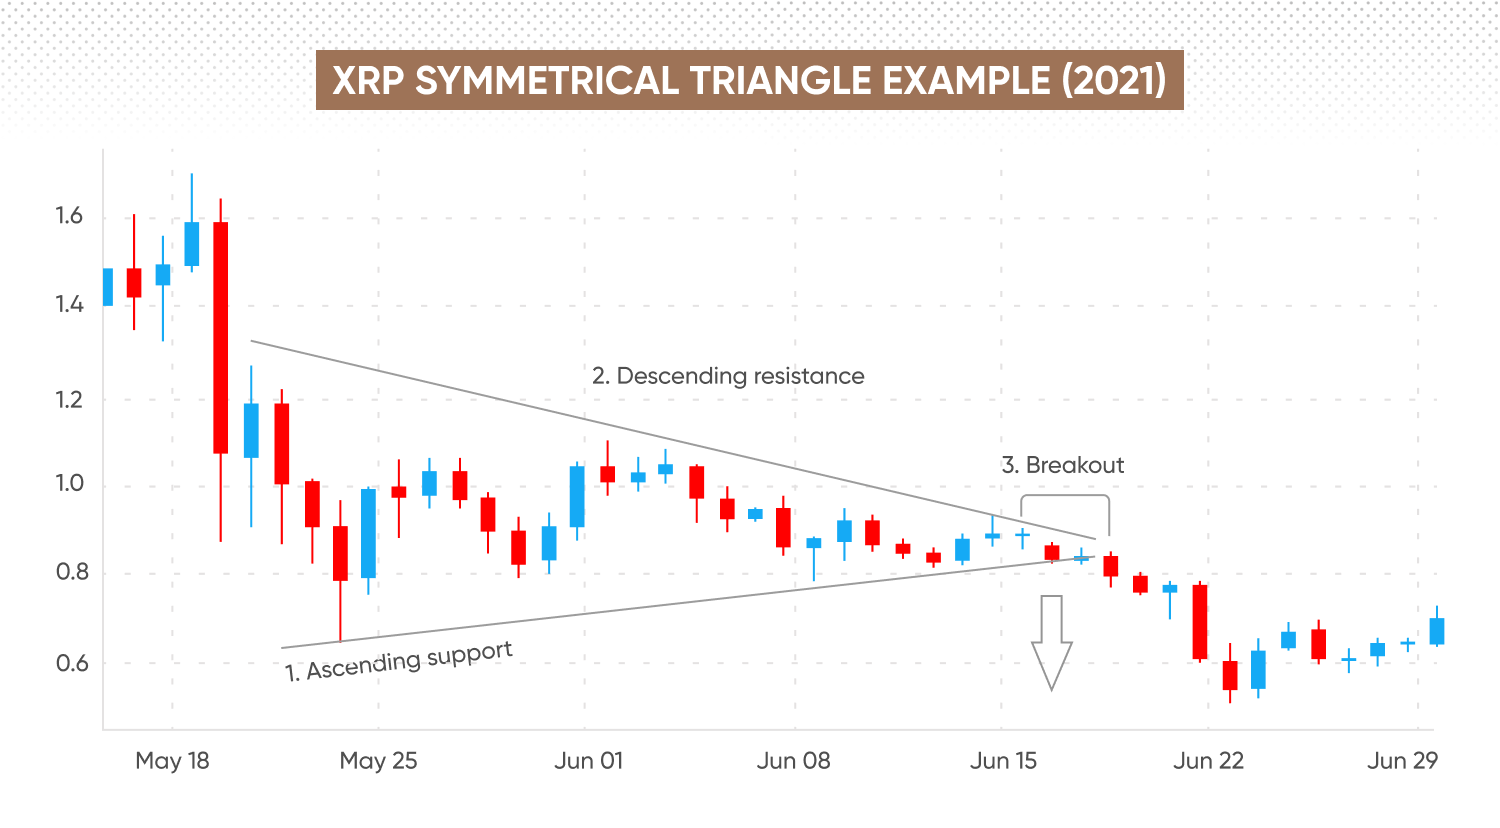
XRP’s price action between 16 May and 12 June 2021 exhibited characteristics of a symmetrical triangle, indicating contracting volatility and building pressure between converging trendlines.
-
Triangle base (support) – higher lows were established at $0.65 on 23 May 2021, $0.76 on 24 May, $0.80 on 30 May, and $0.84 on 11 June.
-
Descending resistance – lower highs formed at $1.61 on 16 May, $1.08 on 3 June, and $0.95 on 6 June.
-
Apex – by 11-12 June, XRP’s price compressed tightly between $0.84 and $0.83, converging toward the triangle’s apex.
-
Breakout/breakdown – a decisive move above or below $0.83 may have signaled the next directional trend, with the actual outcome being a breakdown around 16 June.
Flags and pennants
Flags and pennants follow strong price moves, forming brief consolidation zones before the trend resumes. Flags appear as small rectangles, while pennants are small, symmetrical triangles. Both indicate a pause before continuation.
AVAX bullish flag example
A textbook bullish flag appeared on AVAX’s chart in December 2021, marking a period of strong upward momentum continuation.
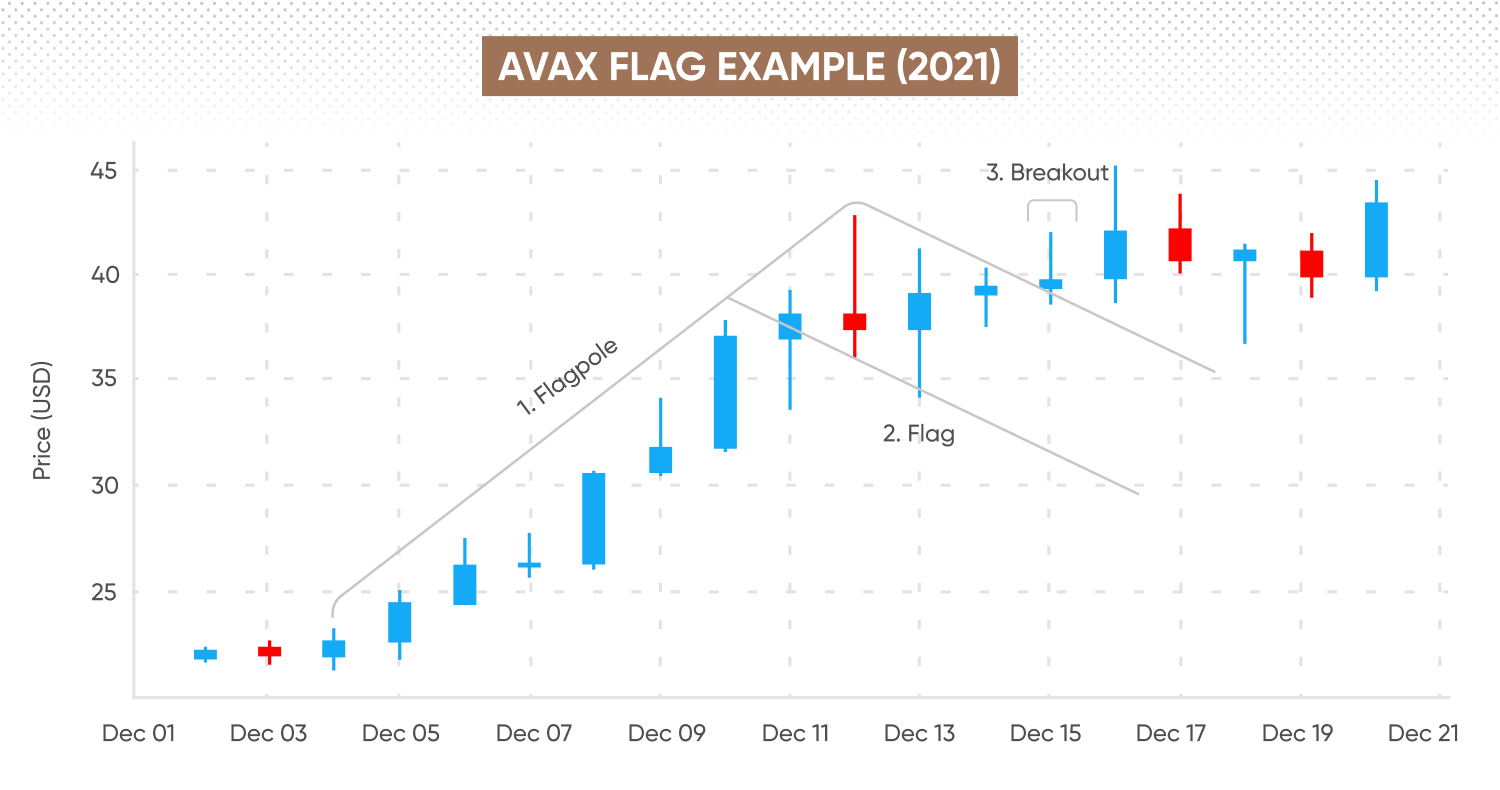
-
Flagpole – AVAX rose substantially between 4 December and 12 December 2021.
-
Flag – from 12 December to 14 December, the price consolidated in a tight range, forming a textbook bullish flag just beneath new highs.
-
Breakout – on 15 December, AVAX broke out above the consolidation, and confirmed the bullish continuation pattern.
Discover 12 top chart patterns for traders to learn more.
How to use crypto chart patterns in your CFD trading strategy
Crypto chart patterns can be incorporated into crypto trading strategies for CFDs – while they can sometimes provide trade signals, they also help traders to recognise emerging scenarios and plan their next steps.
- 1. Identify the crypto chart patternThe first step is to identify the chart pattern and confirm its characteristics. This typically involves drawing trendlines, marking support and resistance levels, and checking volume for confirmation. Many traders use platforms such as TradingView, which include tools to highlight and label common crypto trading patterns.
- 2. Setup & confirmationOnce a potential pattern is spotted, you might use additional indicators to support and confirm the signal. For example, a breakout from a triangle pattern is often considered valid if accompanied by increased trading volume. Such confirmation helps to filter out false signals and low-confidence setups – particularly relevant in volatile markets, where fake-outs are common.
- 3. Planning entries & exitsChart patterns can help structure trade entries, stop-loss placement, and profit targets. For example, after a breakout from a flag pattern, a trader might place a stop-loss just outside the pattern and a profit target based on the size of the preceding move (the ‘flagpole’). It’s common to use chart patterns alongside other technical indicators – such as moving averages – to refine timing.
- 4. Monitor & adapt to crypto market conditionsUnlike traditional markets, crypto trades 24/7, which can increase the frequency of pattern formations but also the likelihood of failed breakouts. Many traders adjust their approach depending on market context – such as avoiding pattern-based trades during major news events, or using longer timeframes to help filter out noise in periods of high volatility.
- 5. Manage riskCrypto chart patterns are best used as part of a broader trading plan. Patterns are not guarantees; they represent probabilities, not certainties, and should be used alongside other forms of analysis. Apply risk management tools – such as stop-loss orders, position sizing, and regular reviews of trade performance – to help mitigate losses if a pattern fails.
Find more techniques on our CFD trading strategies page.
Crypto chart patterns vs indicators: What are the differences?
Both chart patterns and technical indicators serve as key analysis tools for cryptocurrency CFD traders, but they work in distinct ways.
-
Chart patterns are primarily about recognising repeated formations that can suggest particular outcomes (such as a double top signalling a possible reversal). Their interpretation is visual and sometimes open to debate, especially in fast-moving or low-liquidity crypto markets.
-
Indicators are mathematical formulae applied to price or volume data. Popular examples include relative strength index (RSI), moving average convergence divergence (MACD), and Bollinger Bands. Indicators can help to confirm chart pattern signals, highlight when the market is overbought or oversold, or reveal momentum shifts not obvious from price alone.
Here’s how they compare:
|
Chart patterns |
Technical indicators |
|
|
What it is |
Visual shapes formed by historical price movements |
Mathematical formulae applied to price and/or volume data (e.g. averages, oscillators) |
|
What it does |
Signal potential set-ups – such as reversals, continuations, or breakouts – and shifts in sentiment |
Measure trends, momentum, volatility, or overbought/oversold conditions |
|
Timing |
Patterns can develop over minutes, hours, days, or weeks |
Many indicators can be set for any timeframe, from minutes to months |
|
Interpretation |
Subjective – patterns may look different to each trader |
Rule-based; generally more objective |
|
Examples |
Head and shoulders, double top, triangles |
RSI, MACD, moving averages, Bollinger Bands |
Common mistakes when trading crypto chart patterns
Chart patterns can offer useful insights, but using them effectively requires a balanced, methodical approach and robust risk controls. While patterns provide structure to your analysis, several common mistakes may reduce their effectiveness:
Pattern confirmation bias
Seeing a pattern where none exists is a common pitfall. In fast-moving crypto CFD markets, price swings can create shapes that resemble classic patterns but lack the required criteria, such as clear trendlines or volume confirmation. Always check for supporting evidence and avoid forcing a pattern onto the chart.
Relying on patterns alone
Chart patterns should be just one component of your trading approach. Relying solely on visual formations, without considering indicators or broader market context, can lead to false signals – particularly during major news-driven volatility or trading in illiquid altcoin markets.
Ignoring timeframe alignment
Patterns can appear across multiple timeframes, but signals from a 15-minute chart may not hold on a daily chart. A pattern on a lower timeframe does not guarantee the same outlook on a higher timeframe. As a result, applying the same strategy across different timeframes without adjustment can produce misinterpreted set-ups and inconsistent results.
Overlooking failed breakouts
Crypto markets are prone to ‘fake-outs’, where price briefly moves beyond a pattern boundary before reversing. Failing to recognise or prepare for these scenarios, especially without confirmation from volume or supporting indicators, increases the risk of entering low-probability trades.
Neglecting risk management
No pattern is infallible. Entering positions based solely on a chart formation, without both predefined stop-loss and sound position sizing, can expose traders to larger-than-expected losses – particularly during periods of high volatility or sudden market moves.
Chasing after the move
Entering trades late, after a breakout has already extended, is a common mistake. Chasing price action can reduce potential reward and increase risk if the move loses momentum or quickly reverses.
Not reviewing performance
Failing to regularly assess the effectiveness of pattern-based trades may lead to repeating the same errors. Reviewing both successful and failed trades helps to refine your approach and adapt to changing market dynamics.
Want to learn more about crypto trading? Explore our step-by-step crypto course designed to help you understand the basics to the advanced concepts.
FAQs
What are the most common crypto chart patterns?
Some frequently observed crypto chart patterns include head and shoulders, double tops and bottoms, triangles (ascending, descending, and symmetrical), flags, pennants, and wedges. These patterns appear across various timeframes in major cryptocurrencies such as Bitcoin (BTC) and Ethereum (ETH), as well as in many altcoins. Recognising these structures can help frame analysis, but no single pattern appears in every market condition.
Can crypto trading chart patterns predict prices?
Chart patterns reflect the collective behaviour of market participants, offering a way to highlight potential scenarios and suggest probabilities, rather than provide price predictions. While patterns may suggest areas where price could continue or reverse, they do not guarantee specific outcomes. Market volatility, liquidity, and external news events could all impact how – or if – a pattern plays out.
Are chart patterns reliable in volatile crypto markets?
Crypto markets are known for sharp price swings and sudden changes in sentiment. This volatility can make chart patterns less reliable compared to more stable markets, increasing the risk of failed breakouts or fake-outs. Confirmation with other tools – such as volume indicators or support and resistance levels – can help filter out lower-probability setups. Ultimately, patterns should be used as part of a broader approach, not in isolation.
What tools help identify crypto trading patterns?
Most traders use charting platforms, such as TradingView, or native tools provided by their chosen brokerage to spot and analyse chart patterns. These platforms let users draw trendlines, add support and resistance levels, and overlay technical indicators for added context. Automated pattern-recognition features are available on some platforms, but manual analysis remains common practice.