Tron price prediction: What is tron (TRX)?
TRON (TRX/USD) is trading at $0.3212 as of 9:04am UTC on 22 October 2025, after moving within an intraday range of $0.3178–$0.3251. The token remains close to its session high, near the upper end of its recent consolidation band.
Tron (TRX)’s price continues to hold above key support levels as of 22 October 2025, despite broader weakness across the cryptocurrency market, as bitcoin trades near $108,000 (NewsBytes, 22 October 2025) and the US Dollar Index (DXY) eases to 98.88 amid ongoing US government shutdown uncertainty (Trading Economics, 21 October 2025).
The token’s stability follows solid Q3 2025 fundamentals, with network revenue rising 30.5% to $1.2bn and an average of 2.6 million daily active users, second only to Solana (Yahoo Finance, 21 October 2025). The network also retained around 65% of global retail USDT transfers below $1,000, while hosting about half of all circulating USDT supply (CoinDesk, 21 October 2025).
TRON price prediction 2025-2030: Analyst price target view
WalletInvestor (algorithmic forecast)
WalletInvestor’s algorithm-based model projects TRON to trade within a limited range through the end of 2025, with a one-year forecast suggesting minor downside risk. The projection reflects technical indicators showing restricted upward momentum and neutral market sentiment across the platform’s quantitative metrics (Wallet Investor, 20 October 2025).
Changelly (technical analysis forecast)
Changelly anticipates TRX will fluctuate between $0.318 and $0.333 in October 2025, with an average trading price near $0.326. The forecast extends through November, expecting prices to reach a maximum of $0.346 and December showing a potential pullback towards $0.345, as the platform’s models signal short-term consolidation followed by a mild upward trend into year-end (Changelly, 20 October 2025).
CoinCodex (machine learning model)
CoinCodex’s algorithmic model forecasts TRON will trade within a range of $0.3224 to $0.3613 through 2025. The projection uses historical volatility data and Bitcoin halving cycles to generate its price corridor, with technical indicators currently pointing to a neutral outlook for 2025 (CoinCodex, 22 October 2025).
DigitalCoinPrice (long-term algorithmic projection)
DigitalCoinPrice maintains a more positive long-term projection, suggesting TRON could reach up to $2.43 in its maximum-case scenario by the end of the forecast period. The platform’s model incorporates historical price datasets and cyclical cryptocurrency market patterns, though specific milestones for 2025 are not detailed on its main forecast page as of October 2025 (DigitalCoinPrice, 22 October 2025).
Blockchain.News (technical analysis report)
Blockchain.News published a 20 October 2025 analysis targeting $0.35–$0.37 for TRON by November 2025, citing a positive MACD histogram reading of 0.0001 and a neutral RSI of 47.96 as supporting factors. The outlet notes trading volume of $82.8 million on Binance and identifies the $0.35 resistance level as a key breakout threshold, with confidence rated medium-high (75%) for the near-term bullish scenario extending over the next four to six weeks (Blockchain.News, 21 October 2025).
Predictions and third-party forecasts are subject to change and often prove inaccurate, as they can’t account for unexpected market developments. Past performance is not a reliable indicator of future results.
TRX price: Technical overview
TRON (TRX/USD) is trading at $0.3212 as of 9:04am UTC on 22 October 2025, positioned below its intermediate moving average cluster – the 20-, 50-, 100- and 200-day SMAs run at roughly $0.327 / $0.334 / $0.335 / $0.301 – with price sitting between the shorter-term averages and the long-term 200-day support zone, which keeps the near-term picture mixed. The 20-day average remains below the 50-day line, so no short-term bullish alignment is present. Momentum is neutral: the 14-day RSI sits at 46, and the Average Directional Index reads 33, consistent with range-bound conditions while price consolidates within the recent band.
The first area to monitor on the upside is the $0.329 classic pivot; a decisive daily close above this level would bring the $0.334–$0.335 area back into focus near the 50-day SMA and, if cleared on a sustained basis, could open a move towards the $0.360 region (Classic R1) that capped rallies earlier in the quarter.
On pullbacks, initial support lies around the $0.329 pivot and then the $0.303 Classic S1 zone; losing the 200-day SMA near $0.301 would dampen the broader trend and increase the likelihood of a retest of the $0.287–$0.290 area, which has provided a floor in recent weeks (TradingView, 22 October 2025).
This is technical analysis provided for informational purposes only and does not constitute financial advice or a recommendation to buy or sell any instrument.
TRON price history
TRON (TRX) launched in September 2017 and quickly established itself as a blockchain platform focused on decentralised applications and content sharing.
TRX reached its all-time high of $0.231 on 5 January 2018 during the broader cryptocurrency bull market. Throughout 2023 and 2024, TRON’s price was shaped by its expanding role in stablecoin infrastructure – the network became a leading settlement layer for Tether (USDT) transfers, particularly for transactions below $1,000. The coin started 2024 at around $0.105, climbed steadily through the first quarter to $0.138 by mid-March, then eased to $0.109 by late April amid ongoing regulatory scrutiny.
TRX gained momentum in the second half of 2024, reaching $0.435 on 3 December following reports of expanded cross-chain integrations and record network revenue. The token subsequently corrected, falling to $0.219 by 12 December before stabilising, and ended 2024 near $0.253. Despite volatility, TRX closed 2024 at $0.253, marking annual growth of around 140% as TRON accounted for over half of the circulating USDT supply.
As of 22 October 2025, TRON trades at $0.321, approximately 26.8% higher year to date and 105.7% up year on year.
Past performance is not a reliable indicator of future results. Share prices are indicative and may differ from live market prices.
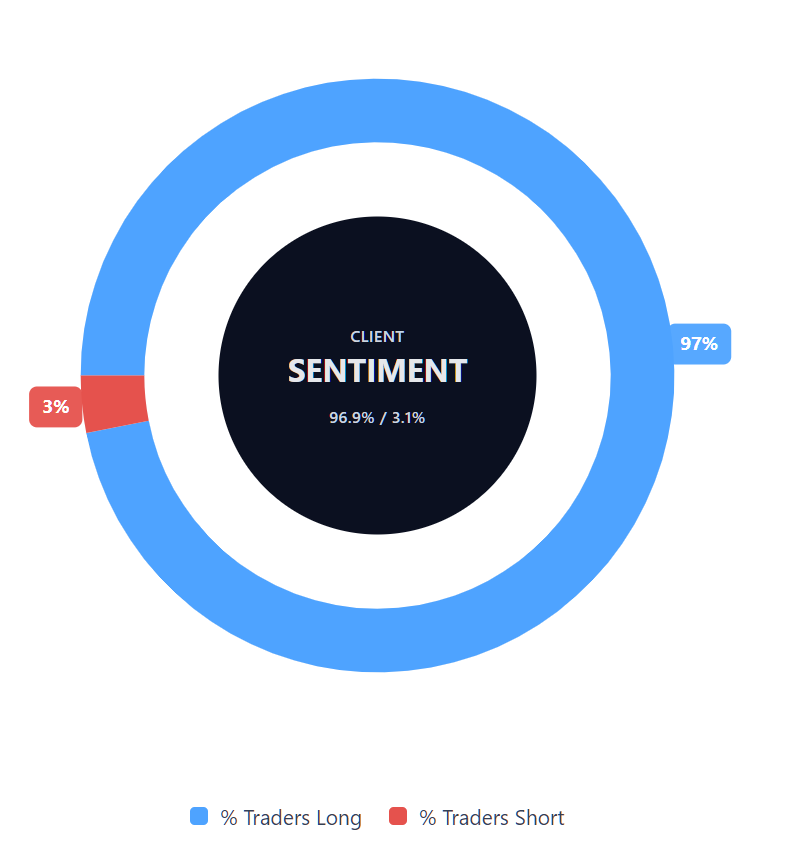
Capital.com’s client sentiment for TRON CFDs
As of 22 October 2025, Capital.com client positioning in TRON CFDs is one-sided, with 96.9% of traders long and 3.1% short, putting buyers ahead by 93.8 percentage points and keeping sentiment in strong long territory. This snapshot represents open positions on Capital.com and is subject to change.
FAQ
What is the TRON price prediction?
According to algorithmic and technical models from several third-party sources, TRON (TRX) may trade within a range of $0.32–$0.37 by the end of 2025, based on indicators such as moving averages and market volatility. Forecasts for 2030 vary widely and should be viewed as indicative only, as they rely on models that cannot account for future market conditions.
Who owns the most TRON?
The TRON Foundation and early network participants hold a significant share of the total TRX supply, though exact ownership data varies across exchanges and blockchain analytics sources. The network also supports a large base of retail users who hold TRX for transfers and decentralised applications.
How many TRONs are there?
As of October 2025, the total circulating supply of TRON (TRX) is approximately 94.66 billion tokens (CoinMarketCap, 22 October 2025). The network does not have a fixed maximum supply, allowing new TRX to enter circulation through its native ecosystem processes.
Could TRON’s price go up or down?
TRON’s price, like other cryptocurrencies, is influenced by market demand, liquidity and overall digital asset trends. Technical indicators can provide insight into short-term conditions, but prices can move in either direction, depending on market developments and investor sentiment. Past performance is not a reliable indicator of future results.
Should I invest in TRON?
Capital.com does not provide investment advice. Whether TRON is suitable for you depends on your individual circumstances, risk tolerance and trading objectives. It’s important to research the market, understand the risks of CFD trading, and use appropriate risk-management tools before opening any position. Contracts for difference (CFDs) are traded on margin – leverage amplifies both profits and losses.