

Bitcoin price prediction: third-party outlook
Bitcoin (BTC) is trading around $79,725 as of 9:01am UTC on 27 August 2026, after US spot bitcoin ETFs drew around $500 million on 21 August. Explore third-party BTC price targets and technical analysis. Past performance is not a reliable indicator of future results.
Bitcoin (BTC/USD) is trading at $79,725 as of 9:01am UTC on 27 August 2026, within the session’s $77,782.50–$79,782.60 intraday range. Past performance is not a reliable indicator of future results.
Recent moves have coincided with renewed demand for US spot bitcoin ETFs, after around $500 million flowed into the products on 21 August. The US Treasury’s decision to increase longer-dated debt buybacks also coincided with dollar selling, while regulation remains in focus after President Donald Trump urged Congress to advance the Clarity Act (The Wall Street Journal, 25 August 2026).
Bitcoin price prediction 2026-2030: Analyst price target view
As of 27 August 2026, third-party BTC price predictions span different timeframes and methodologies, with liquidity, institutional demand, technical conditions and the macro backdrop among the main assumptions.
CoinGape (near-term model forecast)
CoinGape forecasts Bitcoin at $78,109.53 on 28 August and $78,961.77 by 27 September 2026. Its three-month indicator is close to evenly split, at 51% bullish and 49% bearish, indicating limited directional conviction in the model (CoinGape, 27 August 2026).
CoinCodex (year-end model forecast)
CoinCodex forecasts Bitcoin at $78,628 by the end of 2026. Its December model range runs from $74,948 to $78,628, based on its algorithmic forecasting methodology (CoinCodex, 25 August 2026).
CoinDCX (medium-term forecast)
CoinDCX forecasts Bitcoin at $81,000 for August 2026 and $89,000 by December. Its wider 2026 projection spans $67,832–$93,000, with the outlook linked to moving-average support and momentum indicators that may shift as market conditions change (CoinDCX, 26 August 2026).
Standard Chartered (year-end bank forecast)
Standard Chartered maintains a $100,000 Bitcoin target for the end of 2026. The bank links its outlook to US Treasury liquidity measures and spot bitcoin ETF flows, while recognising that changing market conditions could alter the path towards that target (Yahoo Finance, 21 August 2026).
Bernstein (medium-term institutional forecast)
Bernstein forecasts Bitcoin at $150,000 by mid-2027, with a longer-term cycle peak of around $300,000 in 2029. The firm cites a broader 'debasement trade' and an updated Bitcoin cycle outlook among the assumptions behind its base case (The Block, 26 August 2026).
Predictions and third-party forecasts are inherently uncertain, as they cannot fully account for unexpected market developments. Past performance is not a reliable indicator of future results.
Bitcoin latest and upcoming market developments
Bitcoin is trading at $79,725 at 9:01am UTC on 27 August 2026, within the session’s $77,782.50–$79,782.60 range. Recent activity has coincided with renewed demand for US spot bitcoin exchange-traded funds, which recorded about $1.6 billion in net inflows from 17–20 August, including roughly $606 million on 20 August (The Wall Street Journal, 21 August 2026).
Broader liquidity conditions are also in focus. The US Treasury said on 19 August that it would at least double the maximum size of longer-dated nominal bond buyback operations from $2 billion to $4 billion, effective 9 September. The change may affect market liquidity, while its relationship with US yields, the dollar and demand for alternative assets can vary as markets reassess monetary and fiscal policy (US Department of the Treasury, 19 August 2026).
Regulation remains another theme. The Commodity Futures Trading Commission held its inaugural Innovation Advisory Committee meeting on 20 August, with cryptocurrency regulation among the topics discussed (CFTC, 21 August 2026). Attention also turns to Federal Reserve Chair Kevin Warsh’s Jackson Hole speech on 28 August, followed by the August US employment report on 4 September and consumer price index data on 11 September (Federal Reserve, 27 August 2026; US Bureau of Labor Statistics, 27 August 2026).
BTC price: technical overview
The BTC/USD price trades at $79,725 as of 9:01am UTC on 27 August 2026. The daily simple moving-average cluster sits at $69,683 / $66,412 / $66,166 / $69,224 across the 20/50/100/200-day periods, with the 20-day average above the 50-day average.
Momentum is stretched on the supplied daily readings. The 14-day relative strength index stands at 81.5, above the 70 level used here to indicate stretched momentum. The average directional index at 38.5 indicates an established trend without showing direction, while the stochastic relative strength index fast reading of 88.0 sits near the upper end of its range.
Above the current price, the nearest classic pivot is R3 at $80,795. A daily close above that level would place Bitcoin beyond the highest classic resistance reference in the supplied data, while the Hull moving average at $80,217 provides a closer technical marker.
Below spot, the classic pivot at $62,487 provides the initial pivot reference. The nearer long-term moving-average shelf sits at $69,224 on the 200-day simple moving average, while classic S1 stands lower at $58,084 if price weakens further (TradingView, 27 August 2026).
This is technical analysis for informational purposes only and does not constitute financial advice or a recommendation to buy or sell any instrument.
Bitcoin price history (2024–2026)
BTC/USD’s price started the two-year period at $59,098.15 on 28 August 2024. After falling to an intraday low of $52,715.35 on 6 September, it recovered through the final quarter and ended 2024 at $93,405.95.
Bitcoin continued higher into early 2025, reaching $109,146.45 intraday on 20 January before trading above $120,000 during the summer. It later set a two-year intraday high of $126,287.15 on 6 October, then reversed lower and finished 2025 at $87,524.25.
Price swings remained wide in 2026. Bitcoin reached $97,961.95 on 14 January before falling to $60,206.85 on 6 February. It later recovered above $80,000 in May, moved below $60,000 again in late June, then rebounded during August.
Bitcoin trades at $79,725 as of 9:01am UTC on 27 August 2026, around 8.9% below its 2025 year-end close and approximately 34.9% above its 28 August 2024 close.

Past performance is not a reliable indicator of future results. Prices are indicative and may differ from live market prices.
Capital.com analyst view: Bitcoin
Bitcoin’s 2026 price action has remained volatile, with BTC trading at $79,725 at 9:01am UTC on 27 August. Recent US spot bitcoin ETF inflows have coincided with higher prices and may provide support if demand persists. However, weaker flows or renewed outflows could work in the opposite direction, particularly if broader risk appetite deteriorates (The Wall Street Journal, 21 August 2026).
US liquidity and monetary policy add another layer. The Treasury will at least double the maximum size of longer-dated nominal bond buybacks to $4 billion per operation from 9 September. Greater liquidity or lower yields could coincide with stronger demand for risk assets, while elevated yields or a firmer US dollar could weigh on Bitcoin. Kevin Warsh’s Jackson Hole remarks on 28 August may also shift rate expectations, with a less restrictive signal potentially supportive and a tighter stance potentially working against BTC. (US Department of the Treasury, 19 August 2026)
Capital.com’s client sentiment for Bitcoin CFDs
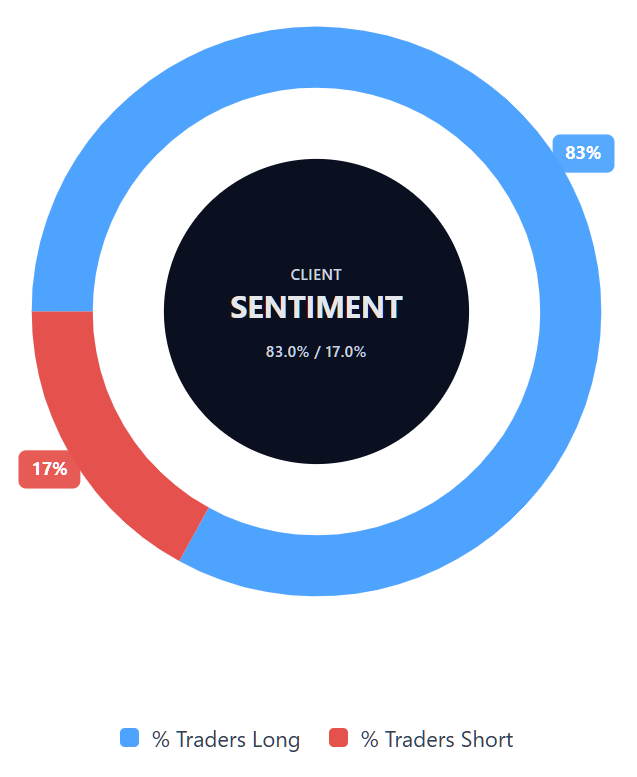
As of 27 August 2026, Capital.com client positioning in Bitcoin CFDs is 83% buyers vs 17% sellers, putting buyers ahead by 66.0 percentage points and meaning buyer positions represent the majority of this snapshot. This snapshot reflects open positions on Capital.com and can change.
Summary – Bitcoin (2026)
- Bitcoin trades at $79,725 at 9:01am UTC on 27 August 2026, around 34.9% above its 28 August 2024 close.
- According to TradingView data, technical indicators show stretched momentum, with the relative strength index at 81.5, while BTC remains above its 100- and 200-day simple moving averages.
- Key drivers include US spot bitcoin ETF flows, Federal Reserve policy expectations, Treasury liquidity conditions and broader financial-market risk sentiment.
- Recent attention centres on ETF inflows, US Treasury bond-buyback changes, cryptocurrency regulation and Kevin Warsh’s Jackson Hole remarks on 28 August.
Past performance is not a reliable indicator of future results.
FAQ
What is the latest Bitcoin crypto price prediction?
The third-party forecasts covered in this article vary significantly by timeframe and methodology. Recent estimates range from below $80,000 in the near term to $100,000 by the end of 2026 and $150,000 by mid-2027. These projections reflect different assumptions around liquidity, institutional demand, ETF flows and macroeconomic conditions. Forecasts can change as those assumptions shift, so they shouldn’t be treated as certain outcomes.
Who owns the most Bitcoin?
It isn’t possible to identify the largest Bitcoin owner with certainty because blockchain addresses are pseudonymous. Bitcoin’s creator, Satoshi Nakamoto, is commonly estimated to control roughly 1.1 million BTC across early-mined addresses, although that attribution hasn’t been conclusively proven. Among publicly disclosed corporate holdings, Strategy reported 840,447 BTC as of 16 August 2026, illustrating the scale of institutional ownership alongside unidentified private wallets (CryptoRank, 17 August 2026).
How many Bitcoins are there?
Bitcoin’s protocol limits total issuance to 21 million BTC, with new coins entering circulation through mining at a decreasing rate. CoinMarketCap reported around 20.08 million BTC in circulation in late August 2026, leaving fewer than one million still to be issued. The circulating figure can differ from the amount actively available because some Bitcoin may be held long term or become inaccessible through lost private keys.
Could Bitcoin’s price go up or down?
Yes. Bitcoin can move in either direction as market conditions change. Continued spot bitcoin ETF inflows, greater market liquidity or lower interest-rate expectations could support demand, while ETF outflows, higher yields or a stronger US dollar could weigh on prices. Regulation, broader risk sentiment and cryptocurrency-specific events can also influence BTC, although no single factor determines direction and markets may react differently as expectations change.
Should I invest in Bitcoin?
Whether Bitcoin is appropriate for an individual depends on their circumstances, objectives and tolerance for risk, so this article doesn’t provide investment advice. Bitcoin has experienced substantial price increases over some periods, but also sharp declines, including large swings during 2025 and 2026. Anyone considering exposure should account for cryptocurrency volatility, potential regulatory changes and, where derivatives are used, the additional risks associated with leverage.
Can I trade Bitcoin CFDs on Capital.com?
Yes, you can trade Bitcoin CFDs on Capital.com. Trading crypto CFDs lets you speculate on price movements without owning the underlying asset and to take long or short positions. However, contracts for difference (CFDs) are traded on margin, and leverage amplifies both profits and losses. You should ensure you understand how CFD trading works, assess your risk tolerance, and recognise that losses can occur quickly.